By WUWT regular “Just The Facts”
With the help of an array of WUWT reader comments on this thread and several others documented within, I’ve been compiling a summary of all potential climatic variables in order to build a conceptual map of Earth’s climate system. The goals of this exercise include; To gain a bigger picture understanding and perspective of Earth’s climate system. To demonstrate that Earth’s climate system is a ridiculously complex, continually evolving and sometimes chaotic beast, with the plethora of variables, many interdependencies and an array of feedbacks, both positive and negative. To highlight the challenges associated with accurately measuring the current state, as well as predicting the trajectory and likely future state of Earth’s climate system many decades into the future. To build the WUWT Potential Climatic Variables Reference Page. To lay the conceptual groundwork for the WUWT Likely Climatic Variables Reference Page.
Your help in completing this exercise would be most appreciated. Please take a look through the list below and let me know if you have any additions, suggestions or corrections. For those of you who’ve already read this list, it has grown significantly, especially the later portions. Please pay particular attention to Section 9. Albedo, as most of the content is new, thus it may need more work, and I’m also trying out a different linking/reference format. Your input on preferences between the linking/reference format in Section 9, versus the rest of the document would be most appreciated.
Note: The list below is an evolving document that continues to undergo significant revisions and improvements based upon crowdsourcing input of an array of WUWT contributors. Additionally, this list was posted in a prior article and in comments on WUWT a few times previously, receiving input from a vast number of contributors. This thread, along with these precursor threads will serve as the bibliography for the forthcoming WUWT Potential Climatic Variables Reference Page.
Wikipedia Note: The list relies heavily upon Wikipedia, due to the fact that it is the only source that offers reasonably coherent content on such broad range of subjects. However, there are know issues with Wikpedia’s content, especially biases in their climate articles. As such, please take care to view any Wikipedia articles with a critical eye and check Wikipedia’s references to evaluate the credibility of their sources. Additionally, in comments, please provide your suggestions of articles from alternate sources that can be added to this list in order to help readers to easily verify the veracity of the Wikipedia articles within.
1. Earth’s Rotational Energy;
http://en.wikipedia.org/wiki/Rotational_energy
http://en.wikipedia.org/wiki/Earth%27s_rotation
http://www.physicalgeography.net/fundamentals/6h.html
results in day and night;
http://wiki.answers.com/Q/Why_does_rotation_cause_day_and_night
causes the Coriolis Effect;
http://en.wikipedia.org/wiki/Coriolis_effect
imparts Planetary Vorticity on the oceans;
http://oceanworld.tamu.edu/resources/ocng_textbook/chapter12/chapter12_01.htm
and manifests as Ocean Gyres;
http://en.wikipedia.org/wiki/Ocean_gyre
the Antarctic Circumpolar Current;
http://en.wikipedia.org/wiki/Antarctic_Circumpolar_Current
http://en.wikipedia.org/wiki/File:Conveyor_belt.svg
Arctic Ocean Circulation;
http://www.whoi.edu/page.do?pid=12455&tid=441&cid=47170&ct=61&article=20727
http://www.john-daly.com/polar/flows.jpg
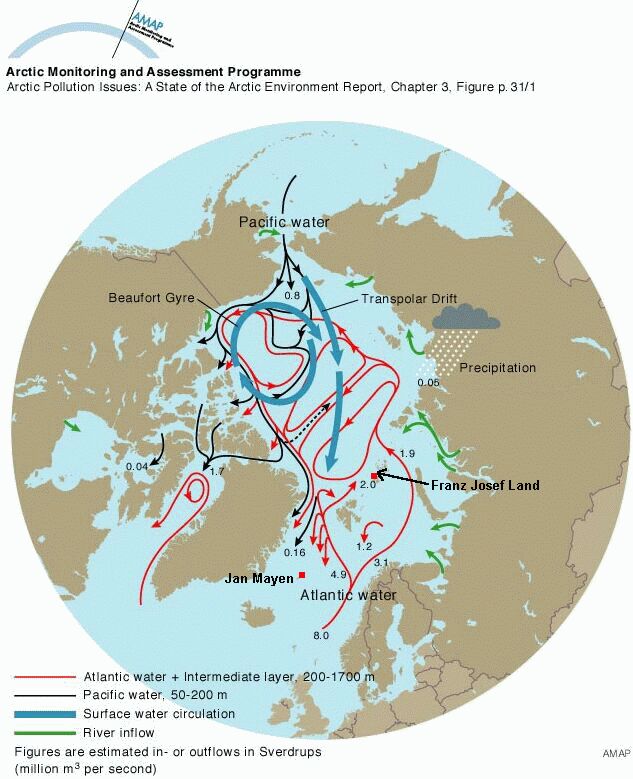
can result in the formation of Polynya;
http://en.wikipedia.org/wiki/Polynya
and causes the Equatorial Bulge:
http://en.wikipedia.org/wiki/Equatorial_bulge
Earth’s Rotational Energy influences Atmospheric Circulation;
http://en.wikipedia.org/wiki/Atmospheric_circulation
including the Jet Stream;
http://en.wikipedia.org/wiki/Jet_stream
Westerlies;
http://en.wikipedia.org/wiki/Westerlies
Tradewinds;
http://en.wikipedia.org/wiki/Trade_wind
Geostrophic Wind;
http://en.wikipedia.org/wiki/Geostrophic_wind
Surface Currents;
http://www.windows2universe.org/earth/Water/ocean_currents.html
http://en.wikipedia.org/wiki/Ocean_current
through Ekman Transport;
http://en.wikipedia.org/wiki/Ekman_transport
http://oceanmotion.org/html/background/ocean-in-motion.htm
Tropical Cyclones;
http://en.wikipedia.org/wiki/Tropical_cyclone
possibly Tornadoes;
http://en.wikipedia.org/wiki/Tornado
however, Windows To The Universe states that, “because there are records of anticyclonic tornadoes, scientists don’t think that the Coriolis Effect causes the rotations.”;
http://www.windows2universe.org/earth/Atmosphere/tornado/formation.html
and Polar Vortices;
http://en.wikipedia.org/wiki/Polar_vortex
http://wattsupwiththat.com/reference-pages/polar-vortex/
which “are caused when an area of low pressure sits at the rotation pole of a planet. This causes air to spiral down from higher in the atmosphere, like water going down a drain.”
http://www.universetoday.com/973/what-venus-and-saturn-have-in-common/
Here’s an animation of the Arctic Polar Vortex in Winter 2008 – 09:
When a Polar Vortex splits or breaks down it can cause a Sudden Stratospheric Warming:
http://en.wikipedia.org/wiki/Sudden_stratospheric_warming
http://earthobservatory.nasa.gov/IOTD/view.php?id=36972
Rossby Waves;
http://en.wikipedia.org/wiki/Rossby_wave
are a subset of Inertial Waves:
http://en.wikipedia.org/wiki/Inertial_waves
“Atmospheric Rossby Waves emerge due to shear in rotating fluids, so that the Coriolis force changes along the sheared coordinate. In planetary atmospheres, they are due to the variation in the Coriolis effect with latitude.1” “Atmospheric Rossby waves are giant meanders in high-altitude winds that are a major influence on weather”1 and “are principally responsible for the Brewer-Dobson circulation”;
http://en.wikipedia.org/wiki/Brewer-Dobson_circulation
http://www.ccpo.odu.edu/~lizsmith/SEES/ozone/class/Chap_6/6_4.htm
Atmospheric Rossby Waves “are not to be confused with Oceanic Rossby Waves, which move along the thermocline: that is, the boundary between the warm upper layer of the ocean and the cold deeper part of the ocean.” “Oceanic Rossby waves are thought to communicate climatic changes due to variability in forcing, due to both the wind and buoyancy. Both barotropic and baroclinic waves cause variations of the sea surface height, although the length of the waves made them difficult to detect until the advent of satellite altimetry. Baroclinic waves also generate significant displacements of the oceanic thermocline, often of tens of meters. Satellite observations have revealed the stately progression of Rossby waves across all the ocean basins, particularly at low- and mid-latitudes. These waves can take months or even years to cross a basin like the Pacific.”http://en.wikipedia.org/wiki/Rossby_wave
Earth’s Rotational Energy influences Plate Tectonics;
http://en.wikipedia.org/wiki/Plate_tectonics
“By analyzing the minute changes in travel times and wave shapes for each doublet, the researchers concluded that the Earth’s inner core is rotating faster than its surface by about 0.3-0.5 degrees per year.
That may not seem like much, but it’s very fast compared to the movement of the Earth’s crust, which generally slips around only a few centimeters per year compared to the mantle below, said Xiaodong Song, a geologist at the University of Illinois at Urbana-Champaign and an author on the study.
http://www.livescience.com/9313-earth-core-rotates-faster-surface-study-confirms.html
The surface movement is called plate tectonics. It involves the shifting of about a dozen major plates and is what causes most earthquakes”;
http://en.wikipedia.org/wiki/Earthquake
Volcanoes;
http://en.wikipedia.org/wiki/Volcano
and Mountain Formation;
http://en.wikipedia.org/wiki/Mountain_formation
which can influence the creation of Atmospheric Waves:
http://en.wikipedia.org/wiki/Atmospheric_wave
Rotational Energy is the primary driver of Earth’s Dynamo;
http://en.wikipedia.org/wiki/Dynamo_theory
which generates Earth’s Magnetic Field;
http://en.wikipedia.org/wiki/Earth%27s_magnetic_field
and is primarily responsible for the Earthly behaviors of the Magnetosphere;
http://en.wikipedia.org/wiki/Magnetosphere
with certain secular variations in Earth’s magnetic field originating from ocean flow/circulation;
http://news.nationalgeographic.com/news/2009/06/090622-earths-core-dynamo.html
http://iopscience.iop.org/1367-2630/11/6/063015/fulltext
though Leif Svalgaard notes that these are minor variations, as the magnetic field originating from ocean flow/circulation “is 1000 times smaller than the main field generated in the core.”
Earth Core Changes:
http://physicsworld.com/cws/article/news/42580
appear “to be generated in the Earth’s core by a dynamo process, associated with the circulation of liquid metal in the core, driven by internal heat sources”. “Molten iron flowing in the outer core generates the Earth’s geodynamo, leading to a planetary-scale magnetic field. Beyond this, though, geophysicists know very little for certain about the field, such as its strength in the core or why its orientation fluctuates regularly. Researchers do suspect, however, that field variations are strongly linked with changing conditions within the molten core.” These core changes
influence the Magnetosphere;
http://en.wikipedia.org/wiki/Magnetosphere
including movement of the Geomagnetic Poles:
http://www.ngdc.noaa.gov/geomag/GeomagneticPoles.shtml
http://news.nationalgeographic.com/news/2009/12/091224-north-pole-magnetic-russia-earth-core.html
Also of note, “Over millions of years, [Earth’s] rotation is significantly slowed by gravitational interactions with the Moon: see tidal acceleration.”
http://en.wikipedia.org/wiki/Tidal_acceleration
“Tidal acceleration is an effect of the tidal forces between an orbiting natural satellite (e.g. the Moon), and the primary planet that it orbits (e.g. the Earth). The “acceleration” is usually negative, as it causes a gradual slowing and recession of a satellite in a prograde orbit away from the primary, and a corresponding slowdown of the primary’s rotation. The process eventually leads to tidal locking of first the smaller, and later the larger body. The Earth-Moon system is the best studied case.”
“The presence of the moon (which has about 1/81 the mass of the Earth), is slowing Earth’s rotation and lengthening the day by about 2 ms every one hundred years.”
Lastly Length of Day (LOD);
http://en.wikipedia.org/wiki/Day_length
“varies when any mass on or in the Earth moves, affecting the state of its angular momentum. Take weather in the atmosphere, for instance. The seasonal changes in the trade winds and monsoons have a well-known effect on the length-of-day over the course of the year. The IERS calculates the angular momentum of the whole atmosphere every six hours, allowing the signal of large-scale weather systems to be detected.
The tides of the ocean have the long-term effect of slowing the Earth down and speeding up the Moon (which thus moves away from Earth a few centimeters per year). They also have short-term effects that are being modeled more accurately all the time. Changes in ocean currents change the length-of-day. Our computer models of ocean circulation are getting good enough, thanks to centimeter-precise measurements of the sea surface, that we can analyze this signal too. The National Earth Orientation Service has a page explaining this stuff in clear detail. (These are also the people who announce leap seconds.)
Other factors affecting the LOD data include rises and subsidences of the land surface, the buildup of glaciers, large earthquakes, large-scale pumping of groundwater and construction of reservoirs, and the shape of the ocean’s surface in response to air masses above it.”
and slightly from the accumulated mass of incoming space debris:
http://www.physlink.com/education/askexperts/ae75.cfm
“The last level of variation, a slow drift on the decade scale, seems to be related to the motion of liquid iron in the Earth’s core. This layer allows the solid inner core to rotate freely with respect to the outer mantle and crust. Thus every twist and torque exerted by the atmosphere, oceans, Moon, Sun, other planets and the rest of the universe stirs that inner iron ocean, affecting the great dynamo that drives the Earth’s magnetic field.”
http://geology.about.com/od/tectonicsdeepearth/a/lodresearch.htm
“An analysis of time variations in the earth’s length of day (LOD) for 25 years (1973–1998) versus atmospheric circulation changes and lunar phase is presented. It is found that, on the average, there is a 27.3-day and 13.6-day period oscillation in global zonal wind speed, atmospheric geopotential height, and LOD following alternating changes in lunar phase. Every 5–9 days (6.8 days on average), the fields of global atmospheric zonal wind and geopotential height and LOD undergo a sudden change in relation to a change in lunar declination. The observed atmospheric oscillation with this time period may be viewed as a type of atmospheric tide.”
http://www.springerlink.com/content/j07x681174454l02/
“The third important index is Length of Day (LOD) – a geophysical index that characterizes variation in the earth rotational velocity. Full time series of LOD cover more than 350 years, with the most reliable data obtained in the last 150 years (Stephenson and Morrison 1995). The long-term LOD dynamics is in close correlation with the dynamics of the main commercial fish stocks (Klyashtorin and Sidorenkov 1996).”
http://www.fao.org/docrep/005/y2787e/y2787e03.htm
“When detrended, the graphs of -LOD and dT are very similar in shape, and it is clear that -LOD runs several years ahead of dT, especially in its maxima. Shifting the -LOD curve by 6 years to the right (Figure 2.2b) results in almost complete coincidence of the corresponding maxima of the early 1870s, late 1930s, and middle of 1990s (Klyashtorin et al. 1998).”
“Often the movements of the moon transiting the West Coast are accompanied by a shift in the jet stream to the south as the moon passes the coast. This gives the appearance that the southward motion in latitude is accompanied by a southward motion in the jet stream. This is not always the case due to a number of other patterns but it can be thought of as a general rule of thumb.”
http://docweather.com/4/show/211/
Earth’s rotation is slowing “due to a transfer of Earth’s rotational momentum to the Moon’s orbital momentum as tidal friction slows the Earth’s rotation. That increase in the Moon’s speed is causing it to slowly recede from Earth (about 4 cm per year), increasing its orbital period and the length of a month as well.” “The slowing rotation of the Earth results in a longer day as well as a longer month. Once the length of a day equals the length of a month, the tidal friction mechanism will cease. (ie. Once your speed on the track matches the speed of the horses, you can’t gain any more speed with your lasso trick.) That’s been projected to happen once the day and month both equal about 47 (current) days, billions of years in the future. If the Earth and Moon still exist, the Moon’s distance will have increased to about 135% of its current value.”
http://www.physlink.com/education/askexperts/ae695.cfm
“However some large scale events, such as the 2004 Indian Ocean earthquake, have caused the rotation to speed up by around 3 microseconds.[21] Post-glacial rebound, ongoing since the last Ice age, is changing the distribution of the Earth’s mass thus affecting the Moment of Inertia of the Earth and, by the Conservation of Angular Momentum, the Earth’s rotation period.”
http://en.wikipedia.org/wiki/Earth%27s_rotation
In this paper, “Are Changes in the Earth’s Rotation Rate Externally Driven and Do They Affect Climate?”, by Ian R. G. Wilson, the General Science Journal, 2011, “evidence is presented to show that the phases of two of the Earth’s major climate systems, the North Atlantic Oscillation (NAO) and the Pacific Decadal Oscillation (PDO), are related to changes in the Earth’s rotation rate. We find that the winter NAO index depends upon the time rate of change of the Earth’s length of day (LOD). In addition, we find that there is a remarkable correlation between the years where the phase of the PDO is most positive and the years where the deviation of the Earth’s LOD from its long-term trend is greatest.”
http://www.wbabin.net/files/4424_wilson.pdf
In this paper, “On the correlation between air temperature and the core Earth processes: Further investigations using a continuous wavelet analysis” by Stefano Sello, Mathematical and Physical Models, 2011;
http://arxiv.org/pdf/1103.4924.pdf
The authors main results are: ”…the detection of a broadband variability centered at 78 yr (common variability ranges from 67 to 86 yr from SSA method). Oscillations in global temperatures with periods in the 65-70 yr are well known. Our work suggests that the same core processes that are known to affect Earth’s rotation and magnetic field may also contribute to the excitation of such modes, possibly through geomagnetic modulation of near-Earth charged particle fluxes that may influence cloud nucleation processes, and hence the planetary albedo, on regional as well as global scales.”
2. Orbital Energy, Orbital Period, Elliptical Orbits (Eccentricity), Tilt (Obliquity) and Wobble (Axial precession);
http://en.wikipedia.org/wiki/Specific_orbital_energy
http://en.wikipedia.org/wiki/Synodic
http://www.physicalgeography.net/fundamentals/6h.html
creates Earth’s seasons;
http://en.wikipedia.org/wiki/Season
which drives annual changes in Arctic Sea Ice;
and Antarctic Sea Ice;
the freezing and melting of which helps to drive the Thermohaline Circulation;
http://en.wikipedia.org/wiki/Thermohaline_circulation
and can result in the formation of Polynyas:
http://en.wikipedia.org/wiki/Polynya
Earth’s orbit around the Sun, Earth’s tilt, Earth’s wobble and the Moon’s orbit around Earth, Earth’s Rotation, and the gravity of the Moon, Sun and Earth, act in concert to determine the constantly evolving Tidal Force on Earth:
http://en.wikipedia.org/wiki/Tidal_force
This Tidal Force is influenced by variations in Lunar Orbit;
http://en.wikipedia.org/wiki/Orbit_of_the_Moon
as seen in the Lunar Phases;
http://en.wikipedia.org/wiki/Lunar_phase
Lunar Precession;
http://en.wikipedia.org/wiki/Lunar_precession
Lunar Node;
http://en.wikipedia.org/wiki/Lunar_node
Saros cycles;
http://en.wikipedia.org/wiki/Saros_cycle
and Inex cycles:
http://en.wikipedia.org/wiki/Inex
The combined cycles of the Saros and Inex Cycles can be visualized here:
http://eclipse.gsfc.nasa.gov/SEsaros/image/SEpanoramaGvdB-big.JPG
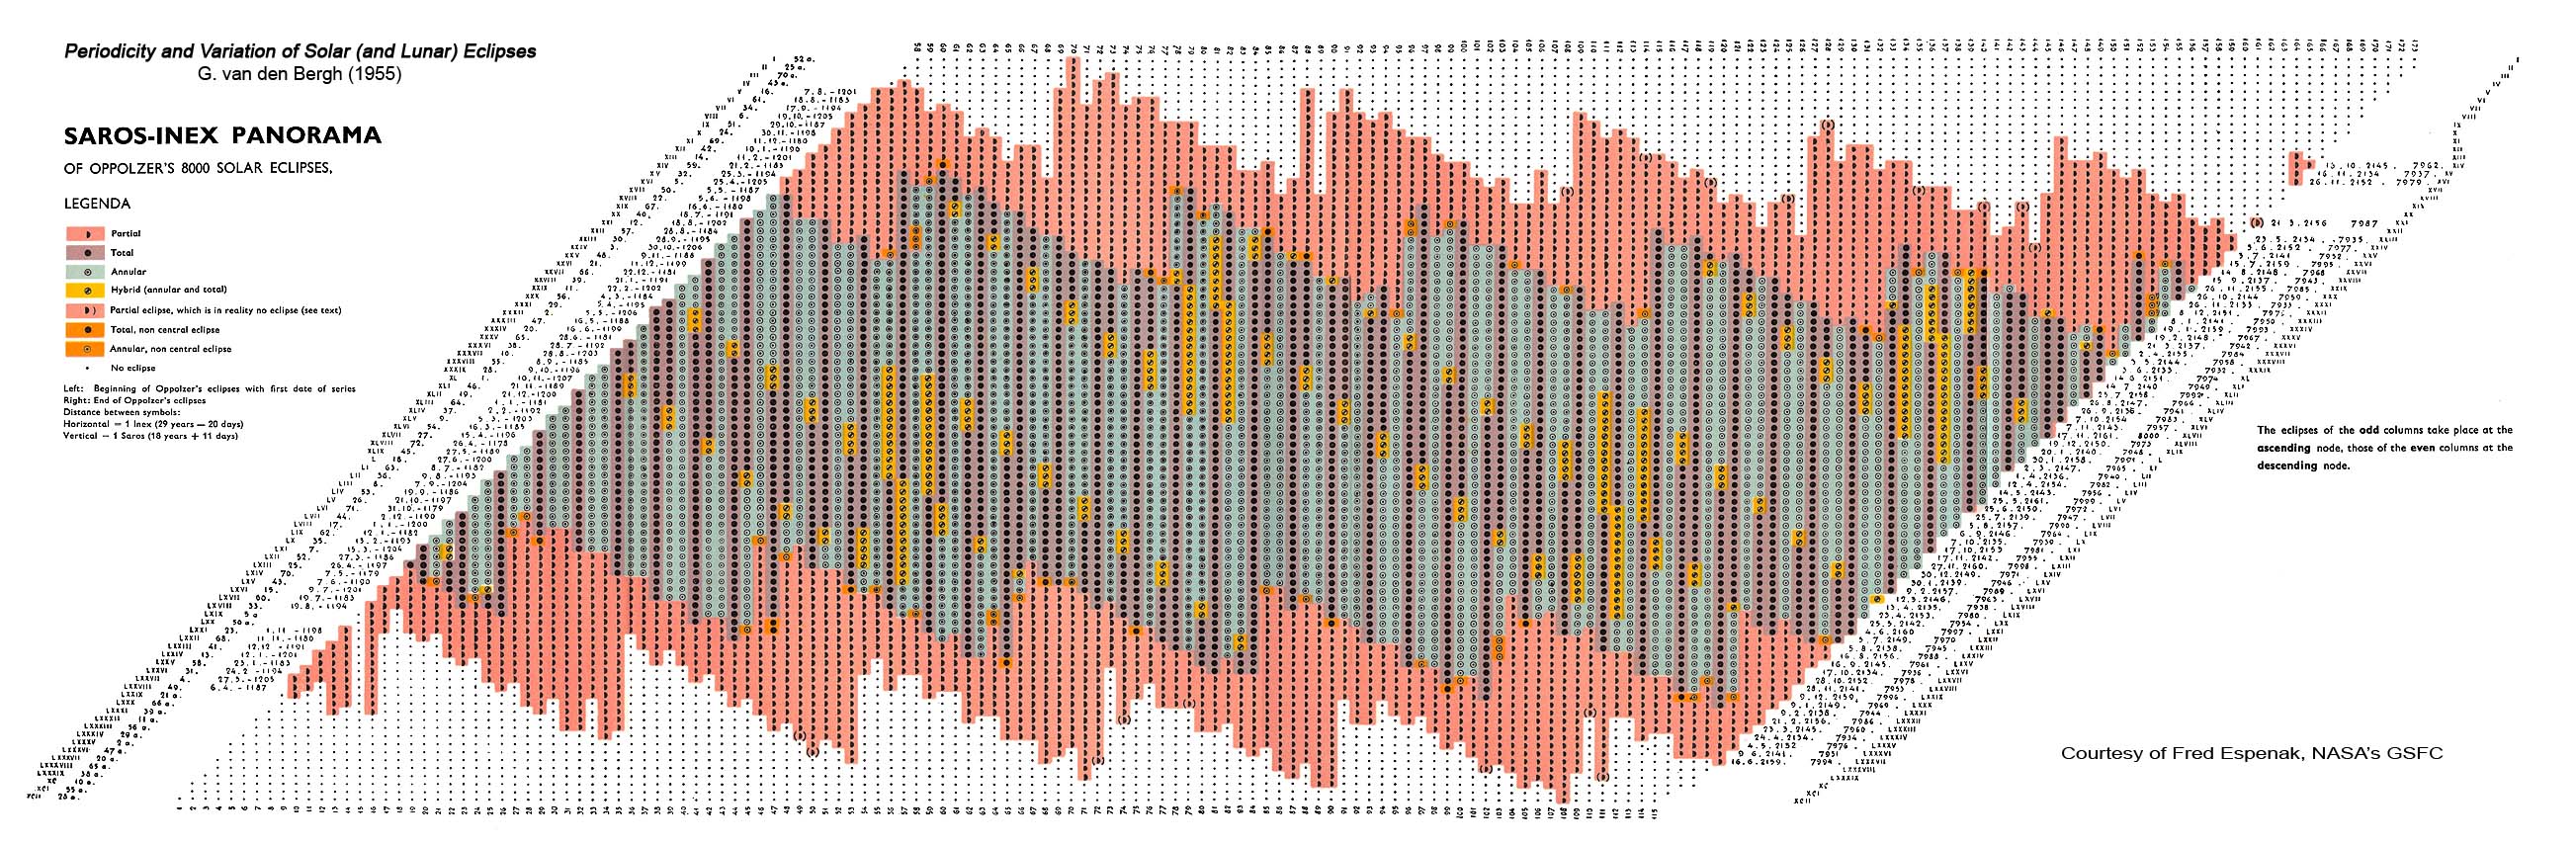
Keeling and TWhorf propose in Geophysics, 2000 “that such abrupt millennial changes, seen in ice and sedimentary core records, were produced in part by well characterized, almost periodic variations in the strength of the global oceanic tide-raising forces caused by resonances in the periodic motions of the earth and moon. A well defined 1,800-year tidal cycle is associated with gradually shifting lunar declination from one episode of maximum tidal forcing on the centennial time-scale to the next. An amplitude modulation of this cycle occurs with an average period of about 5,000 years, associated with gradually shifting separation-intervals between perihelion and syzygy at maxima of the 1,800-year cycle. We propose that strong tidal forcing causes cooling at the sea surface by increasing vertical mixing in the oceans. On the millennial time-scale, this tidal hypothesis is supported by findings, from sedimentary records of ice-rafting debris, that ocean waters cooled close to the times predicted for strong tidal forcing.”
http://www.ncbi.nlm.nih.gov/pmc/articles/PMC18099/
“When perigee, perihelion, and either the new or full moon occur at approximately the same time, considerably increased tidal ranges result. When apogee, aphelion, and the first- or third-quarter moon coincide at approximately the same time, considerably reduced tidal ranges will normally occur.”
“Lunar Declination Effects: The Diurnal Inequality. The plane of the moon’s orbit is inclined only about 5 degrees to the plane of the earth’s orbit (the ecliptic) and thus the moon monthly revolution around the earth remains very close to the ecliptic. The ecliptic is inclined 23.5 degrees to the earth’s equator, north and south of which the sun moves once each half year to produce the seasons. In similar fashion, the moon, in making a revolution around the earth once each month, passes from a position of maximum angular distance north of the equator to a position of maximum angular distance south of the equator during each half month. (Angular distance perpendicularly north and south of the celestial equator is termed declination.) twice each month, the moon crosses the equator.”
http://co-ops.nos.noaa.gov/restles4.htm
Richard Holle argues that “The solar wind inductive effects, drive the lunar declinational movement, which in turn drives the atmospheric declinational tides. The declinational movement of the Moon hangs at the culmination almost three days, as the polarity of the solar wind peaks and reverses. This produces the surges in the meridional flow, visible in the satellite photos as turbulence.”
“The Metonic cycle is a 19-year period when the lunar declination is at the culmination of movement on the same date as it was 19 years ago, as well as the same light phase. The Saros cycle is ~17 days longer than 18 years, and it is a repeating pattern of the position of the Earth / Moon and inner planets due to harmonic interactions, causing the Solar / lunar eclipses to repeat predictably at this period. The 18.6 year Mn cyclic patterns of the variation of the moon’s declinational movement result from the progression of the nodes that varies the declinational angle from the ~18.5 degrees minimum to ~28.5 maximum.”
http://research.aerology.com/aerology-analog-weather-forecasting-method/
“Moon’s influence upon the Jet stream via declination. Often the movements of the moon transiting the West Coast are accompanied by a shift in the jet stream to the south as the moon passes the coast. This gives the appearance that the southward motion in latitude is accompanied by a southward motion in the jet stream. This is not always the case due to a number of other patterns but it can be thought of as a general rule of thumb.
The phenomenon of the effects of declination on the jet stream of the eastern Pacific can be related to the work of a Chinese researcher LI Guoqing of the Institute of Atmospheric Physics, in Beijing. The paper entitled, 27.3 and 13.6 day Atmospheric Tide and Lunar Forcing on Atmospheric Circulation [PDF] researches the influence of the earth’s length of day (LOD) in relation to the geopotential height of the 500mb fields in the eastern Pacific and the declination of the moon. It was found that there is an alternating increase and decrease in geopotential height in the eastern Pacific in approximately seven day cycles that are keyed not to the phases of the moon but to the declination of the moon…”
http://docweather.com/4/show/211/
Eccentricity;
http://en.wikipedia.org/wiki/Orbital_eccentricity
controls the shape of the Earth’s orbit around the Sun. The orbit gradually changes from being elliptical to being nearly circular and then back to elliptical in a period of about 100,000 years. The greater the eccentricity of the orbit (i.e., the more elliptical it is), the greater the variation in solar energy received at the top of the atmosphere between the Earth’s closest (perihelion) and farthest (aphelion) approach to the Sun. Currently, the Earth is experiencing a period of low eccentricity. The difference in the Earth’s distance from the Sun between perihelion and aphelion (which is only about 3%) is responsible for approximately a 7% variation in the amount of solar energy received at the top of the atmosphere. When the difference in this distance is at its maximum (9%), the difference in solar energy received is about 20%.
http://www.physicalgeography.net/fundamentals/7y.html”>http://www.physicalgeography.net/fundamentals/7y.html
“The inertial motion of the Sun around the Barycentre, or centre of mass, of the Solar System”
http://en.wikipedia.org/wiki/Barycentric_coordinates_%28astronomy%29
http://www.orbitsimulator.com/gravity/articles/ssbarycenter.html
“has been employed as the base in searching for possible influence of the Solar System as a whole on climatic processes, especially on the changes in surface air temperature. A basic cycle of about 180–200 years and its higher harmonics up to 30 years have been found in surface air temperature of central Europe since 1753, established from 13 continuous instrumental time series. These periods correspond to the periods of solar inertial motion. In the first half of the 19th century, when the solar motion was chaotic, this temperature was about 0.75°C lower than that in the 20th (1940–50) and the 18th (1760–70) centuries. The mentioned decades of long-term temperature maxima coincide with the central decades of the ordered (trefoil) motion of the Sun. The temperatures in coastal Europe have been found to have slightly different properties, especially on a long-time scale. The periods of 35–45 years are significantly pronounced in the coastal Europe temperature spectrum. The chaotic motion of the Sun in the next decades could decrease both the solar forcing and global surface air temperature”
http://www.springerlink.com/content/xh920864613u2k57/
Over longer time frames changes to Earth’s orbit, tilt and wobble called Croll/Milankovitch cycles;
http://en.wikipedia.org/wiki/Milankovitch_cycles
may be responsible for the periods of Glaciation (Ice Ages);
http://www.homepage.montana.edu/~geol445/hyperglac/time1/milankov.htm
that Earth has experienced for the last several million years of its climatic record:
http://en.wikipedia.org/wiki/Ice_age
However, Don Easterbrook argues that there are major problems with the Croll/Milankovitch theory including that “(1) the theory cannot explain the synchroneity of glaciations in the Northern and Southern Hemisphere with no time lag (this fact has been called “the fly in the Milankovitch ointment”). Until this fact can be accounted for, the theory cannot be considered proven; (2) The validity of Milankovitch cycles depend on correlation with oxygen isotope variations in deep sea cores, but the cores cannot be dated accurately so the correlations rest on unproven assumptions and circular reasoning; (3) Milankovitch cycles cannot explain the Younger Dryas glacial resurgence because the onset and ending of the glaciation happened far more abruptly than can be credited to Milankovitch orbital changes (which are very slow). (4) The North Atlantic Deep Ocean Current theory cannot explain the problems with Milankovitch cycles because climatic changes occur simultaneous in both hemispheres with no lag time and this means it cannot be the cause of the climatic changes.”
Also of note, over very long time frames, “the Moon is spiraling away from Earth at an average rate of 3.8 cm per year”;
http://en.wikipedia.org/wiki/Lunar_distance_%28astronomy%29
http://curious.astro.cornell.edu/question.php?number=124
3. Gravitation:
http://en.wikipedia.org/wiki/Gravitation
The gravity of the Moon, Sun and Earth, Earth’s rotation, Earth’s orbit around the Sun, Earth’s tilt, Earth’s wobble and the Moon’s orbit around Earth act in concert to determine the constantly evolving Tidal Force on Earth:
http://en.wikipedia.org/wiki/Tidal_force
This tidal force results in Earth’s Ocean Tide;
http://en.wikipedia.org/wiki/Tide
http://www.themcdonalds.net/richard/astro/papers/602-tides-web.pdf
http://co-ops.nos.noaa.gov/restles4.html
Atmospheric Tide;
http://en.wikipedia.org/wiki/Atmospheric_tide
Earth Tide;
http://en.wikipedia.org/wiki/Earth_tide
Magma Tide:
http://www.springerlink.com/content/h7005r0273703250/
and “Tidal effects are also observed in the” “land masses of the Earth. Relative to the centre of the Earth, the land and buildings may bulge by as much as 9 inches, depending on the latitude. This constant pulling on the land areas as well as the friction caused between the ocean’s waters and the ocean floor, has led to a slowing down in the rotation of the Earth. This in turn has led to the lengthening of the day, by 0.002 seconds. This is why scientists in observatories who keep an accurate track of time, had to add a “˜leap second’ to keep in time with the changes in the period of the rotation of the Earth. This concept is similar to that of the leap year where a day is added, approximately every four years. This constant slowing down of the rotation of the Earth, will over a few billion years lead to a situation when the Moon and Earth are “locked ” together with the same side of the Earth and Moon facing each other.
Since the Earth’s mass is several times greater than that of the Moon, the gravitational forces exerted by the Earth on the Moon is also greater. Although no oceans are present on the Moon today, the tidal forces are felt on the land causing the rotation of the Moon to slow down from its original speed, in a manner similar to the effect the Moon has on the Earth. Since the gravitational force of the Earth on the Moon is greater, than that of the Moon on the Earth, the slowing down of the Moon’s rotation was more rapid, resulting in the present situation where the same side of the Moon always faces the Earth. Laser beams, along with reflectors placed on the Moon by astronauts, have helped in measuring accurately the distance between the Earth and the Moon. Repeated measurements have confirmed that the Moon is indeed moving away from the Earth at around 3.82 cm every year.
Since the distance between the Earth and Moon is slowly but surely increasing, the tidal forces on the Earth are constantly reducing by a corresponding degree.”
http://www.essortment.com/tides-moon-61741.html
Earth’s Gravity;
http://en.wikipedia.org/wiki/Convection#Gravitational_or_buoyant_convection
http://visibleearth.nasa.gov/view_rec.php?id=205
in concert with Tidal Forces, influence Earth’s Ocean Circulation;
http://www.eoearth.org/article/Ocean_circulation
which influences Oceanic Oscillations including El Niño/La Niña;
http://en.wikipedia.org/wiki/El_Ni%C3%B1o-Southern_Oscillation
the Pacific Decadal Oscillation (PDO);
http://en.wikipedia.org/wiki/Pacific_Decadal_Oscillation
the Atlantic Multi-Decadal Oscillation (AMO);
http://en.wikipedia.org/wiki/Atlantic_Multidecadal_Oscillation
the Indian_Ocean_Dipole (IOD)/Indian Ocean Oscillation (IOO) and;
http://en.wikipedia.org/wiki/Indian_Ocean_Dipole
can result in the formation of Polynyas:
http://en.wikipedia.org/wiki/Polynya
Gravity Waves;
http://en.wikipedia.org/wiki/Gravity_wave
which may be partially responsible for the Quasi-Biennial Oscillation (QBO);
http://en.wikipedia.org/wiki/Quasi-biennial_oscillation
“on an air–sea interface are called surface gravity waves or Surface Waves”;
http://en.wikipedia.org/wiki/Surface_wave
“while internal gravity waves are called Inertial Waves”:
http://en.wikipedia.org/wiki/Inertial_waves
“Rossby Waves;
http://en.wikipedia.org/wiki/Rossby_waves
Geostrophic Currents
http://en.wikipedia.org/wiki/Geostrophic
and Geostrophic Wind
http://en.wikipedia.org/wiki/Geostrophic_wind
are examples of inertial waves. Inertial waves are also likely to exist in the core of the Earth”
Earth’s gravity is the primary driver of Plate Tectonics;
http://en.wikipedia.org/wiki/Plate_tectonics
“The Slab Pull;
http://en.wikipedia.org/wiki/Slab_pull
force is a tectonic plate force due to subduction. Plate motion is partly driven by the weight of cold, dense plates sinking into the mantle at trenches. This force and the slab suction force account for most of the overall force acting on plate tectonics, and the Ridge Push;
http://en.wikipedia.org/wiki/Ridge_push
force accounts for 5 to 10% of the overall force.”
Isostasy also exists whereby a “state of gravitational equilibrium between the earth’s lithosphere and asthenosphere such that the tectonic plates “float” at an elevation which depends on their thickness and density.”
http://en.wikipedia.org/wiki/Isostasy
Plate Tectonics drive “cycles of ocean basin growth and destruction, known as Wilson cycles;
http://csmres.jmu.edu/geollab/fichter/Wilson/Wilson.html
involving continental rifting;
http://en.wikipedia.org/wiki/Rift
seafloor-spreading;
http://en.wikipedia.org/wiki/Seafloor_spreading
subduction;
http://en.wikipedia.org/wiki/Subduction
and collision.”:
http://en.wikipedia.org/wiki/Continental_collision
“Climate change on ultra-long time scales (tens of millions of years) are more than likely connected to plate tectonics.”
“Through the course of a Wilson cycle continents collide and split apart, mountains are uplifted and eroded, and ocean basins open and close. The re-distribution and changing size and elevation of continental land masses may have caused climate change on long time scales”;
http://www.pbs.org/wgbh/nova/ice/chill.html
a process called the Supercontinent Cycle:
http://en.wikipedia.org/wiki/Supercontinent_cycle
which, “has shaped the geology and climate of the earth and provided a force for biological evolution.”
http://www.as.wvu.edu/biology/bio463/Nance%20et%20al%201988%20Supercontinent%20Cycle.pdf
“There are two types of global earth climates: icehouse and greenhouse. Icehouse is characterized by frequent continental glaciations and severe desert environments. Greenhouse is characterized by warm climates. Both reflect the supercontinent cycle. We are now in a little greenhouse phase of an ice house world.
Icehouse Climate:
Continents moving together
Sea level low due to lack of seafloor production
Climate cooler, arid
Associated with aragonite seas
Formation of supercontinents
Greenhouse Climate:
Continents dispersed
Sea level high
High level of sea floor spreading
Relatively large amounts of CO2 production at oceanic rifting zones
Climate warm and humid
Associated with calcite seas
http://en.wikipedia.org/wiki/Supercontinent_cycle#Relation_to_climate
Earth’s gravity is responsible for Katabatic Wind:
http://en.wikipedia.org/wiki/Katabatic_wind
4. Solar Energy;
http://en.wikipedia.org/wiki/Solar_energy
results is Solar Radiation/Sunlight;
http://en.wikipedia.org/wiki/Solar_radiation
which varies based upon 11 and 22 year cycles:
http://en.wikipedia.org/wiki/Solar_cycle
Total Solar Irradiance (TSI);
http://www.ngdc.noaa.gov/stp/solar/solarirrad.html
appears to fluctuate “by approximately 0.1% or about 1.3 Watts per square meter (W/m2) peak-to-trough during the 11-year sunspot cycle”:
http://en.wikipedia.org/wiki/Solar_variation
Solar Energy also drives the Hydrological/Water Cycle;
http://en.wikipedia.org/wiki/Hydrological_cycle
within the Hydrosphere;
http://en.wikipedia.org/wiki/Hydrosphere
as Total Solar Irradiance (TSI) causes evaporation;
http://en.wikipedia.org/wiki/Evaporation
that drives Cloud formation;
http://en.wikipedia.org/wiki/Cloud
results in Precipitation;
http://en.wikipedia.org/wiki/Precipitation_%28meteorology%29
that results in the Water Distribution on Earth;
http://en.wikipedia.org/wiki/Water_distribution_on_Earth
creates surface Runoff;
http://en.wikipedia.org/wiki/Runoff_%28water%29
which result in Rivers;
http://en.wikipedia.org/wiki/River
and drives Erosion:
http://en.wikipedia.org/wiki/Erosion
Solar energy is also “The driving force behind atmospheric circulation is solar energy, which heats the atmosphere with different intensities at the equator, the middle latitudes, and the poles.”
http://www.scienceclarified.com/As-Bi/Atmospheric-Circulation.html
Atmospheric Circulation;
http://en.wikipedia.org/wiki/Atmospheric_circulation
includes Hadley Cells;
http://en.wikipedia.org/wiki/Hadley_cell
Ferrel Cells;
http://en.wikipedia.org/wiki/Atmospheric_circulation#Ferrel_cell
Polar Cells;
http://en.wikipedia.org/wiki/Polar_cells
all of which help to create Wind;
http://en.wikipedia.org/wiki/Wind
that influence Surface Currents;
http://www.windows2universe.org/earth/Water/ocean_currents.html
http://en.wikipedia.org/wiki/Ocean_current
through Ekman Transport;
http://en.wikipedia.org/wiki/Ekman_transport
http://oceanmotion.org/html/background/ocean-in-motion.htm
and also cause Langmuir circulations
http://en.wikipedia.org/wiki/Langmuir_circulation
Solar energy influences Atmospheric Waves;
http://en.wikipedia.org/wiki/Atmospheric_wave
including Atmospheric Tides;
http://en.wikipedia.org/wiki/Atmospheric_tide
evaporation and condensation that may help to drive changes in Atmospheric Pressure:
http://en.wikipedia.org/wiki/Atmospheric_pressure
http://www.atmos-chem-phys-discuss.net/10/24015/2010/acpd-10-24015-2010.pdf
and Atmospheric Escape;
http://en.wikipedia.org/wiki/Atmospheric_escape
which “is the loss of planetary atmospheric gases to outer space”. “Although Earth’s atmosphere may seem as permanent as the rocks, it gradually leaks back into space. The loss rate is currently tiny, only about three kilograms of hydrogen and 50 grams of helium (the two lightest gases) per second, but even that trickle can be significant over geologic time, and the rate was probably once much higher.”
http://www.scientificamerican.com/article.cfm?id=how-planets-lose-their-atmospheres
“‘On Earth the magnetosphere acts like an energy collector that interacts with the material that’s coming from the sun and can draw energy out of the solar wind,’ Russell said. But then Earth’s magnetic field funnels and guides that energy to the upper atmosphere, heating the atmosphere and allowing bits of it to escape along the very same funnels that guided the energy in. ‘The precise physics have yet to be worked out, but there’s no cause for alarm’, Russell said. ‘At the current rate, our present atmospheric inventory can last at least until the sun—midway through its life now—turns into a red giant and engulfs Earth’, Russell said. ‘At that point,’ he said, ‘the loss of atmosphere becomes moot.'”
http://news.nationalgeographic.com/news/2009/05/090529-sun-stealing-atmosphere.html
Solar energy drives the Brewer Dobson Circulation;
http://en.wikipedia.org/wiki/Brewer-Dobson_circulation
which influences Polar Vortices:
http://en.wikipedia.org/wiki/Polar_vortex
http://wattsupwiththat.com/reference-pages/polar-vortex/
Solar variability may also influence the Polar Night Jets:
http://en.wikipedia.org/wiki/Jet_stream#Polar_night_jet
“Early modelling work by Rind and Balachandran (1995) and Balachandran and Rind (1995), and more recently discussed by Rind et al. (2002), was able to simulate these zonal wind anomalies. They suggested that solar variability influences the structure of the polar night jet and hence the propagation of planetary-scale waves that travel vertically from the troposphere. This then affects their ability to impact the polar vortex and to produce sudden stratospheric warmings. Specifically, Rind and co-workers noted that the 11-year SC temperature anomaly in the equatorial upper stratosphere gives rise to an anomalous horizontal temperature gradient and hence to a corresponding anomaly in the vertical wind shear in the region of the polar night jet at upper levels. As a result of the consequent anomalous planetary wave propagation, this zonal wind anomaly gradually descends with time into the lower stratosphere (see also Dunkerton 2000). In addition, they noted that the QBO influences the latitudinal wind shear in the lower stratosphere (Holton and Tan 1982). Both these factors affect the structure of the polar night jet and thus there is an interaction of the solar and QBO influences through their combined influence on wave propagation. However, the details of how the solar and QBO interaction occurred were not clear, especially the precise mechanism by which the 11-year SC influence in the upper stratosphere impacts the QBO influence in the lower stratosphere.
http://www.space.dtu.dk/upload/institutter/space/forskning/06_projekter/isac/wp501b.pdf
Solar Ultraviolet (UV) radiation;
http://en.wikipedia.org/wiki/Ultraviolet
appears to vary by approximately 10% during the solar cycle;
http://www.nasa.gov/topics/solarsystem/features/solarcycle-sorce.html
has been hypothesized to influence Earth’s climate;
http://wattsupwiththat.com/2011/04/05/courtillot-on-the-solar-uv-climate-connection/
however Leif Svalgaard argues that,
This is well-trodden ground. Nothing new to add, just the same old, tired arguments. Perhaps a note on EUV: as you can see here (slide 13)
http://lasp.colorado.edu/sorce/news/2008ScienceMeeting/doc/Session1/S1_03_Kopp.pdf the energy in the EUV band [and other UV bands] is very tiny; many orders of magnitude less than what shines down on our heads each day. So a larger solar cycle variation of EUV does not make any significant difference in the energy budget.
http://wattsupwiththat.com/2011/04/05/courtillot-on-the-solar-uv-climate-connection/#comment-636477
Additionally “the thermosphere intercepts extreme ultraviolet (EUV) photons from the sun before they can reach the ground. When solar activity is high, solar EUV warms the thermosphere, causing it to puff up like a marshmallow held over a camp fire. (This heating can raise temperatures as high as 1400 K—hence the name thermosphere.) When solar activity is low, the opposite happens.” “The thermosphere ranges in altitude from 90 km to 600+ km. It is a realm of meteors, auroras and satellites, which skim through the thermosphere as they circle Earth. It is also where solar radiation makes first contact with our planet.”
Interestingly, in 2008-2009 “A Puzzling Collapse of Earth’s Upper Atmosphere” occurred when “high above Earth’s surface where the atmosphere meets space, a rarefied layer of gas called “the thermosphere” recently collapsed and now is rebounding again.” “This is the biggest contraction of the thermosphere in at least 43 years,” says John Emmert of the Naval Research Lab, lead author of a paper announcing the finding in the June 19th issue of the Geophysical Research Letters (GRL). “It’s a Space Age record.” “The collapse happened during the deep solar minimum of 2008-2009—a fact which comes as little surprise to researchers. The thermosphere always cools and contracts when solar activity is low. In this case, however, the magnitude of the collapse was two to three times greater than low solar activity could explain.”
“‘“Something is going on that we do not understand,’” says Emmert.”
http://science.nasa.gov/science-news/science-at-nasa/2010/15jul_thermosphere/
“One component from which UV light creates methane in a photochemical process is pectin – a polysaccharide that many plants use as a structural material. It contains methoxyl groups in which there are already the rudiments of the methane chemical structure.” “Frank Keppler and his colleagues at the Max Planck Institute for Nuclear Physics in Heidelberg had observed, for the first time, that plants release methane – into the air: meaning under aerobic conditions, under which bacteria produce no methane, allowing it, for example, to bubble up out of bogs and marshes. This study indicated that plants contribute a substantial proportion of the methane in the atmosphere.”
http://www.mpg.de/568294/pressRelease200805272?filter_order=TL&research_topic=UK-PF
Infrared Radiation;
http://en.wikipedia.org/wiki/Infrared
Solar – Wind;
http://science.nasa.gov/science-news/science-at-nasa/1999/ast13dec99_1/
Solar – Coronal Holes;
http://helios.gsfc.nasa.gov/chole.html
Solar – Solar Energetic Particles (SEP);
http://helios.gsfc.nasa.gov/sep.html
Solar – Coronal Mass Ejection;
http://www.esa.int/esaSC/SEMF75BNJTF_index_0.html
http://www.ratedesi.com/video/v/8AuCE_NNEaM/Sun-Erupts-to-Life-Unleashes-a-Huge-CME-on-13-April-2010
Solar Magnetosphere Breach;
Solar Polar Field Reversal;
http://science.nasa.gov/science-news/science-at-nasa/2001/ast15feb_1/
Solar Sector Boundary;
http://science.nasa.gov/heliophysics/focus-areas/magnetosphere-ionosphere/
Grand Minimum;
Leif Svalgaard says: February 6, 2011 at 8:26 pm
If L&P are correct and sunspots become effectively] invisible [not gone] it might mean another Grand Minimum lasting perhaps 50 years. During this time the solar cycle is still operating, cosmic rays are still modulated, and the solar wind is still buffeting the Earth.”
“It will lead to a cooling of a couple of tenths of a degree.”
“The Earth is dressed in layers that protect it from the sun’s fierce winds.” “The warm plasma cloak begins thinly on the nightside—or darkside—of the planet and wraps around to the dayside, where it becomes thickest until noon. In the afternoon, convective winds push the cloak out toward the edge of the magnetosphere, where it’s peeled off by solar winds.”
http://news.nationalgeographic.com/news/2009/01/090107-warm-plasma-cloak.html
“Earth generates Cold Plasma—slow-moving charged particles—at the edge of space, where sunlight strips electrons from gas atoms, leaving only their positively charged cores, or nuclei.” “This influence is ‘not a minor thing in space weather,’ André said. ‘It’s an elephant in the room.'”
Solar Influences on Climate:
http://www.space.dtu.dk/upload/institutter/space/forskning/06_projekter/isac/wp501b.pdf
http://www.leif.org/EOS/2009RG000282.pdf
Statistical issues about solar–climate relations
http://www.leif.org/EOS/Yiou-565-2010.pdf
5. Geothermal Energy;
http://en.wikipedia.org/wiki/Geothermal_energy
“is thermal energy generated and stored in the Earth. Thermal energy is the energy that determines the temperature of matter. Earth’s geothermal energy originates from the original formation of the planet (20%) and from radioactive decay of minerals (80%).”Heat may be generated by tidal force on the Earth as it rotates; since rock cannot flow as readily as water it compresses and distorts, generating heat.”
“The Earth’s internal thermal energy flows to the surface by conduction at a rate of 44.2 terawatts (TW), and is replenished by radioactive decay of minerals at a rate of 30 TW.” “Mean heat flow is 65 mW/m2 over continental crust and 101 mW/m2 over oceanic crust. This is approximately 1/10 watt/square meter on average, (about 1/10,000 of solar irradiation,) but is much more concentrated in areas where thermal energy is transported toward the crust by convection such as along mid-ocean ridges and mantle plumes. The Earth’s crust effectively acts as a thick insulating blanket which must be pierced by fluid conduits (of magma, water or other) in order to release the heat underneath. More of the heat in the Earth is lost through plate tectonics, by mantle upwelling associated with mid-ocean ridges. The final major mode of heat loss is by conduction through the lithosphere, the majority of which occurs in the oceans due to the crust there being much thinner and younger than under the continents”
http://en.wikipedia.org/wiki/Geothermal_gradient
“Earth’s heat is released” “by two main processes, conduction and convection:
1. Conduction is the movement of heat from hotter material to colder material. A common example of conduction is when heat from a stove is transferred through the bottom of a coffee pot to the liquid inside. Conduction” “helps transfer heat from deep within Earth to shallower depths. Of the heat released from the ground at Yellowstone, about 25% is by conduction.”
2. Convection is heat transported by hot material in motion, such as hot water or magma. Convection happens inside a coffee pot when heat is carried to the top of the liquid in the pot by hot water that rises buoyantly from the heated bottom because it is less dense than overlying cooler water. As the water boils, the rise of the hotter water and the compensating fall of cooler water from the top forms what is called a convection cell. Convection of molten rock helps carry heat up through the Yellowstone caldera. Near the surface, convection of hot ground water drives geysers, hot springs, and fumaroles. Convection accounts for roughly 75% of the heat released from the ground at Yellowstone.”
http://volcanoes.usgs.gov/yvo/about/faq/faqgeothermal.php
Geothermal Energy influences Earth’s climate especially when released by Volcanoes;
http://en.wikipedia.org/wiki/Volcano
“which are generally found where tectonic plates are diverging;
http://en.wikipedia.org/wiki/Divergent_boundary
or converging”;
http://en.wikipedia.org/wiki/Convergent_boundary
however, “intraplate volcanism has also been postulated to be caused by mantle plumes”:
http://en.wikipedia.org/wiki/Mantle_plume
“These so-called “hotspots”;
http://en.wikipedia.org/wiki/Hotspot_%28geology%29
for example Hawaii, are postulated to arise from upwelling diapirs;
http://en.wikipedia.org/wiki/Diapir
from the core-mantle boundary, 3,000 km deep in the Earth.”
Volcanoes have been shown to influence Earth’s climate;
http://www.geology.sdsu.edu/how_volcanoes_work/climate_effects.html
http://www.longrangeweather.com/global_temperatures.htm
including in the infamous Year Without a Summer;
http://en.wikipedia.org/wiki/Year_Without_a_Summer
which was partially caused by the 1815 eruption of Mount Tambora;
http://en.wikipedia.org/wiki/1815_eruption_of_Mount_Tambora
and is called a Volcanic Winter:
http://en.wikipedia.org/wiki/Volcanic_winter
“Volcanic Ash;
http://en.wikipedia.org/wiki/Volcanic_ash
particles have a maximum residence time in the troposphere of a few weeks.
The finest Tephera;
http://en.wikipedia.org/wiki/Tephra
remain in the stratosphere for only a few months, they have only minor climatic effects, and they can be spread around the world by high-altitude winds. This suspended material contributes to spectacular sunsets.
“The greatest volcanic impact upon the earth’s short term weather patterns is caused by sulfur dioxide gas;”
http://en.wikipedia.org/wiki/Sulfur_dioxide
“In the cold lower atmosphere, it is converted to Sulfuric Acid;
http://en.wikipedia.org/wiki/Sulfuric_acid
sulfuric acid by the sun’s rays reacting with stratospheric water vapor to form sulfuric acid aerosol layers. The aerosol remains in suspension long after solid ash particles have fallen to earth and forms a layer of sulfuric acid droplets between 15 to 25 kilometers up. Fine ash particles from an eruption column fall out too quickly to significantly cool the atmosphere over an extended period of time, no matter how large the eruption.
Sulfur aerosols last many years, and several historic eruptions show a good correlation of sulfur dioxide layers in the atmosphere with a decrease in average temperature decrease of subsequent years. The close correlation was first established after the 1963 eruption of Agung volcano in Indonesia when it was found that sulfur dioxide reached the stratosphere and stayed as a sulfuric acid aerosol.
Without replenishment, the sulfuric acid aerosol layer around the earth is gradually depleted, but it is renewed by each eruption rich in sulfur dioxide. This was confirmed by data collected after the eruptions of El Chichon, Mexico (1982) and Pinatubo, Philippines (1991), both of which were high-sulfur compound carriers like Agung, Indonesia.”
http://volcanology.geol.ucsb.edu/gas.htm
There is also some evidence that if “volcanic activity was high enough, then a water vapor anomaly would be introduced into the lower stratosphere before the anomaly due to the previous eruption had disappeared. The result would be threefold in the long term: stratospheric cooling, stratospheric humidification, and surface warming due to the positive radiative forcing associated with the water vapor.”
http://journals.ametsoc.org/doi/pdf/10.1175/1520-0442(2003)016%3C3525%3AAGSOVE%3E2.0.CO%3B2#h1
Geothermal Energy can warm the atmosphere through Hot Springs;
http://en.wikipedia.org/wiki/Hot_springs
or when leveraged for Geothermal Heating;
http://en.wikipedia.org/wiki/Geothermal_heating
“Worldwide, about 10,715 megawatts (MW) of geothermal power is online in 24 countries. An additional 28 gigawatts of direct geothermal heating capacity is installed for district heating, space heating, spas, industrial processes, desalination and agricultural applications.”
Geothermal Energy can also warm the ocean through Hydrothermal Vents;
http://en.wikipedia.org/wiki/Hydrothermal_vent
which can be a factor in Hydrothermal Circulations:
http://en.wikipedia.org/wiki/Hydrothermal_circulation
6. Outer Space/Cosmic/Galactic Effects;
http://en.wikipedia.org/wiki/Outer_space
http://en.wikipedia.org/wiki/Cosmos
http://en.wikipedia.org/wiki/Galaxy
including Asteroids;
http://en.wikipedia.org/wiki/Asteroid
Meteorites;
http://en.wikipedia.org/wiki/Meteorite
and Comets;
http://en.wikipedia.org/wiki/Comet
can all significantly impact Earth’s climate upon impact if they are large enough.
It has also been hypothesized that small comets impact Earth “at a rate of one 20-to-40 ton comet every three seconds, this influx of small comets into the atmosphere would add about one inch of water to the Earth’s surface every 20,000 years or so. The implications of this added water for long range global climate, global warming, and pollution mitigation will need to be examined by the experts in those fields.” “The influx of small comets into Earth’s atmosphere may help explain the source of water needed to form noctilucent clouds.” The hypothesis that small comets “are depositing water in our atmosphere” “comes from trying to account for the presence in the images of the “atmospheric holes,” those dark spots where the ultraviolet dayglow has been absorbed over areas of 50 to 100 km in diameter. This is a large area and requires a lot of material. For the wavelength range viewed by the Polar and Dynamics Explorer cameras, water is the only common gaseous substance in the solar system that can efficiently absorb the dayglow along the line-of-sight of the cameras.
http://smallcomets.physics.uiowa.edu/www/faq.htmlx
“Debate over the source of the Earth’s water has been raging for decades” with some scientists arguing that “comets were responsible for Earth’s oceans;”
http://www.cosmosmagazine.com/news/4813/comets-were-responsible-earths-oceans
and others arguing that “ice asteroids likely source of Earth’s water”:
http://www.cosmosmagazine.com/news/3427/ice-asteroids-likely-source-earths-water
It has been hypothesized that Galactic Cosmic Rays;
http://en.wikipedia.org/wiki/Galactic_cosmic_ray
http://en.wikipedia.org/wiki/Cosmic_ray
modulated by Solar Wind, may influence cloud formation on Earth:
Also, “the density of cosmic ray sources in the galaxy is not uniform. In fact, it is concentrated in the galactic spiral arms (it arises from supernovae, which in our galaxy are predominantly the end product of massive stars, which in turn form and die primarily in spiral arms). Thus, each time we cross a galactic arm, we should expect a colder climate. Current data for the spiral arm passages gives a crossing once every 135 ± 25 Million years. (See fig. 2 on the left. Note also that the spiral arms are density waves which propagate at a different speed than the stars, that is, nothing moves at their rotation speed).”
http://www.sciencebits.com/ice-ages
http://www.phys.huji.ac.il/~shaviv/articles/PRLice.pdf
http://www.phys.huji.ac.il/~shaviv/articles/long-ice.pdf
Galactic Magnetic Fields;
http://www.scholarpedia.org/article/Galactic_magnetic_fields
result in the Galactic Tide;
http://en.wikipedia.org/wiki/Galactic_tide
which may influence the hypothesized Oort cloud;
http://en.wikipedia.org/wiki/Oort_Cloud
“Besides the galactic tide, the main trigger for sending comets into the inner Solar System is believed to be interaction between the Sun’s Oort cloud and the gravitational fields of near-by stars or giant molecular clouds.”
Also Cosmic Dust;
http://en.wikipedia.org/wiki/Cosmic_dust
“is a type of dust composed of particles in space which are a few molecules to 0.1 µm in size. Cosmic dust can be further distinguished by its astronomical location; for example: intergalactic dust, interstellar dust, interplanetary dust (such as in the zodiacal cloud) and circumplanetary dust (such as in a planetary ring).”
“Depending on their size and overall number, cosmic dust and other particles in the atmosphere have the potential to change Earth’s climate. They can reflect sunlight, which cools the Earth, absorb sunlight, which warms the atmosphere, and act as a blanket for the planet by trapping any heat it gives off. They can also facilitate the formation of rain clouds.”
http://www.space.com/1484-source-cosmic-dust.html
Cosmic dust contains various minerals which could control the production of algae and bacteria in remote ocean surface waters. A high production during periods of peaking cosmic influx increases cloud formation catalyzed by dimethyl sulphide (DMS) production, following increased atmospheric albedo, decreased shortwave solar irradiation to Earth surface and subsequent cooling. The opposite situation would occur when cosmic dust influx is low.
In addition, “a study of astronomical and geological data reveals that cosmic ray electrons and electromagnetic radiation from a similar outburst of our own Galactic core, impacted our Solar System near the end of the last ice age. This cosmic ray event spanned a period of several thousand years and climaxed around 14,200 years ago. Although far less intense than the PG 0052+251 quasar outburst, it was, nevertheless, able to substantially affect the Earth’s climate and trigger a solar-terrestrial conflagration the initiated the worst animal extinction episode of the Tertiary period.
The effects on the Sun and on the Earth’s climate were not due to the Galactic cosmic rays themselves, but to the cosmic dust that these cosmic rays transported into the Solar System. Observations have shown that the Solar System is presently immersed in a dense cloud of cosmic dust, material that is normally kept at bay by the outward pressure of the solar wind. But, with the arrival of this Galactic cosmic ray volley, the solar wind was overpowered and large quantities of this material were pushed inward. The Sun was enveloped in a cocoon of dust that caused its spectrum to shift toward the infrared. In addition, the dust grains filling the Solar System scattered radiation back to the Earth, producing an “interplanetary hothouse effect” that substantially increased the influx of solar radiation to the Earth.”
http://www.etheric.com/GalacticCenter/Galactic.html
Finally Lars G. Franzén and Roger A. Cropp argue in Geografiska Annaler 2007, that “cosmic dust contains various minerals which could control the production of algae and bacteria in remote ocean surface waters. A high production during periods of peaking cosmic influx increases cloud formation catalyzed by dimethyl sulphide (DMS) production, following increased atmospheric albedo, decreased shortwave solar irradiation to Earth surface and subsequent cooling. The opposite situation would occur when cosmic dust influx is low.”
http://www.science.gu.se/english/News/News_detail/?contentId=760313
Also, “during a solar eclipse the Moon’s passage overhead blocks out the majority of the Sun’s light, casting a wide swath of the Earth into darkness. The land under the Moon’s shadow receives less incoming energy than the surrounding regions, causing it to cool. In the early 1970s, researches proposed that this temperature difference could set off slow-moving waves in the upper atmosphere. They hypothesized that the waves, moving more slowly than the travelling temperature disparity from which they spawned, would pile up along the leading edge of the Moon’s path—like slow-moving waves breaking on a ship’s bow.”
http://www.agu.org/cgi-bin/highlights/highlights.cgi?action=show&doi=10.1029/2011GL048805&jc=gl
7. Earth’s Magnetic Field;
http://en.wikipedia.org/wiki/Earth%27s_magnetic_field
is primarily responsible for the Earthy behaviors of the Magnetosphere;
http://en.wikipedia.org/wiki/Magnetosphere
with certain secular variations in Earth’s magnetic field originating from ocean flow/circulation;
http://news.nationalgeographic.com/news/2009/06/090622-earths-core-dynamo.html
http://iopscience.iop.org/1367-2630/11/6/063015/fulltext
though Leif Svalgaard notes that these are minor variations, as the magnetic field originating from ocean flow/circulation “is 1000 times smaller than the main field generated in the core.”
http://en.wikipedia.org/wiki/Earth%27s_magnetic_field
Earth Core Changes:
http://physicsworld.com/cws/article/news/42580
appear “to be generated in the Earth’s core by a dynamo process, associated with the circulation of liquid metal in the core, driven by internal heat sources”. “Molten iron flowing in the outer core generates the Earth’s geodynamo, leading to a planetary-scale magnetic field. Beyond this, though, geophysicists know very little for certain about the field, such as its strength in the core or why its orientation fluctuates regularly. Researchers do suspect, however, that field variations are strongly linked with changing conditions within the molten core.” These core changes
influence the Magnetosphere;
http://en.wikipedia.org/wiki/Magnetosphere
including movement of the Geomagnetic Poles:
http://www.ngdc.noaa.gov/geomag/GeomagneticPoles.shtml
http://news.nationalgeographic.com/news/2009/12/091224-north-pole-magnetic-russia-earth-core.html
According to a 2009 Danish study “Is there a link between Earth’s magnetic field and low-latitude precipitation?” by Knudsen and Riisager, Geology, 2009. “The earth’s climate has been significantly affected by the planet’s magnetic field”
“Our results show a strong correlation between the strength of the earth’s magnetic field and the amount of precipitation in the tropics,” one of the two Danish geophysicists behind the study, Mads Faurschou Knudsen of the geology department at Aarhus University in western Denmark, told the Videnskab journal.”
http://www.spacedaily.com/2006/090112183735.ojdq7esu.html
“Intriguingly, we observe a relatively good correlation between the high-resolution speleothem δ18O records and the dipole moment, suggesting that Earth’s magnetic field to some degree influenced low-latitude precipitation in the past. In addition to supporting the notion that variations in the geomagnetic field may have influenced Earth’s climate in the past, our study also provides some degree of support for the controversial link between GCR particles, cloud formation, and climate.”
http://geology.geoscienceworld.org/content/37/1/71.abstract
“Oxygen is constantly leaking out of Earth’s atmosphere and into space. Now, ESA’s formation-flying quartet of satellites, Cluster, has discovered the physical mechanism that is driving the escape. It turns out that the Earth’s own magnetic field is accelerating the oxygen away.
http://www.esa.int/esaCP/SEMQ8LKRQJF_index_0.html
8. Atmospheric Composition
http://en.wikipedia.org/wiki/Atmosphere_of_Earth
Nitrogen (N2) represents approximately 780,840 ppmv or 78.084% of Earth’s Atmosphere;
http://en.wikipedia.org/wiki/Nitrogen
Oxygen (O2) represents approximately 209,460 ppmv or 20.946%;
http://en.wikipedia.org/wiki/Oxygen
Argon (Ar) represents approximately 9,340 ppmv or 0.9340%;
http://en.wikipedia.org/wiki/Argon
Carbon Dioxide (CO2) represents approximately 390 ppmv or 0.039%;
http://en.wikipedia.org/wiki/Carbon_dioxide
contributes to the Greenhouse Effect;
http://www.ucar.edu/learn/1_3_1.htm
and influences the rate of Plant Growth;
http://www.sjsu.edu/faculty/watkins/CO2plants.htm
“Of all the carbon dioxide (CO2) emitted into the atmosphere, one quarter is taken up by land plants, another quarter by the oceans. Understanding these natural mechanisms is important in forecasting the rise of atmospheric CO2 because even though plants and bodies of water now absorb surplus greenhouse gas, they could become new trouble spots. The ocean absorbs CO2 from the atmosphere in an attempt to reach equilibrium by direct air-to-sea exchange. This process takes place at an extremely low rate, measured in hundreds to thousands of years. However, once dissolved in the ocean, a carbon atom will stay there, on average, more than 500 years, estimates Michael McElroy, Butler professor of environmental science.
Besides the slow pace of ocean turnover, two more factors determine the rate at which the seas take up carbon dioxide. One is the availability of carbonate, which comes from huge deposits of calcite (shells) in the upper levels of the ocean. These shells must dissolve in ocean water in order to be available to aid in the uptake of CO2, but the rate at which they dissolve is controlled by the ocean’s acidity. The ocean’s acidity does rise with increased CO2, but the slow pace of ocean circulation prevents this process from developing useful momentum.”
http://harvardmagazine.com/2002/11/the-ocean-carbon-cycle.html
Roy Spenser argues that “during a warm El Nino year, more CO2 is released by the ocean into the atmosphere (and less is taken up by the ocean from the atmosphere), while during cool La Nina years just the opposite happens. (A graph similar to the first graph also appeared in the IPCC report, so this is not new). Just how much of the Mauna Loa Variations in the first graph are due to the “Coke-fizz” effect is not clear because there is now strong evidence that biological activity also plays a major (possibly dominant) role (Behrenfeld et al., 2006). Cooler SST conditions during La Nina are associated with more upwelling of nutrient-rich waters, which stimulates plankton growth.”
http://www.drroyspencer.com/2009/05/global-warming-causing-carbon-dioxide-increases-a-simple-model/
However, Steve Fitzpatrick argues that the CO2 released by human activities, combined with slow ocean absorption/neutralization and sea surface temperature variation, is broadly consistent with the measured historical trend in atmospheric CO2, including the effect of changing average SST on short term variation in the rate of CO2 increase. Temperature changes in ocean surface waters cause shifts of a few PPM up and down in the rate of increase, but surface temperature changes do not explain 80% to 90% of the increase in atmospheric CO2 since 1958, as suggested in Dr. Spencer’s May 11 post. Because of its relatively high pH, high buffering capacity, enormous mass, and slow circulation, the ocean is, and will be for a very long time, a significant net sink for atmospheric CO2.
http://wattsupwiththat.com/2009/05/22/a-look-at-human-co2-emissions-vs-ocean-absorption/
Neon (Ne) represents approximately18.18 ppmv or 0.001818%;
http://en.wikipedia.org/wiki/Neon
Helium (He) represents approximately 5.24 ppmv (0.000524%);
http://en.wikipedia.org/wiki/Helium
“In the Earth’s atmosphere, the concentration of Helium by volume is only 5.2 parts per million.[66][67] The concentration is low and fairly constant despite the continuous production of new helium because most helium in the Earth’s atmosphere escapes into space by several processes.[68][69][70] In the Earth’s heterosphere, a part of the upper atmosphere, helium and other lighter gases are the most abundant elements.”
http://en.wikipedia.org/wiki/Helium
Krypton (Kr) represents approximately 1.14 ppmv (0.000114%);
http://en.wikipedia.org/wiki/Krypton
Methane (CH4) represents approximately 1.79 ppmv (0.000179%);
http://en.wikipedia.org/wiki/Methane
contributes to the Greenhouse Effect;
http://www.ucar.edu/learn/1_3_1.htm
“Natural sources of CH4 include fires, geologic processes, and bacteria that produce CH4 in a variety of settings (most notably, wetlands). N2O is also produced by bacteria. Major anthropogenic sources of these gases include fossil fuel combustion and agriculture. Some sources can be related to both natural and anthropogenic processes. For example, forest and grassland fires, which produce CH4, can be either human-initiated (e.g., for land clearing) or the result of lightning ignition or other natural causes.”
http://www.epa.gov/outreach/pdfs/Methane-and-Nitrous-Oxide-Emissions-From-Natural-Sources.pdf
“One component from which UV light creates methane in a photochemical process is pectin – a polysaccharide that many plants use as a structural material. It contains methoxyl groups in which there are already the rudiments of the methane chemical structure.” “Frank Keppler and his colleagues at the Max Planck Institute for Nuclear Physics in Heidelberg had observed, for the first time, that plants release methane – into the air: meaning under aerobic conditions, under which bacteria produce no methane, allowing it, for example, to bubble up out of bogs and marshes. This study indicated that plants contribute a substantial proportion of the methane in the atmosphere.”
http://www.mpg.de/568294/pressRelease200805272?filter_order=TL&research_topic=UK-PF
Hydrogen (H2) represents approximately 0.55 ppmv (0.000055%);
http://en.wikipedia.org/wiki/Hydrogen
Nitrous Oxide (N2O) represents approximately 0.3 ppmv (0.00003%);
http://en.wikipedia.org/wiki/Nitrous_oxide
contributes to the Greenhouse Effect;
http://www.ucar.edu/learn/1_3_1.htm
Ozone (O3) represents approximately 0.0 to 0.07 ppmv (0 to 7×10⁻⁶%);
http://en.wikipedia.org/wiki/Ozone
Nitrogen Dioxide (NO2) represents approximately 0.02 ppmv (2×10⁻⁶%) (0.000002%);
http://en.wikipedia.org/wiki/Nitrogen_dioxide
Iodine (I2) represents approximately 0.01 ppmv (1×10⁻⁶%) (0.000001%) and;
http://en.wikipedia.org/wiki/Iodine
Ammonia (NH3) represents a trace amount of Earth’s Atmosphere:
http://en.wikipedia.org/wiki/Ammonia
Additional atmosphere components includes Water vapor (H2O) that represents approximately 0.40% over full atmosphere, typically 1%-4% at surface.
http://en.wikipedia.org/wiki/Water_vapor;
“Water Vapor accounts for the largest percentage of the greenhouse effect, between 36% and 66% for clear sky conditions and between 66% and 85% when including clouds.”
http://en.wikipedia.org/wiki/Greenhouse_gas#Role_of_water_vapor
Aerosols;
http://en.wikipedia.org/wiki/Aerosol
that “act as cloud condensation nuclei, they alter albedo (both directly and indirectly via clouds) and hence Earth’s radiation budget, and they serve as catalysts of or sites for atmospheric chemistry reactions.”
“Aerosols play a critical role in the formation of clouds;
http://en.wikipedia.org/wiki/Clouds
Clouds form as parcels of air cool and the water vapor in them condenses, forming small liquid droplets of water. However, under normal circumstances, these droplets form only where there is some “disturbance” in the otherwise “pure” air. In general, aerosol particles provide this “disturbance”. The particles around which cloud droplets coalesce are called cloud condensation nuclei (CCN) or sometimes “cloud seeds”. Amazingly, in the absence of CCN, air containing water vapor needs to be “supersaturated” to a humidity of about 400% before droplets spontaneously form! So, in almost all circumstances, aerosols play a vital role in the formation of clouds.”
http://www.windows2universe.org/earth/Atmosphere/aerosol_cloud_nucleation_dimming.html
Particulates;
http://en.wikipedia.org/wiki/Particulates
including Soot/Black Carbon;
http://en.wikipedia.org/wiki/Soot
http://en.wikipedia.org/wiki/Black_carbon
Sand;
http://en.wikipedia.org/wiki/Sand
Dust;
http://en.wikipedia.org/wiki/Dust
“Volcanic Ash;
http://en.wikipedia.org/wiki/Volcanic_ash
particles have a maximum residence time in the troposphere of a few weeks.
The finest Tephera;
http://en.wikipedia.org/wiki/Tephra
remain in the stratosphere for only a few months, they have only minor climatic effects, and they can be spread around the world by high-altitude winds. This suspended material contributes to spectacular sunsets.
The major climate influence from volcanic eruptions is caused by gaseous sulfur compounds, chiefly Sulfur Dioxide;
http://en.wikipedia.org/wiki/Sulfur_dioxide
which reacts with OH and water in the stratosphere to create sulfate aerosols with a residence time of about 2–3 years.”
“Emission rates of [Sulfur Dioxide] SO2 from an active volcano range from 10 million tonnes/day according to the style of volcanic activity and type and volume of magma involved. For example, the large explosive eruption of Mount Pinatubo on 15 June 1991 expelled 3-5 km3 of dacite magma and injected about 20 million metric tons of SO2 into the stratosphere. The sulfur aerosols resulted in a 0.5-0.6°C cooling of the Earth’s surface in the Northern Hemisphere.”
http://volcanoes.usgs.gov/hazards/gas/index.php
“The 1815 eruption [of Mount Tambora] is rated 7 on the Volcanic Explosivity Index, the only such eruption since the Lake Taupo eruption in about 180 AD. With an estimated ejecta volume of 160 cubic kilometers, Tambora’s 1815 outburst was the largest volcanic eruption in recorded history.”
“The eruption created global climate anomalies that included the phenomenon known as “volcanic winter”;
http://en.wikipedia.org/wiki/Volcanic_winter
1816 became known as the “Year Without a Summer”;
http://en.wikipedia.org/wiki/Year_Without_a_Summer
because of the effect on North American and European weather. Agricultural crops failed and livestock died in much of the Northern Hemisphere, resulting in the worst famine of the 19th century.”
http://en.wikipedia.org/wiki/Mount_Tambora
“In the spring and summer of 1816, a persistent “dry fog” was observed in the northeastern US. The fog reddened and dimmed the sunlight, such that sunspots were visible to the naked eye. Neither wind nor rainfall dispersed the “fog”. It has been characterized as a stratospheric sulfate aerosol veil.”
“The greatest volcanic impact upon the earth’s short term weather patterns is caused by sulfur dioxide gas;”
http://en.wikipedia.org/wiki/Sulfur_dioxide
“In the cold lower atmosphere, it is converted to Sulfuric Acid;
http://en.wikipedia.org/wiki/Sulfuric_acid
sulfuric acid by the sun’s rays reacting with stratospheric water vapor to form sulfuric acid aerosol layers. The aerosol remains in suspension long after solid ash particles have fallen to earth and forms a layer of sulfuric acid droplets between 15 to 25 kilometers up. Fine ash particles from an eruption column fall out too quickly to significantly cool the atmosphere over an extended period of time, no matter how large the eruption.
Sulfur aerosols last many years, and several historic eruptions show a good correlation of sulfur dioxide layers in the atmosphere with a decrease in average temperature decrease of subsequent years. The close correlation was first established after the 1963 eruption of Agung volcano in Indonesia when it was found that sulfur dioxide reached the stratosphere and stayed as a sulfuric acid aerosol.
Without replenishment, the sulfuric acid aerosol layer around the earth is gradually depleted, but it is renewed by each eruption rich in sulfur dioxide. This was confirmed by data collected after the eruptions of El Chichon, Mexico (1982) and Pinatubo, Philippines (1991), both of which were high-sulfur compound carriers like Agung, Indonesia.”
http://volcanology.geol.ucsb.edu/gas.htm
There is also some evidence that if “volcanic activity was high enough, then a water vapor anomaly would be introduced into the lower stratosphere before the anomaly due to the previous eruption had disappeared. The result would be threefold in the long term: stratospheric cooling, stratospheric humidification, and surface warming due to the positive radiative forcing associated with the water vapor.”
http://journals.ametsoc.org/doi/pdf/10.1175/1520-0442(2003)016%3C3525%3AAGSOVE%3E2.0.CO%3B2#h1
9. Albedo “or reflection coefficient, is the diffuse reflectivity or reflecting power of a surface. It is defined as the ratio of reflected radiation from the surface to incident radiation upon it. Being a dimensionless fraction, it may also be expressed as a percentage, and is measured on a scale from zero for no reflecting power of a perfectly black surface, to 1 for perfect reflection of a white surface.”Wikipedia – Albedo
“The role of Clouds “in regulating weather and climate remains a leading source of uncertainty in projections of global warming.” “Different types of clouds exhibit different reflectivity, theoretically ranging in albedo from a minimum of near 0 to a maximum approaching 0.8.” Wikipedia – Albedo#Clouds
“Cloud Albedo varies from less than 10% to more than 90% and depends on drop sizes, liquid water or ice content, thickness of the cloud, and the sun’s zenith angle. The smaller the drops and the greater the liquid water content, the greater the cloud albedo, if all other factors are the same.” Wikipedia – Cloud Albedo
“On any given day, about half of Earth is covered by clouds, which reflect more sunlight than land and water. Clouds keep Earth cool by reflecting sunlight, but they can also serve as blankets to trap warmth.” Live Science
“Low, thick clouds primarily reflect solar radiation and cool the surface of the Earth. High, thin clouds primarily transmit incoming solar radiation; at the same time, they trap some of the outgoing infrared radiation emitted by the Earth and radiate it back downward, thereby warming the surface of the Earth. Whether a given cloud will heat or cool the surface depends on several factors, including the cloud’s altitude, its size, and the make-up of the particles that form the cloud. The balance between the cooling and warming actions of clouds is very close although, overall, averaging the effects of all the clouds around the globe, cooling predominates.” NASA Earth Observatory – Clouds
Snow “albedos can be as high as 0.9; this, however, is for the ideal example: fresh deep snow over a featureless landscape. Over Antarctica they average a little more than 0.8. Wikipedia – Albedo#Snow
“The albedo for different surface conditions on the sea ice range widely, from roughly 85 per cent of radiation reflected for snow-covered ice to 7 per cent for open water. These two surfaces cover the range from the largest to the smallest albedo on earth.” GRID-Arendal – United Nations Environment Programme (UNEP)
“Sea ice has a much higher albedo compared to other earth surfaces, such as the surrounding ocean. A typical ocean albedo is approximately 0.06, while bare sea ice varies from approximately 0.5 to 0.7. This means that the ocean reflects only 6 percent of the incoming solar radiation and absorbs the rest, while sea ice reflects 50 to 70 percent of the incoming energy. The sea ice absorbs less solar energy and keeps the surface cooler.
snow has an even higher albedo than sea ice, and so thick sea ice covered with snow reflects as much as 90 percent of the incoming solar radiation. This serves to insulate the sea ice, maintaining cold temperatures and delaying ice melt in the summer. After the snow does begin to melt, and because shallow melt ponds have an albedo of approximately 0.2 to 0.4, the surface albedo drops to about 0.75. As melt ponds grow and deepen, the surface albedo can drop to 0.15. As a result, melt ponds are associated with higher energy absorption and a more rapid ice melt.”
http://nsidc.org/cryosphere/seaice/processes/albedo.html
“It should be pointed out that these planetary albedos are averages. Taking Earth as an example, clouds vary from 0.4 to 0.8, snow varies from 0.4 to 0.85, forests vary from 0.04 to 0.1, grass is about 0.15, and water varies from 0.02 with the Sun directly overhead to 0.8 at low levels of incidence. So the Earth’s albedo varies, and depends on the extent of cloudiness, snowfall, and the Sun’s angle of incidence on the oceans. With an average albedo of 0.37, 63% of incoming solar energy contributes to the warmth of our planet.”
http://www.asterism.org/tutorials/tut26-1.htm
“The total solar radiation received at ground level consists of direct and indirect radiation (scattered, diffused, or reflected). The UVR component does not exceed 5% of the total incident radiation at sea level under cloudless atmospheric conditions. The intensity of sunlight at ground level varies with latitude, geographic location, season, cloud coverage, atmospheric pollution, elevation above sea level, and solar altitude. The 23.5° tilt of the earth’s axis affects the angle of incidence of solar radiation on the earth’s surface and causes seasonal and latitudinal variations in day length. At high altitudes, the intensity of UVR is significantly higher than at sea level. The spectral distribution of solar energy at sea level is roughly 3,44, and 53% in the UV, visible, and infrared regions, respectively. In practice, therefore, these variables need to be considered for the use of solar energy, including its UVR component.”
http://almashriq.hiof.no/lebanon/600/610/614/solar-water/idrc/01-09.html
“Ocean albedo varies not only with zenith angle, as above, but also tides, clouds, spindrift, plankton, other particulates, and temperature, Wind direction and velocity also have a major effect on waves and chop, affecting reflectance. At high zenith angles, the reflectance of still water, as in small ponds, etc., is close to 1.00. Choppy seas can have fairly high albedo.
See also: http://snowdog.larc.nasa.gov/jin/albedofind.html”
Also Particulates such as Soot/
Black_carbon warm “the Earth by absorbing heat in the atmosphere and by reducing albedo, the ability to reflect sunlight, when deposited on snow and ice. Black carbon stays in the atmosphere for only several days to weeks, whereas CO2 has an atmospheric lifetime of more than 100 years.”
“Estimates of black carbon’s globally averaged direct radiative forcing vary from the IPCC’s estimate of + 0.34 watts per square meter (W/m2) ± 0.25, to a more recent estimate by V. Ramanathan and G. Carmichael of 0.9 W/m2.” Wikipedia – Black Carbon
“Blooms of snow algea can reduce the surface albedo (light reflectance) of snow and ice, and largely affect their melting (Thomas and Duval, 1995; Hoham and Duval, 2001). For example, some glaciers in Himalayas are covered with a large amount of dark-colored biogenic material (cryoconite) derived from snow algae and bacteria (Kohshima et al., 1993; Takeuchi et al., 2001). The albedo of the intact surfaces bearing the cryoconite was substantially lower than that of the surface from which the cryoconite was artificially removed (5% versus 37%). The melting rates of the intact surfaces were reported to be 3 times larger than that of the surfaces without the cryoconite. Thus, snow algal activity possibly affects heat budget and mass balance of glaciers.” Department of Earth Sciences – Chiba University
Phytoplankton may influence Earth’s climate. A recent study used “a synergistic analysis of satellite observations (MODIS, SeaWiFS, AIRS, SSM/I and CERES)” to try to show that “dimethylsulfide (DMS) and isoprene emissions by marine phytoplankton” “into the atmosphere strongly influences cloud properties within a broad latitude belt in the Southern Hemisphere during the austral summer.” They “detected indirect aerosol effects over the Southern Ocean from 45°S to 65°S, especially in regions with plankton blooms, indicated by high chlorophyll-a concentration in seawater. The strong increase in cloud condensation nuclei column content from 2.0 × 10⁸ to more than 5.0 × 10⁸ CCN/cm2 for a chlorophyll increase from 0.3 to about 0.5 mg/m3 in these regions decreases cloud droplet effective radius and increases cloud optical thickness for water clouds. Consequently, the upward short-wave radiative flux at the top of the atmosphere increases.” There analysis found “reduced precipitation over the Antarctic Polar Frontal Zone during strong plankton blooms.” Krüger and Graßl, Geophysical Research Letters, 2011
“Even small shear rates can increase backscattering from blooms of large phytoplankton by more than 30 percent,” said Roman Stocker, Professor of Civil and Environmental Engineering at MIT and lead author on a paper about this work. “This implies that fluid flow, which is typically neglected in models of marine optics, may exert an important control on light propagation, influencing the rates of carbon fixation and how we estimate these rates via remote sensing.” Massachusetts Institute of Technology (MIT)
10. Biology
http://en.wikipedia.org/wiki/Biology
“Metabolism is the set of chemical reactions that happen in the cells of living organisms to sustain life.”
http://en.wikipedia.org/wiki/Metabolism
There are two primary sources of energy, Phototrophs where “Light is absorbed in photo receptors and transformed into chemical energy” and
Chemotrophs where “bond energy is released from a chemical compound.”
http://en.wikipedia.org/wiki/Primary_nutritional_groups
“Phototrophs
http://en.wikipedia.org/wiki/Photoautotroph
are the organisms (usually plants) that carry out photosynthesis;
http://en.wikipedia.org/wiki/Photosynthesis
to acquire energy. They use the energy from sunlight to convert carbon dioxide and water into organic materials to be utilized in cellular functions such as biosynthesis and respiration.” “In plants, algae, and cyanobacteria, photosynthesis uses carbon dioxide and water, releasing oxygen as a waste product.”
“In biology, carbon fixation;
http://en.wikipedia.org/wiki/Carbon_fixation
is the reduction of carbon dioxide to organic compounds by living organisms. The obvious example is photosynthesis. Carbon fixation requires both a source of energy such as sunlight, and an electron donor such as water. All life depends on fixed carbon organisms that grow by fixing carbon are called autotrophs—plants for example. Heterotrophs, like animals, are organisms which grow by using the fixed carbon produced by autotrophs. Some organisms can go either way. Fixed carbon, reduced carbon, and organic carbon all mean organic compounds. Carbon dioxide, in all its guises, is inorganic carbon.”
Chemoautotrophs;
http://en.wikipedia.org/wiki/Chemotroph
are “organisms that obtain carbon through Chemosynthesis”;
http://en.wikipedia.org/wiki/Chemosynthesis
“are phylogenetically diverse, but groups that include conspicuous or biogeochemically-important taxa include the sulfur-oxidizing gamma and epsilon proteobacteria, the Aquificaeles, the Methanogenic archaea and the neutrophilic iron-oxidizing bacteria.”
There are three ways that an “organism obtains carbon for synthesising cell mass;
Autotrophic – where “carbon is obtained from carbon dioxide (CO2)”, Heterotrophic – where “carbon is obtained from organic compounds” and Mixotrophic – carbon is obtained from both organic compounds and by fixing carbon dioxide.
Bacteria – TBD
“Methanotrophs (sometimes called methanophiles) are bacteria that are able to metabolize methane as their only source of carbon and energy.”
http://en.wikipedia.org/wiki/Methanotroph
“Some ferric iron-reducing bacteria (e.g. G. metallireducens) can use toxic hydrocarbons such as toluene as a carbon source, there is significant interest in using these organisms as bioremediation agents in ferric iron-rich contaminated aquifers.”
http://en.wikipedia.org/wiki/Microbial_metabolism
Fungi – TBD
Protozoa – TBD
Chromista – TBD
Animal – Anthropogenic:
Carbon Dioxide;
http://en.wikipedia.org/wiki/Carbon_dioxide
contributes to the Greenhouse Effect;
http://www.ucar.edu/learn/1_3_1.htm
“The lime industry is a significant carbon dioxide emitter. The manufacture of one tonne of calcium oxide involves decomposing calcium carbonate, with the formation of 785 kg of CO2 in some applications, such as when used as mortar; this CO2 is later re-adsorbed as the mortar goes off. Additionally, if the heat supplied to form the lime (3.75 MJ/kg in an efficient kiln) is obtained by burning fossil fuel it will release CO2: in the case of coal fuel 295 kg/t; in the case of natural gas fuel 206 kg/t. The electric power consumption of an efficient plant is around 20 kWh per tonne of lime. This additional input is the equivalent of around 20 kg CO2 per ton if the electricity is coal-generated. Thus, total emission may be around 1 tonne of CO2 for every tonne of lime even in efficient industrial plants, but is typically 1.3 t/t”
http://en.wikipedia.org/wiki/Lime_kiln
and
influences the rate of plant growth ;
http://www.sjsu.edu/faculty/watkins/CO2plants.htm
Methane
http://en.wikipedia.org/wiki/Methane
Soot/
Icebreakers/Arctic Shipping/Fishing/Cruise-Line Transits
Land Use;
http://en.wikipedia.org/wiki/Land_use
“is the human use of land. Land use involves the management and modification of natural environment or wilderness into built environment such as fields, pastures, and settlements.”
“Land use practices vary considerably across the world. The United Nations’ Food and Agriculture Organization Water Development Division explains that “Land use concerns the products and/or benefits obtained from use of the land as well as the land management actions (activities) carried out by humans to produce those products and benefits.” s of the early 1990s, about 13% of the Earth was considered arable land, with 26% in pasture, 32% forests and woodland, and 1.5% urban areas.”
“Land Cover/Land Use Change [LCLUC]”;
http://en.wikipedia.org/wiki/Land_use,_land-use_change_and_forestry
http://wattsupwiththat.com/2011/04/18/more-on-land-use-change-affecting-temperatures/
“has a profound impact on the regional‐scale surface energy and water balance and where it has been intensive.” There is “growing detectable evidence about weather and climatic feedbacks and possible teleconnections associated with LULCC.” “The LULCC impact is likely on a par with other major global forcings but unlike warming seen from GHG emissions, LULCC forcing is multi directional and can warm/ cool, cause positive/negative feedbacks depending on the region and timing.” “The fact that the impact of LULCC is small with respect to the global average radiative forcing, with the exception of emissions of CO2, is, however, not a relevant metric as the essential resources of food, water, energy, human health and ecosystem function respond to regional and local climate not to a global average.”
http://www.iclimate.org/dev/publications/Niyogi-LCLUC-MARCH2011-SHORT.pdf
A study by researchers from Purdue University and the universities of Colorado and Maryland concluded that greener land cover contributes to cooler temperatures, and almost any other change leads to warmer temperatures. The study, published on line and set to appear in the Royal Meteorological Society’s International Journal of Climatology later this year, is further evidence that land use should be better incorporated into computer models projecting future climate conditions, said Purdue doctoral student Souleymane Fall, the article’s lead author.
Among the study’s findings:
* In general, the greener the land cover, the cooler is surface temperature.
* Conversion to agriculture results in cooling, while conversion from agriculture generally results in warming.
* Deforestation generally results in warming, with the exception of a shift from forest to agriculture. No clear picture emerged from the impact of planting or seeding new forests.
* Urbanization and conversion to bare soils have the largest warming impacts.
In general, land use conversion often results in more warming than cooling.”
http://news.uns.purdue.edu/x/2009b/091102NiyogiClimate.html
“Although variations in the natural flooding regimes were likely the dominant mechanism driving changes in surface water, it is possible that human manipulations through dams and other agriculture infrastructure contributed. This study demonstrates the substantial role that land-cover and surface water change can play in continental-scale albedo trends and suggests ways to better incorporate these processes into global climate models.”
http://journals.ametsoc.org/doi/abs/10.1175/2010EI342.1
http://wattsupwiththat.com/2011/04/18/more-on-land-use-change-affecting-temperatures/
– Deforestation
– Reforestation
– Deforestation
– Greening
– Desertification
– Cultivation/Farming
http://en.wikipedia.org/wiki/Plant_cultivation
Reclamation
http://en.wikipedia.org/wiki/Land_reclamation
Urban Heat Islands
Run Off From Asphalt
Snow plowing/clearance
Farming
Sewage/Wastewater Treatment Discharge
Fossil Fuel Energy Generation and Waste Heat
Nuclear Power Generation – Including Ships
Renewables – Wind Farms, Solar Arrays, Dams and Ethanol
“In 2008, total worldwide energy consumption was 474 exajoules (474×1018 J=132,000 TWh). This is equivalent to an average energy consumption rate of 15 terawatts (1.504×10¹³ W).”
http://en.wikipedia.org/wiki/World_energy_resources_and_consumption
etc.
“Metabolism is the set of chemical reactions that happen in the cells of living organisms to sustain life.”
http://en.wikipedia.org/wiki/Metabolism
“The basal metabolic rate of a human is about 1,300-1,500 kcal/day for an adult female and 1,600-1,800 kcal/day for an adult male.”
http://hypertextbook.com/facts/2009/VickieWu.shtml
Animal – Non-Anthropogenic including
Plankton
Beaver (Genus Castor)
http://en.wikipedia.org/wiki/Beaver
etc.
11. Chemical
Fossil Fuels:
Coal
Oil shale
Petrochemicals
– Petroleum
– Mineral Oil
Asphalt
Tar Pits/Sands
Methane
http://en.wikipedia.org/wiki/Methane
etc.
Iron Fertilization “occurs naturally when upwellings bring nutrient-rich water to the surface, as occurs when ocean currents meet an ocean bank or a sea mount. This form of fertilization produces the world’s largest marine habitats. Fertilization can also occur when weather carries wind blown <a href=”http://en.wikipedia.org/wiki/Dust“>dust long distances over the ocean, or iron-rich minerals are carried into the ocean by glaciers,[3] rivers and icebergs. Iron Fertilization can result from Geo-engineering; http://www.whoi.edu/oceanus/viewArticle.do?id=34167
Reactions:
Combustion
– Forest Fires
– Fossil Fuels
– Methane
http://en.wikipedia.org/wiki/Methane
etc.
“Photosynthesis;
http://en.wikipedia.org/wiki/Photosynthesis
is a chemical process that converts carbon dioxide into organic compounds, especially sugars, using the energy from sunlight.”
“Chemosynthesis;
http://en.wikipedia.org/wiki/Chemosynthesis
is the biological conversion of one or more carbon molecules (usually carbon dioxide or methane) and nutrients into organic matter using the oxidation of inorganic molecules (e.g. hydrogen gas, hydrogen sulfide) or methane as a source of energy, rather than sunlight, as in photosynthesis.”
Conversion of Methane, CO2, etc.
12. Physics
Temperature
http://wattsupwiththat.com/2012/01/01/a-big-picture-look-at-earths-temperature/
http://en.wikipedia.org/wiki/Temperature
Variations in atmospheric and oceanic temperature can have significant impacts on Earth’s climate, including cloud cover, rainfall, Flora, Fauna, Ocean Circulation and Marine Biology. These variables can in turn affect Albedo and Transpiration.
A Biogeochemical Cycle;
http://en.wikipedia.org/wiki/Biogeochemical_cycling
“or substance turnover or cycling of substances is a pathway by which a chemical element or molecule moves through both biotic (biosphere) and abiotic (lithosphere, atmosphere, and hydrosphere) compartments of Earth. A cycle is a series of change which comes back to the starting point and which can be repeated.” “The term “biogeochemical” tells us that biological; geological and chemical factors are all involved.” “Ecological systems (ecosystems) have many biogeochemical cycles operating as a part of the system, for example the water cycle, the carbon cycle, the nitrogen cycle, etc. All chemical elements occurring in organisms are part of biogeochemical cycles. In addition to being a part of living organisms, these chemical elements also cycle through abiotic factors of ecosystems such as water (hydrosphere), land (lithosphere), and/or the air (atmosphere).”
Lars G. Franzén and Roger A. Cropp argue in Geografiska Annaler 2007, that “Carbon sequestering in peatlands is believed to be a major climate regulating mechanisms throughout the late Phanerozoic (Franzén, 1994; Franzén et al, 1996). Since plant life first evolved on land, peatlands have been significant carbon sinks, which could explain significant parts of the large variations in the atmospheric carbon dioxide observed in various records.” They also “suggest that the ice age cycles during the Pleistocene are generated by the interglacial growth of peatlands, the sequestering of carbon into this terrestrial pool and the subsequent cooling by decreased greenhouse effect. The final initiation of ice age pulses towards the end of interglacials on the other hand is likely attributed to the cyclic influx of cosmic dust to the Earth surface, which in turn regulates cloud formation and the incoming shortwave radiation (Franzén & Cropp, 2007). These shorter cycles have a frequency of c. 1000-1250 years and might be connected to sunspot or other low frequency solar variations.
http://www.peatnet.siu.edu/Assets/F.pdf
Electricity
http://en.wikipedia.org/wiki/Electricity
Lightning
http://en.wikipedia.org/wiki/Lightning
is an atmospheric electrostatic discharge (spark) accompanied by thunder, which typically occurs during thunderstorms, and sometimes during volcanic eruptions or dust storms. From this discharge of atmospheric electricity, a leader of a bolt of lightning can travel at speeds of 220,000 km/h (140,000 mph), and can reach temperatures approaching 30,000 °C (54,000 °F), hot enough to fuse silica sand into glass channels known as fulgurites, which are normally hollow and can extend some distance into the ground. There are some 16 million lightning storms in the world every year. Lightning causes ionisation in the air through which it travels, leading to the formation of nitric oxide and ultimately, nitric acid, of benefit to plant life below.
Lightning can also occur within the ash clouds from volcanic eruptions, or can be caused by violent forest fires which generate sufficient dust to create a static charge.
How lightning initially forms is still a matter of debate. Scientists have studied root causes ranging from atmospheric perturbations (wind, humidity, friction, and atmospheric pressure) to the impact of solar wind and accumulation of charged solar particles. Ice inside a cloud is thought to be a key element in lightning development, and may cause a forcible separation of positive and negative charges within the cloud, thus assisting in the formation of lightning.”
Additional potential climatic influences of electricity are suggested by Brian Tinsley who argues that “there are good correlations, on the day-to-day time scale, between the three solar wind – modulated inputs to Jz mentioned above and small changes in atmospheric temperature and dynamics. Dr. Tinsley has hypothesized that the atmospheric responses are due to changes in the electrical interactions between charged aerosol particles and droplets.
One process applicable to clouds with their tops above the freezing level is the electrical enhancement of the rate of scavenging of ice-forming nuclei (IFN), that increases the rate of contact ice nucleation. This has consequences for cloud thickness and reflectivity to sunlight, and for precipitation rates and latent heat transfer, both of which are capable of affecting atmospheric temperature and dynamics. This mechanism also explains many reports of high rates of ice formation in certain types of clouds that has been a long-standing puzzle for cloud physicists.
Another process that is applicable to warm clouds appears to be caused by changes in the concentration of cloud condensation nuclei (CCN) due to electrical effects on the production and rate of scavenging of ultrafine aerosol particles and the CCN that they may eventually form. Changes in CCN concentration affect drizzle production and cloud lifetime and cloud cover (the indirect aerosol effect).
In addition, electrical scavenging effects may explain the discrepancy between rates of aerosol scavenging by falling rain that have been observed in comparison with those calculated without adequately accounting for electrical effects.”
http://www.utdallas.edu/physics/faculty/tinsley.html
http://www.utdallas.edu/physics/faculty/tinsley/PhysTodayLttr09.pdf
http://www.utdallas.edu/physics/faculty/tinsley/ROP%20paper.pdf
Lastly, “dramatic losses from the electron radiation belts also result from interaction of energetic elections with lightning-generating waves, called whistlers. Lightening-induced electron precipitation events exemplify direct coupling of tropospheric weather systems with the radiation belts and the ionospheric regions overlying thunderstorms.”
Heat Capacity
http://en.wikipedia.org/wiki/Heat_capacity
or thermal capacity, is the measurable physical quantity that characterizes the amount of heat required to change a substance’s temperature by a given amount.”
“Anther way of explaining a materials’ Heat Capacity is to think about it as the measurement of thermal energy storage, just like temperature is the measurement of thermal energy given off. Heat capacity is how much thermal energy a material stores up and temperature is how much thermal energy a material gives off.”
“The heat capacity of the global ocean, obtained from regression of ocean heat content vs. global mean surface temperature, GMST, is 14 ± 6 W
yr m-2 K-1, equivalent to 110 m of ocean water; other sinks raise the effective planetary heat capacity to 17 ± 7 W yr m-2 K-1 (all uncertainties are 1-sigma estimates).”
http://www.ecd.bnl.gov/steve/pubs/HeatCapacity.pdf
Specific Heat Capacity Table: http://www2.ucdsb.on.ca/tiss/stretton/database/Specific_Heat_Capacity_Table.html
“As this planetary energy imbalance is virtually the same as the energy stored in the top 3 km of the oceans, and other energy stores in the climate system are much smaller (Levitus et al. 2001), we can examine either the global mean nonequilibrium radiative flux or the ocean storage to evaluate this quantity. Peixoto and Oort (1992, p. 351) even concluded that such a relation exists between the radiative forcing and ocean heat storage over the annual timescale. They showed that the annual variation of net radiation at the top of the atmosphere is in good agreement, both in phase and amplitude, with the ocean heat storage.”
http://pielkeclimatesci.files.wordpress.com/2009/10/r-247.pdf
“Earth’s radiation imbalance is determined from ocean heat content data and compared with results of direct measurements. Distinct time intervals of alternating positive and negative values are found: 1960–mid-1970s (−0.15), mid-1970s–2000 (+0.15), 2001–present (−0.2 W/m2), and are consistent with prior reports. These climate shifts limit climate predictability.” “A strong connection between Earth’s radiative imbalance and the heat content of the oceans has been known for some time (see, e.g., Peixoto and Oort [1]). The heat content has played an important role in recent discussions of climate change, and Pielke [2] has revived interest in its relationship with radiation.”
http://wattsupwiththat.com/2009/08/11/ocean-heat-content-and-earth%E2%80%99s-radiation-imbalance/
The “Emissivity
http://en.wikipedia.org/wiki/Emissivity
of a material (usually written ε or e) is the relative ability of its surface to emit energy by radiation. It is the ratio of energy radiated by a particular material to energy radiated by a black body at the same temperature. A true black body would have an ε = 1 while any real object would have ε < 1. Emissivity is a dimensionless quantity. In general, the duller and blacker a material is, the closer its emissivity is to 1. The more reflective a material is, the lower its emissivity. Highly polished silver has an emissivity of about 0.02." "Emissivity depends on factors such as temperature, emission angle, and wavelength." "The emissivity of Earth's atmosphere varies according to cloud cover and the concentration of gases that absorb and emit energy in the thermal infrared (i.e., wavelengths around 8 to 14 micrometres). These gases are often called greenhouse gases, from their role in the greenhouse effect. The main naturally-occurring greenhouse gases are water vapor, carbon dioxide, methane, and ozone. The major constituents of the atmosphere, N2 and O2, do not absorb or emit in the thermal infrared."
"The transfer of heat energy by radiation can occur in a vacuum , unlike conduction and convection. Heat radiation is the same form of wave energy transfer as light, radio, and x-ray wave energy. The rate of emmission of heat energy is related to the temperature difference, the distance between the surfaces, and the emissivity of the surfaces. Bright reflective surfaces have the lowest emissivity values."
http://www.roymech.co.uk/Related/Thermos/Thermos_HeatTransfer.html
http://www.infrared-thermography.com/material-1.htm
Pressure
http://en.wikipedia.org/wiki/Pressure
States of Matter
http://en.wikipedia.org/wiki/State_of_matter
Heat Conduction
http://en.wikipedia.org/wiki/Heat_conduction
Convection
http://en.wikipedia.org/wiki/Convection
Thermal Radiation
http://en.wikipedia.org/wiki/Thermal_radiation
Thermodynamics
http://en.wikipedia.org/wiki/Laws_of_thermodynamics
Entropy
http://en.wikipedia.org/wiki/Entropy
13. Known Unknowns:
A. Non-Equilibrium Pattern Systems, aka “nonlinear pattern formation in far-from-equilibrium dissipative systems” and “pattern formation in dissipative systems” “The spontaneous formation of spatio-temporal patterns can occur when a stationary state far from thermodynamic equilibrium is maintained through the dissipation of energy that is continuously fed into the system. While for closed systems the second law of thermodynamics requires relaxation to a state of maximal entropy, open systems are able to interchange matter and energy with their environment. By taking up energy of higher value (low entropy) and delivering energy of lower value (high entropy) they are able to export entropy, and thus to spontaneously develop structures characterized by a higher degree of order than present in the environment.” PhD thesis – “Controlling turbulence and pattern formation in chemical reaction” Matthias Bertram,
Examples of this effect can be seen in the following examples of Belousov-Zhabotinsky (BZ) reactions:
Phil Salmon argues in this article;
that ENSO is a Non-Equilibrium Pattern System. “Of the class of known attractors of nonlinear oscillatory systems, the Lorenz and possibly Roessler attractors bear similarities to the attractor likely responsible for the alternating phases of La Nina and el Nino dominance that characterise the ENSO and constitute the PDO.” Here are several visualizations of Pacific Ocean Temperatures:
http://wattsupwiththat.files.wordpress.com/2011/01/etb58j1.gif?w=640
http://www.cpc.ncep.noaa.gov/products/intraseasonal/tlon_heat.gif
http://www.bom.gov.au/climate/enso/sub_surf_mon.gif
“The oceanic or limnological Mixed Layer;
http://en.wikipedia.org/wiki/Mixed_layer
is a layer in which active turbulence has homogenized some range of depths. The surface mixed layer is a layer where this turbulence is generated by winds, cooling, or processes such as evaporation or sea ice formation which result in an increase in salinity.” The atmospheric mixed layer is a zone having nearly constant potential temperature and specific humidity with height. The depth of the atmospheric mixed layer is known as the mixing height. Turbulence typically plays a role in the formation of fluid mixed layers.”
“The mixed layer plays an important role in the physical climate. Because the specific heat of ocean water is much larger than that of air, the top 2.5 m of the ocean holds as much heat as the entire atmosphere above it. Thus the heat required to change a mixed layer of 25 m by 1 °C would be sufficient to raise the temperature of the atmosphere by 10 °C. The depth of the mixed layer is thus very important for determining the temperature range in oceanic and coastal regions. In addition, the heat stored within the oceanic mixed layer provides a source for heat that drives global variability such as El Nino.
The mixed layer is also important as its depth determines the average level of light seen by marine organisms. In very deep mixed layers, the tiny marine plants known as phytoplankton are unable to get enough light to maintain their metabolism. The shallowing of the mixed layers in the springtime in the North Atlantic is therefore associated with a strong spring bloom of plankton.”
“There are three primary sources of energy for driving turbulent mixing within the open-ocean mixed layer. The first is breaking of surface waves, which injects a great deal of energy into the upper few meters, where most of it dissipates. The second is wind-driven currents, which create layers in which there are velocity shears. When these shears reach sufficient magnitude, they can eat into stratified fluid. This process is often described and modelled as an example of Kelvin-Helmholtz instability, though other processes may play a role as well. Finally, if cooling, addition of brine from freezing sea ice, or evaporation at the surface causes the surface density to increase, convection will occur. The deepest mixed layers (exceeding 2000 m in regions such as the Labrador Sea) are formed through this final process, which is a form of Rayleigh–Taylor instability. Early models of the mixed layer such as those of Mellor and Durbin included the final two processes. In coastal zones, large velocities due to tides may also play an important role in establishing the mixed layer.”
B. Chaotic Strange Attractors and a Limit Cycle:
Dr. Robert Brown argues in this comment/article that “IIRC this is one of the simplest systems exhibiting an attractor and limit cycle, and illustrates many of the features of more complicated dynamical systems. The attractor/fixed point in this case is the population of e.g. foxes and rabbits that remains in perfect equilibrium from year to year. Note well that this equation is deterministic, but of course a real population — even being modeled — always has random (or at least, “unpredictable”) variations — a certain amount of noise — and is actually discretized and not continuous as one cannot have half a cheetah eating \pi baboons.”
“predator-prey differential equations”, e.g. “The Lotka–Volterra equations, also known as the predator–prey equations, are a pair of first-order, non-linear, differential equations frequently used to describe the dynamics of biological systems in which two species interact, one a predator and one its prey.”
http://en.wikipedia.org/wiki/Lotka%E2%80%93Volterra_equation#Physical_meanings_of_the_equations
“A better continuous “kind” of differential equation for describing systems like this with noise is something called a Langevin equation in physics — a system with “fast” microscopic degrees of freedom that one accounts for on average with a stochastic term, and slower degrees of freedom one integrates out like the predator prey equation.”
“In statistical physics, a Langevin equation (Paul Langevin, 1908) is a stochastic differential equation describing the time evolution of a subset of the degrees of freedom. These degrees of freedom typically are collective (macroscopic) variables changing only slowly in comparison to the other (microscopic) variables of the system. The fast (microscopic) variables are responsible for the stochastic nature of the Langevin equation.”
http://en.wikipedia.org/wiki/Langevin_equation
Uncertainty
Randomness
Evolution
Infinite Iterations
Chaos?
14. Unknown unknowns
A lot of other things.
General summaries of the potential climatic variables:
http://www.physicalgeography.net/fundamentals/7y.html
http://oceanservice.noaa.gov/education/pd/climate/factsheets/whatfactors.pdf
http://ioc3.unesco.org/oopc/obs/ecv.php
Do you have a link to the rate at which the Earth’s rotation is slowing over geological timescales ie the past 4 billion years?
Great list!
Crikey! What a magisterial survey. Plaudits to Just the Facts!
And with all these parameters and complexities, the AGW brigade wants to focus on one equation, one relationship and draw a straight line with it. The hubris of these people knows no bounds.
Seems too simple. So how about some more?
“and Comets;”
And comet corpses in the solar wind:
http://science.nasa.gov/science-news/science-at-nasa/2012/20jan_cometcorpse/
Sorry if that makes a formula to describe it all a bit more complex.
These corpses would change both the makeup of the atmosphere (add heaps of carbon) and the magnetic interactions within the solar system. The extra carbon would mean the carbon cycle calculations could be wrong.
Well, is this both global and regional? Not sure that real human influences are included ,especially the ones that the warmists seem to want to ignore.
How about Land Use
Dust also plays a role in ocean fertilization. It’s one of the main sources of iron for mid ocean regions.
Changes in temperature and rainfall affect what types of plants can grow in a region. This in turn affects albedo and transpiration.
Very interesting list, thanks.
Settled Sciene indeed !
Regarding that Helium, it escapes to space and takes some heat with it. Albeit, a very very very small amount of heat. So the belief that the Earth can only cool by radiation is about 99.9999999% correct but not completely true.
The Helium is constantly produced by radioactive decay, moves upward through the atmosphere and leaves. Thus, the Earth is both cooling and on a diet.
Cheers, Kevin
Not a problem.
I am confident The Team has all this included in their Models.
I mean, they are scientists, right? And the science is settled. So it must be included.
Also, dont forget; It was all FLAT before the industrial Revolution. So it is ONLY man that can have an influence on the climate. FLAT, I tell you! Both CO2 and temperature.
If it isnt included in the models, and if it wasnt FLAT, then someone has commited fraud.
And if anyone claims that, they are conspiracy theorists.
Agree?
JaneHM says: January 21, 2012 at 10:17 am
Do you have a link to the rate at which the Earth’s rotation is slowing over geological timescales ie the past 4 billion years?
Yes, its caused by Tidal Acceleration:
http://en.wikipedia.org/wiki/Tidal_acceleration
“Tidal acceleration is an effect of the tidal forces between an orbiting natural satellite (e.g. the Moon), and the primary planet that it orbits (e.g. the Earth). The “acceleration” is usually negative, as it causes a gradual slowing and recession of a satellite in a prograde orbit away from the primary, and a corresponding slowdown of the primary’s rotation. The process eventually leads to tidal locking of first the smaller, and later the larger body. The Earth-Moon system is the best studied case.”
“The presence of the moon (which has about 1/81 the mass of the Earth), is slowing Earth’s rotation and lengthening the day by about 2 ms every one hundred years.”
“Historical evidence
This mechanism has been working for 4.5 billion years, since oceans first formed on the Earth. There is geological and paleontological evidence that the Earth rotated faster and that the Moon was closer to the Earth in the remote past. Tidal rhythmites are alternating layers of sand and silt laid down offshore from estuaries having great tidal flows. Daily, monthly and seasonal cycles can be found in the deposits. This geological record is consistent with these conditions 620 million years ago: the day was 21.9±0.4 hours, and there were 13.1±0.1 synodic months/year and 400±7 solar days/year. The length of the year has remained virtually unchanged during this period because no evidence exists that the constant of gravitation has changed. The average recession rate of the Moon between then and now has been 2.17±0.31 cm/year, which is about half the present rate.”
Earth’s rotation is slowing “due to a transfer of Earth’s rotational momentum to the Moon’s orbital momentum as tidal friction slows the Earth’s rotation. That increase in the Moon’s speed is causing it to slowly recede from Earth (about 4 cm per year), increasing its orbital period and the length of a month as well.” “The slowing rotation of the Earth results in a longer day as well as a longer month. Once the length of a day equals the length of a month, the tidal friction mechanism will cease. (ie. Once your speed on the track matches the speed of the horses, you can’t gain any more speed with your lasso trick.) That’s been projected to happen once the day and month both equal about 47 (current) days, billions of years in the future. If the Earth and Moon still exist, the Moon’s distance will have increased to about 135% of its current value.”
http://www.physlink.com/education/askexperts/ae695.cfm
I’ve added additional details to section 1. Earth’s Rotational Energy – Tidal Acceleration, thank you for your question.
Very OT except as it relates to continuing ridiculousness,or perhaps moderating ridiculousness, the folks at New Scientist seem to have executed a serious worm turn away from Green Dogma with this piece
http://www.newscientist.com/article/dn21341-fracking-risk-is-exaggerated.html
Fracking risk is exaggerated
“Frack away, there’s no reason not to. Two of the main objections to “fracking” for shale gas have been blown out of proportion, according to British geologists.
Hydraulic fracturing, or fracking, involves pumping water, sand and chemicals into methane-rich shale deposits around 2 kilometres underground to liberate natural gas. It has been accused of contaminating drinking water with methane and chemicals, and causing minor earthquakes.
“We think the risk is pretty low,” said Mike Stephenson, head of energy science at the British Geological Survey at a press briefing in London on Tuesday.”
The conclusion has been obvious for quite a while, but it seems significant that the usually reliably green crowd at NS is embracing it at this point.
@JamesHN
In the rotational energy section:
‘Also of note, “Over millions of years, [Earth’s] rotation is significantly slowed by gravitational interactions with the Moon: see tidal acceleration.
http://en.wikipedia.org/wiki/Tidal_acceleration
“The presence of the moon (which has about 1/81 the mass of the Earth), is slowing Earth’s rotation and lengthening the day by about 2 ms every one hundred years.”’
So given a few billion years more and we will slow to the Moon’s orbital frequency.
While the variation of UV may be “very tiny”, I believe it has a major influence on the temperature of the stratosphere and possibly the energy content of the oceans (as UV is the deepest penetrating light into the oceans). It is UV that cases the stratosphere to have its reverse temperature gradient with altitude and acts as a “cap” on tropospheric convection. It is the “roof” of the greenhouse. So that tiny amount of radiation would have a major impact on surface temperature by capping the altitude (and therefore temperature) at the top of the convection column. A small change in UV might result in major changes elsewhere.
Ok. Let’s model that.
Earth Magnetic Field & Cosmic Rays
http://climateresearchnews.com/2009/01/new-paper-supports-a-cosmic-rays-clouds-climate-link/
This is the 2009, Danish research purporting to support the link between the earth magnetic field, cosmic rays and cloud formations.
Siliggy says: January 21, 2012 at 10:30 am
And comet corpses in the solar wind:
http://science.nasa.gov/science-news/science-at-nasa/2012/20jan_cometcorpse/
I do not see how a “comet corpse” could influence Earth’s climate. According to the article you cited, Dean Pesnell, a co-author of the Science paper and Project Scientist for SDO at the Goddard Space Flight Center, “says it might be possible to detect such “comet corpses” as they waft past Earth.” If we can’t even detect them yet, it seems premature to include them as a potential variable.
These corpses would change both the makeup of the atmosphere (add heaps of carbon) and the magnetic interactions within the solar system. The extra carbon would mean the carbon cycle calculations could be wrong.
This seems highly speculative and not grounded in fact. According to the article you cited, “Comets are rich in ice (frozen H2O), so when they dissolve in the hot solar atmosphere, the gaseous remains contain plenty of oxygen and hydrogen. A solar wind stream containing extra oxygen could be a telltale sign of a disintegrated comet.” Can you cite any evidence that “corpses would change both the makeup of the atmosphere (add heaps of carbon) and the magnetic interactions”?
Also, UV has considerable impact on the mesosphere. For example, at 36,000 feet one is above 75% of the atmosphere but they are above more than 75% of the CO2. This is because UV breaks CO2 into CO and O in the mesosphere. Also, most of the water vapor in the mesosphere comes from ice from space. Little bits of tiny comet fragments enter the atmosphere every day. The mesosphere also contains a lot of stuff like iron vapor also from bits of stuff entering the atmosphere from space and burning up. Iron accounts for a fairly significant amount of the gas in the mesosphere. But if the UV reduces, the amount of CO2 above the stratosphere increases and might have an additional impact on global temperatures.
It isn’t a ’cause’, but Chaos Theory deserves a mention in here somewhere.
There’s a complete combinatorial explosion in predicting -weather-, the only reason there’s any thought at all of predicting anything beyond seven days out is the result of Chaos Theory.
The recent article here on WUWT on why the other extant attractor nodes involve Chicago under ice, and that deserves mention in there.
http://www.amazon.com/Chaos-Making-Science-James-Gleick/dp/0140092501/ref=sr_1_2?s=books&ie=UTF8&qid=1327173243&sr=1-2
Never mind all that detail.
“The atmosphere ALWAYS reconfigures its energy distribution so that the Atmospheric Thermal Effect/Adiabatic Lapse Rate is maintained.”
Wilde’s Law.
On the WUWT threads many are doing all they can to ignore the implications of the Ideal Gas Law and N & Z’s ATE ( formerly widely accepted as the Adiabatic Lapse Rate or ALR).
Just look at Wikipedia here:
http://en.wikipedia.org/wiki/Lapse_rate
“the concept can be extended to any gravitationally supported ball of gas.”
and:
“the atmosphere is warmed by conduction from Earth’s surface, this lapse or reduction in temperature normal with increasing distance from the conductive source.”
which together show that we are dealing here with long established science although recent shenanigans have made it necessary for N & Z to try to redefine the adiabatic lapse rate (ALR) as ATE for the current uneducated generation.
So the issue isn’t whether the phenomenon is the ATE (Atmospheric Thermal Effect) or the ALR (Adiabatic Lapse Rate)
We can see that they are one and the same.
The issue is whether increasing GHGs can make a difference to the ATE/ALR by virtue of their radiative characteristics.
Well what Ned is doing is simply refining the data and the S-B calculations to show that the effect of more GHGs is zero as against the AGW theory that more GHGs can ADD to the ATE/ALR.
Where I propose a novel idea is in showing WHY the extra GHGs have zero or near zero effect on the ATE/ALR. Ned demonstrates the fact that there is a zero effect and I say WHY there is a zero effect.
The fact is that the entire atmosphere responds to ANY forcing that attempts to disrupt ATE/ALR by altering the tropopause height and that change in height then allows the surface pressure distribution to slide poleward or equatorward beneath the tropopause to negate the thermal effect of any change in tropopause height either at equator or poles.
The same process occurs on EVERY planet that has an atmosphere which tries to disrupt ATE/ALR. The atmosphere ALWAYS reconfigures so that ATE/ALR is maintained.
There is no other possible solution. IMHO.
To my mind the jigsaw is complete.
As I pointed out in another thread recently, for me the most significant neglected element in all the energy balance calculations is the biological i.e. LIFE. Virtually all the energy necessary to drive life on this planet ultimately derives from the insolation falling down on us from the Sun. A great deal of that energy is effectively removed from the radiative balance, which to my mind, raises a significant question about whether the widely assumed notion that the incoming and out going radiation should always tend toward equilibrium. From what I’ve seen no one has an estimate of what the energy use of all of life on the planet is that is even barely credible. Assuming it is negligible when it is so far from known doesn’t seem at all justified.
The solar input that is converted into kinetic energy to drive the multitudes of various circulations on the planet, is also effectively removed from the radiative balance and is at least as weakly quantified as the biological component.
John in L du B says: January 21, 2012 at 10:34 am
Well, is this both global and regional?
Yep, I am going for consummate list. I will drill down to just the key global variables in the forthcoming WUWT Likely Climatic Variables Reference Page
Not sure that real human influences are included ,especially the ones that the warmists seem to want to ignore.
How about Land Use
Section 10. Biology – 10. Biology – Animal – Anthropogenic includes “Land Use Changes” and a number of others, but I haven’t dug too far into these yet:
Carbon Dioxide;
Methane
Nitrous Oxide
Ozone
Particulates, especially Black Carbon/Soot
Aerosols
Icebreakers/Arctic Shipping/Fishing/Cruise-Line Transits
Contrails
Nuclear Power Generation – Including Ships
Land Use Changes – Including De and Re-Forestation
Urban Heat Islands
Run Off From Asphalt/Urban Heat Islands
Fossil Fuel Energy Generation Waste Heat –
Renewables – Wind Farms, Solar Arrays, Dams and Ethanol
Sewage/Wastewater Treatment Discharge
Additional examples and proposed links are most welcome.
Wow! This is one for the bookmarks.Thanks, and hopefully I can find time to run through it all within the year!
Looks like you threw everything into the mix, including the kitchen sink!! Lest anyone laughs, the kitchen sink provides a very telling experiment about the coriolis effect. It’s an urban legend which says the way the water rotates as it goes down the pipe has an effect on the climate… 😉
Michael Bergeron, I suspect that in a few billion years we won’t have slowed to the moon’s orbital frequency, because the moon will probably have wandered of in to the big black!
Anthea
What? Are you saying that a trace gas is not the control knob we can adjust to achieve any desired temperature, falling seas, fading hurricanes, the overthrow of capitalism, and social joy throughout the world? What ever next! Perhaps you will be asking me to distrust the UN, the IPCC, the EPA, the NAS, NOAA, NCAR, the RS, and so on through many more permutations of upper case letters around the world, united in their delight at finding that control knob with which they are achieving all their political goals. Shall all that progress be lost? Say it is so!
Hoser says:
January 21, 2012 at 11:02 am
“Ok. Let’s model that.”
Ok, I’ll give it a go, It’ll take a week or two, it shouldn’t be too hard once I remove all the erroneous Post Normal Scientific formulas and rebuild the science based on known physical laws and give the science of our planets climate and it’s enormous complexity some perspective.
Actually, when I think of it, I probably could!
I’m sure a simple computer model would be adequate (sarcasm).