By P Gosselin o
Germany’s DWD national weather service has published its monthly, preliminary, data for May 2026.
These data also include the preliminary regional averages for temperature (14.1 °C) and precipitation (65 mm).
In terms of temperatures, 14 of the previous 100 Mays were warmer than May 2026, with 2018 taking the top spot at 16 °C. There is a clear warming trend; only three Mays were warmer before 1980 (data).
Precipitation, on the other hand, shows a very mixed picture in May: of the 100 previous years, 44 were drier, 25 of which occurred before 1980. The driest May was in 1989 (28.2 mm), the wettest in 2007 (131.1 mm). Graphically:
May mean temperatures in Germany [°C]

The graph above shows the raw data and (in bold) a 30-year low-pass filter applied to the Loess data, similar to the DWD method.
A rise can be seen up to around 1950, followed by a drop of approximately 0.5 °C, a rise of 1.4 °C after 1980, and a more or less flat trend after 2006. There is also a great deal of variability in the data after 2000; between 2018 and 2019, the range is 5 °C!
A lot of weather (as is usual for individual months), yet the trend is still clear. Spring as a whole (averages for March, April, May:
Spring mean temperatures, Germany

Here, the trend is even clearer after 1980, with temperatures rising by around 2 °C since then. At 9.9 °C, 2026 is 1 degree cooler than the warmest spring on record (2024), and there have been a total of six warmer springs, none of which occurred before 1980.
May mean precipitation in Germany [mm]

To put it briefly: quite a bit of “fluctuation” with no clear trend. Interestingly, between 2005 and 2015 there was a slight upward “spike”: apparently by chance, there was a cluster of “wet May months”.
What can be seen in the temperatures is a ‘climate effect’, quite robust, although it has been stagnating in May for about 20 years, despite the record set in 2018. For spring as a whole, no trend stagnation is apparent.
With the best will in the world, nothing of the sort can be detected in the precipitation. It could become more variable in May; the wild ‘spikes’ after 2000 perhaps suggest as much, when compared with the years before 1980. Overall, May 2026 was completely normal in terms of precipitation. Any current ‘drought fantasies’ (we reported on these) are entirely misplaced and not evidence-based. The same applies to the spring as a whole:
Spring mean precipitation in Germany [mm]

Summary
Although it was not particularly wet (127.1 l), this is by no means exceptional. A total of 14 of the 100 previous springs were drier, six of which occurred before 1980. These data also show no climate trend, only a great deal of natural variability.
“Germany’s Longterm Spring Climate Data Show “No Climate Trend””
No, the article doesn’t say that. Quite the contrary. It does say something similar right at the end, clearly referring to rain. But for temperature, it is definite:
“In terms of temperatures, 14 of the previous 100 Mays were warmer than May 2026, with 2018 taking the top spot at 16 °C. There is a clear warming trend; only three Mays were warmer before 1980 “
“Here, the trend is even clearer after 1980, with temperatures rising by around 2 °C since then. At 9.9 °C, 2026 is 1 degree cooler than the warmest spring on record (2024), and there have been a total of six warmer springs, none of which occurred before 1980.“
“A lot of weather (as is usual for individual months), yet the trend is still clear. Spring as a whole (averages for March, April, May:
[diagram]
Here, the trend is even clearer after 1980, with temperatures rising by around 2 °C since “
Could not be clearer. The trend is warming.
“Here, the trend is even clearer after 1980, with temperatures rising by around 2 °C since “
2C in less than 50 years?
Wow…
I am the author of the article and the headline makes me wonder too.
The question you failed to answer is why did the trend to warmer start in 1980. I have posted the same in a previous thread that shows the same start in 1980 in England. Here are two graphs I have posted for states in the U.S. that show the same thing. Tavg started a consistent warming trend in 1980. Why don’t you try addressing the reason for that.
So in Germany temperatures have risen over 2°C. Has Germany tipped into Climate Armageddon? Or has trying to fight the ever changing climate done more irreversible damage to industry, energy sovereignty and energy reliability?
I mean Dunkelflauten (Dark wind lulls/dark-doldrums) didn’t exist prior to 2014 as a problem to energy generation.
Coal cares not about Wind or Sun or lack thereofGas cares not about Wind or Sun or lack thereofNuclear cares not about Wind or Sun or lack thereofEven Hydro cares not about Wind or Sun or lack thereof
Only Wind and Sun refuse to function every time nature fails to deliver their preferred fuel…When the Wind isn’t perfect or at night when 100% of Solar is uselessSolar is even useless when the sun is still up approaching evening peak.
No kiddin’ Nick, or would you prefer me to address you as Einstein?
Could not be clearer. The trend is warming.
Yes, this is what the piece says. The headline is just wrong. Don’t know why people are so upset to have this pointed out.
On the subject of Spring temperatures, I have noticed the Arctic temperatures have been well below normal for May, and likely to continue into June.
Whereas temperatures remained significantly above average on every day from January through April:
https://ocean.dmi.dk/arctic/meant80n.uk.php
That graph says it ranges from minus 30C to zero C.
So below freezing nearly all the year round.
Here’s the current DMI chart of Arctic Temperatures with 1958-2002 mean.
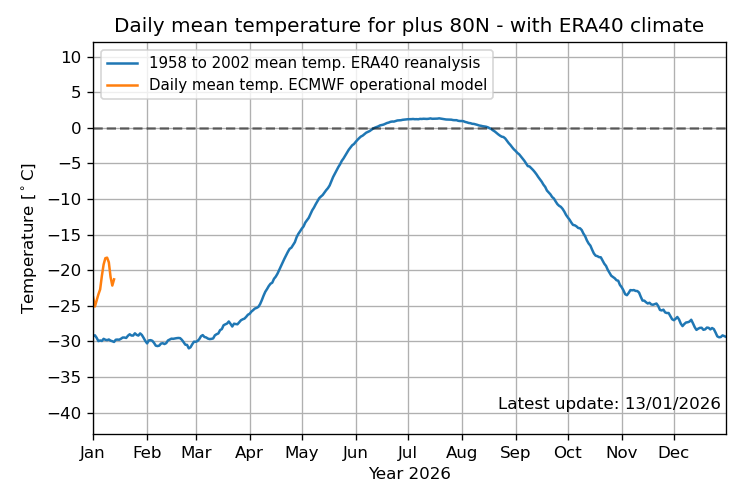
Yes this is true, but the sea Ice melt season is very short, and If this trend for lower temperatures continues, It will be even shorter.
Meanwhile in the UK the last three springs have been the warmest on record.
And from “pristine”sites. 😉
Or no sites at all
Yes, we can’t discount those nonexistent sites…it might hurt their homogenized feelings
To be clear about the non-existent sites. I think the Met Office does two different things.
1) It reports day to day temperatures and gives forecasts. These are often from sites which no longer exist, or are based on estimates from sites a long way away from the location reported.
To some extent this is legitimate, people want forecasts for where they are, and they are interested in the temps where they are. So this is sort of legit if they were clearer about what they are doing.
2) It would not be legit if used for climate trend purposes, but it seems not to be. The climate trends are based on real sites. The quality and continuity of these is an issue, but I think they do exist.
The other thing the Met Office does is hunt around for stations which show the highest readings and then supply them to the press. And needless to say the stations picked are, if its wind, in the windiest places in the UK. If its summer temps its usually at an airfield or at Heathrow or Kew Gardens. These high readings are then proclaimed by the media as warmest ever, or windiest ever, with the implication that we are seeing dreadful global warming happening in the UK and therefore the UK should get on with Net Zero as fast as possible.
This last is just the collective hysteria that has gripped the UK establishment in recent years. There is no way that readings in the high thirties at Kew or Heathrow can have any bearing on Net Zero. The attempt to move the country to wind and solar is an idiocy no matter what the temps recorded there are. No matter what that RAF site in East Anglia records either. And no matter what some clifftop wind station has recorded this week.
Meanwhile in the UK the last three springs have been the warmest on record.
I’ll ask you the same question I asked Nick Stokes, why did the warming trend begin in 1980? Did CO2 concentration jump dramatically starting in 1980? If not, what caused the warming trend? Was it anthropogenic in cause?
I think the orthodox answer would be something like this: there has been a warming effect from rising emissions, and there is an underlying cyclical trend which, absent the emissions, would just go up and down with no rising trend. But with the warming from emissions superimposed on it, this gives the rising trend you see in the chart.
I don’t find this very convincing, you would have to show the magnitude of the supposed AGW large enough to account for this movement from a static trend, but I think that is what the argument would be.
The key issue to me is not so much the trend, or is it warming, Its the policy issue. This kind of material is used to justify a UK Net Zero (and similar measures in other countries). But it doesn’t. A UK Net Zero, even a US Net Zero will have absolutely no effect on this and will wreck (and is wrecking) the economy, produce nothing but fuel poverty and unreliable electricity
Meanwhile in the UK the last three springs have been the warmest on record.
That is indeed what the chart shows. And the chart also shows a spring that was very warm in absolute terms. And yet, if you talk to people who live in the UK, what you hear, or at least what I hear, is that there were two or three exceptionally warm days, and the rest of the time it has been an unpleasantly cool spring, and is starting out as an unpleasantly cool summer.
Jim Gorman asks the other question that the graph raises, suppose it to be right, what caused the rise in the eighties of the last century? It looks a little similar to that of the thirties, but is much more pronounced.
“if you talk to people who live in the UK, what you hear, or at least what I hear, is that there were two or three exceptionally warm days, and the rest of the time it has been an unpleasantly cool spring,”
That’s not my experience. Maybe your people are only remembering May which did have a below average patch, before a lengthy heatwave with a couple of very hot days. But March and April were warm and sunny pretty much throughout.
The May temperature graph show a pretty clear upward trend. Not sure why/how this can be denied. The climate changes – and with it the weather – this should not be controversial.
The key issues surely are – is the change in climate rapid enough to disrupt and what are the correct policy/cost options.
The key issue is why did it start in 1980. What happened in 1980 that would affect both Germany, the UK, and places in the U.S., among other places?
I’m not a big fan of subdividing your data into ever smaller units.
The climate is cyclical: It warms for a few decades and then it cools for a few decades, and the pattern repeats.
We just happen to be living in the warming part of the cycle currently.
Hockey Stickitis causes people to forget about cycles.
It is a challenge to cycle while you’re twirling a hockey-stick around though 🙂
But it’s easy to do the Side-Step while twirling one
Ooh, I love to dance a little sidestep
Now they see me, now they don’t, I’ve come and gone and
Ooh, I love to sweep around the wide step
Cut a little swathe and lead the people on