Pro: Land temperature records clearly demonstrate the influence of humans on warming the climate climate from preindustrial times
From NASA Earth Observatory
The world is getting warmer. Thermometer readings around the world have been rising since the Industrial Revolution, and the causes are a blend of human activity and some natural variability—with the preponderance of evidence saying humans are mostly responsible.
According to an ongoing temperature analysis conducted by scientists at NASA’s Goddard Institute for Space Studies (GISS), the average global temperature on Earth has increased by a little more than 1° Celsius (2° Fahrenheit) since 1880. Two-thirds of the warming has occurred since 1975, at a rate of roughly 0.15-0.20°C per decade.
But why should we care about one degree of warming? After all, temperatures fluctuate by many degrees every day where we live.
The global temperature record represents an average over the entire surface of the planet. The temperatures we experience locally and in short periods can fluctuate significantly due to predictable cyclical events (night and day, summer and winter) and hard-to-predict wind and precipitation patterns. But the global temperature mainly depends on how much energy the planet receives from the Sun and how much it radiates back into space—quantities that change very little. The amount of energy radiated by the Earth depends significantly on the chemical composition of the atmosphere, particularly the amount of heat-trapping greenhouse gases.
A one-degree global change is significant because it takes a vast amount of heat to warm all the oceans, atmosphere, and land by that much. In the past, a one- to two-degree drop was all it took to plunge the Earth into the Little Ice Age. A five-degree drop was enough to bury a large part of North America under a towering mass of ice 20,000 years ago.
The maps above show temperature anomalies, or changes, not absolute temperature. They depict how much various regions of the world have warmed or cooled when compared with a base period of 1951-1980. (The global mean surface air temperature for that period was estimated to be 14°C (57°F), with an uncertainty of several tenths of a degree.) In other words, the maps show how much warmer or colder a region is compared to the norm for that region from 1951-1980.
Global temperature records start around 1880 because observations did not sufficiently cover enough of the planet prior to that time. The period of 1951-1980 was chosen largely because the U.S. National Weather Service uses a three-decade period to define “normal” or average temperature. The GISS temperature analysis effort began around 1980, so the most recent 30 years was 1951-1980. It is also a period when many of today’s adults grew up, so it is a common reference that many people can remember.
The line plot below shows yearly temperature anomalies from 1880 to 2019 as recorded by NASA, NOAA, the Berkeley Earth research group, the Met Office Hadley Centre (United Kingdom), and the Cowtan and Way analysis. Though there are minor variations from year to year, all five records show peaks and valleys in sync with each other. All show rapid warming in the past few decades, and all show the last decade as the warmest.
Source: https://earthobservatory.nasa.gov/world-of-change/global-temperatures

Con: Earth has been emerging from a period known as the Little Ice Age as long as we’ve been measuring temperatures
From ENVIRONMENTAL HISTORY RESOURCES
The Little Ice Age was a period of regionally cold conditions between roughly AD 1300 and 1850. The term “Little Ice Age” is somewhat questionable, because there was no single, well-defined period of prolonged cold. There were two phases of the Little Ice Age, the first beginning around 1290 and continuing until the late 1400s. There was a slightly warmer period in the 1500s, after which the climate deteriorated substantially, with the coldest period between 1645 and 1715 . During this coldest phase of the Little Ice Age there are indications that average winter temperatures in Europe and North America were as much as 2°C lower than at present.
There is substantial historical evidence for the Little Ice Age. The Baltic Sea froze over, as did many of the rivers and lakes in Europe. Pack ice expanded far south into the Atlantic making shipping to Iceland and Greenland impossible for months on end. Winters were bitterly cold and summers were often cool and wet. These conditions led to widespread crop failure, famine, and population decline. The tree line and snowline dropped and glaciers advanced, overrunning towns and farms in the process. There were increased levels of social unrest as large portions of the population were reduced to starvation and poverty.
Marginal regions
During the height of the Little Ice Age , it was in general about one degree Celsius colder than at present. The Baltic Sea froze over, as did most of the rivers in Europe. Winters were bitterly cold and prolonged, reducing the growing season by several weeks. These conditions led to widespread crop failure, famine, and in some regions population decline.
The prices of grain increased and wine became difficult to produce in many areas and commercial vineyards vanished in England. Fishing in northern Europe was also badly affected as cod migrated south to find warmer water. Storminess and flooding increased and in mountainous regions the treeline and snowline dropped. In addition glaciers advanced in the Alps and Northern Europe, overrunning towns and farms in the process.
Iceland was one of the hardest hit areas. Sea ice, which today is far to the north, came down around Iceland. In some years, it was difficult to bring a ship ashore anywhere along the coast. Grain became impossible to grow and even hay crops failed. Volcanic eruptions made life even harder. Iceland lost half of its population during the Little Ice Age.

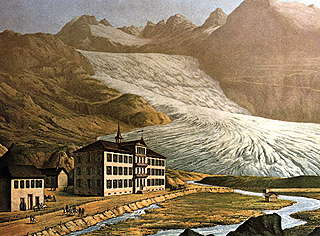
Tax records in Scandinavia show many farms were destroyed by advancing ice of glaciers and by melt water streams. Travellers in Scotland reported permanent snow cover over the Cairngorm Mountains in Scotland at an altitude of about 1200 metres. In the Alps, the glaciers advanced and threatened to bulldozed towns. Ice-dammed lakes burst periodically, destroying hundreds of buildings and killing many people. As late as 1930 the French Government commissioned a report to investigate the threat of the glaciers.
Let’s take another look at that graphic from NASA this time noting the end of the Little Ice Age.

Our direct temperature measurements with thermometers and recording stations clearly began at the same time the Little Ice Age ended. This accidental “cherry-picking” of a start point makes it difficult to establish that any temperature pattern we have observed is man-made versus simply being an indicator of what the Earth was doing in its natural variation.
You must be logged in to post a comment.