Arctic Oscillation (AO)
Northern Hemisphere – 500-hPa/mb Height Anomalies – Prior 30 Days
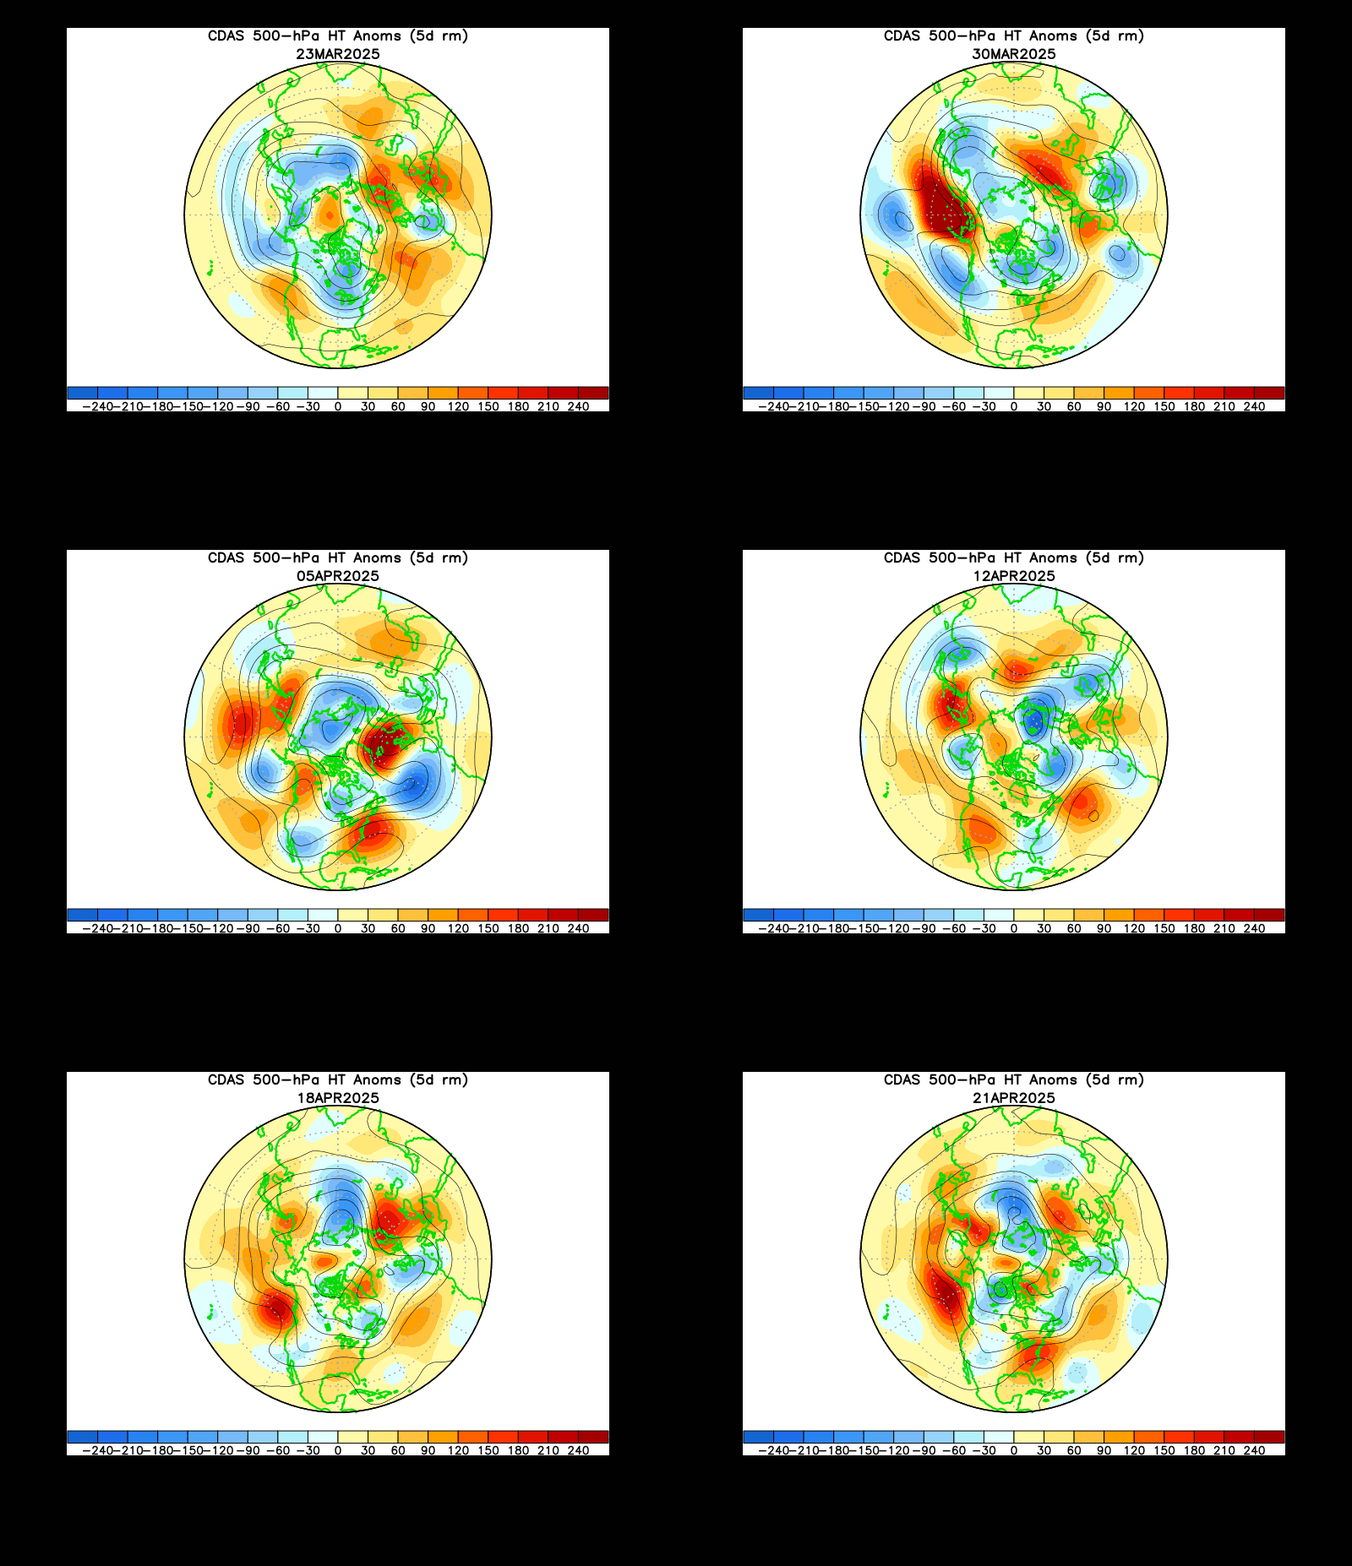
NOAA – National Weather Service – Climate Prediction Center – Click the pic to view at source
Northern Hemisphere – 500-hPa/mb Height 90-Day Mean & Anomalies

NOAA Physical Sciences Laboratory (PSL) – Click the pic to view at source
Normalized Geopotential Height (GPH) Anomaly & Arctic Oscillation (AO) Index – 4 Months Prior
▶ NOAA Climate Prediction Center – current data
Arctic Oscillation (AO) Index – 4 Months Prior
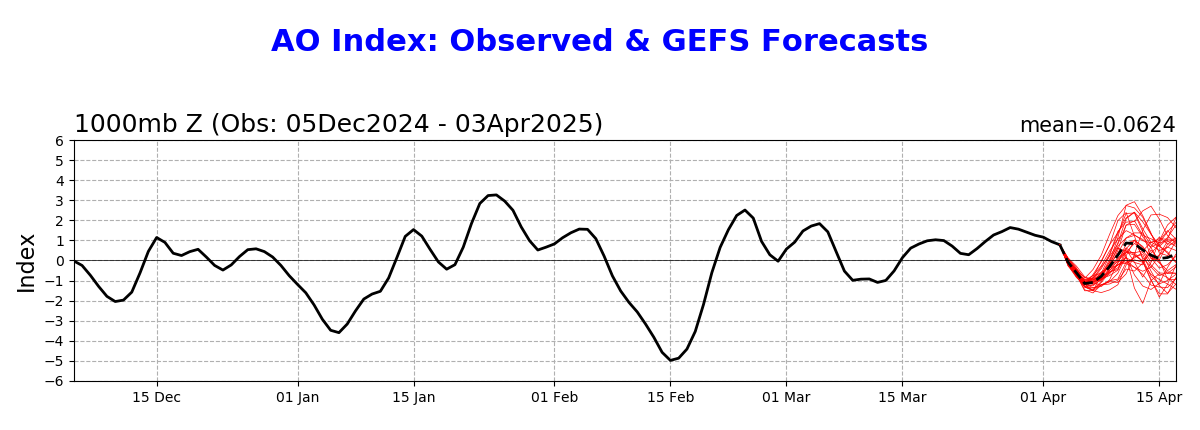
NOAA – National Weather Service – Climate Prediction Center – Click the pic to view at source
Arctic Oscillation (AO) Index – Monthly, 1950 to Present
▶ CPC – Daily AO Index Monitoring Page (charts and data)
Standardized Seasonal Mean Arctic Oscillation (AO) Index – 1950 to Present
▶ NOAA Climate Prediction Center – current data
Antarctic Oscillation (AAO)
Southern Hemisphere – 500-hPa/mb Height Anomalies – Prior 30 Days

NOAA – National Weather Service – Climate Prediction Center – Click the pic to view at source
Normalized Geopotential Height (GPH) Anomaly & Antarctic Oscillation (AAO) Index – 4 Months Prior
▶ NOAA Climate Prediction Center – current data
Observed & Forecast Antarctic Oscillation (AAO) Index – 4 Months Prior & 2 Weeks Forward

NOAA – National Weather Service – Climate Prediction Center – Click the pic to view at source
Antarctic Oscillation (AAO) Index – Monthly, 1979 to Present
Global Atmospheric Pressure Anomalies
Global – 200-hPa/mb Height Anomalies – ~12,000 m (40,000 ft)
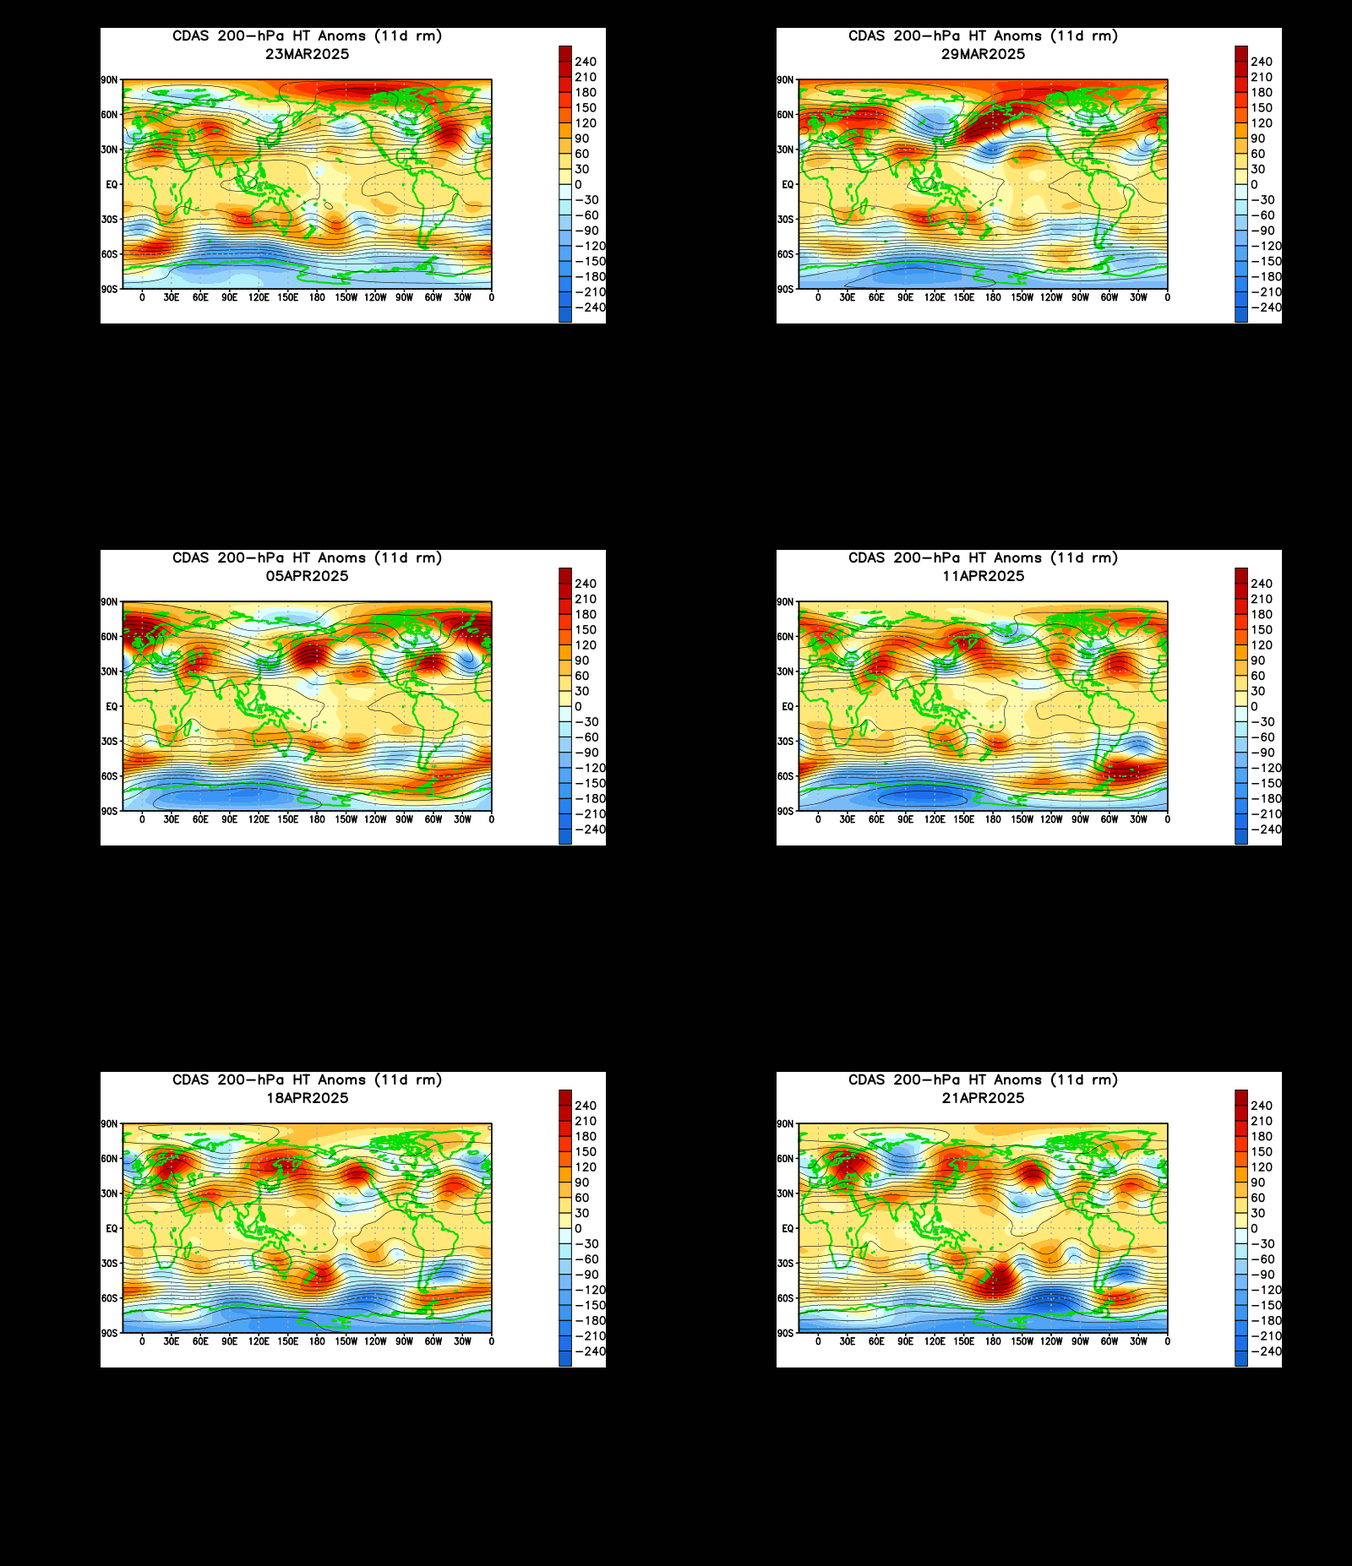
NOAA – National Weather Service – Climate Prediction Center – Click the pic to view at source
North Atlantic Oscillation (NAO)
North Atlantic Oscillation (NAO) Composite Pattern
▶ NOAA Physical Sciences Laboratory – current data
North Atlantic Oscillation (NAO) Index – 4 Months Prior & 2-Week Ensemble Forecast
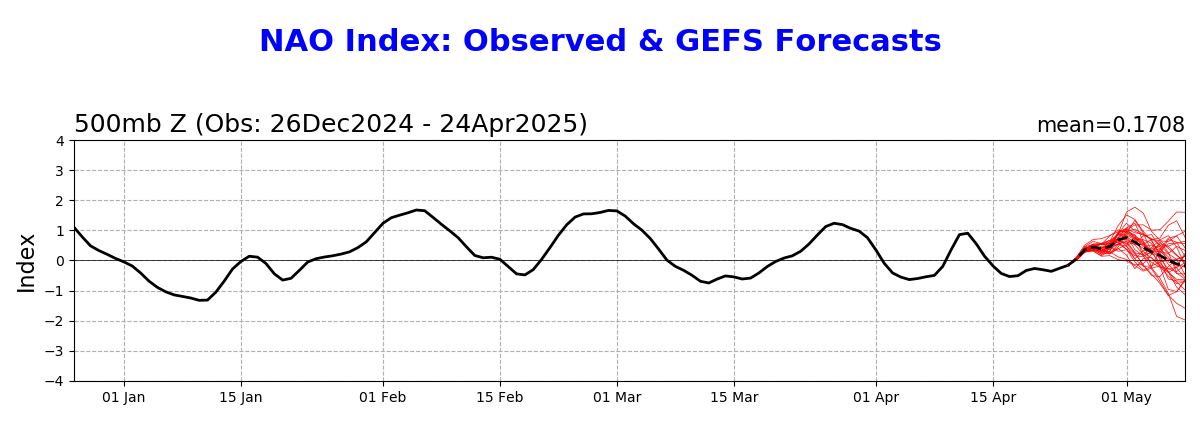
NOAA Physical Sciences Laboratory (PSL) – Reforecast2 – Click the pic to view at source
North Atlantic Oscillation (NAO) Index – Monthly, 1950 to Present
More NAO data:
▶ CPC – NAO Monitoring Page
▶ NOAA NCEI – North Atlantic Oscillation
Southern Oscillation Index (SOI)
Southern Oscillation Index (SOI) – Monthly, 1951 to Present
More SOI data:
▶ CPC – Southern Oscillation Index Monitoring
▶ NOAA NCEI – Southern Oscillation Index
Southern Oscillation Index (SOI) – 1882 to Present

The Royal Netherlands Meteorological Institute (KNMI) – Climate Explorer – Click the pic to view at source
For more detailed ENSO information visit the WUWT ENSO (El Niño/La Niña Southern Oscillation) Page
Pacific/North American (PNA) Index
Pacific/North American (PNA) Composite Pattern
▶ NOAA Physical Sciences Laboratory – current data
Pacific/North American (PNA) Index – 13-Day Ensemble Forecast
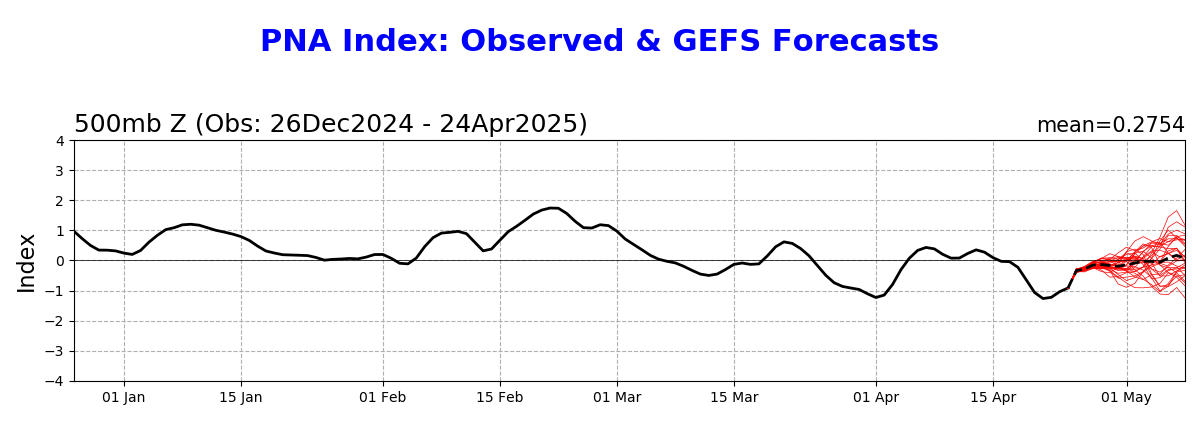
NOAA Physical Sciences Laboratory (PSL) – Reforecast2 – Click the pic to view at source
Pacific/North American (PNA) Index – Monthly, 1950 to Present
More PNA data:
▶ CPC – PNA Monitoring Page
▶ NOAA NCEI – Pacific-North American Index
East Pacific – North Pacific Pattern
East Pacific Oscillation (EPO) Composite Pattern
▶ NOAA Physical Sciences Laboratory – current data
East Pacific Oscillation (EPO) Index – 13-Day Ensemble Forecast
▶ NOAA Physical Sciences Laboratory – current data
Standardized 3-Month Running Mean East Pacific – North Pacific Pattern Index – 1950 to Present
▶ NOAA Climate Prediction Center – current data
West Pacific Pattern
West Pacific Oscillation (WPO) Composite Pattern
▶ NOAA Physical Sciences Laboratory – current data
West Pacific Oscillation (WPO) Index – 13-Day Ensemble Forecast
▶ NOAA Physical Sciences Laboratory – current data
Standardized 3-Month Running Mean West Pacific Pattern Index – 1950 to Present
▶ NOAA Climate Prediction Center – current data
Pacific Transition Pattern
Standardized Monthly Pacific Transition Pattern Index – 1950 to Present
▶ NOAA Climate Prediction Center – current data
Tropical / Northern Hemisphere Pattern
Standardized 3-Month Running Mean Tropical/Northern Hemisphere Pattern Index – 1950 to Present
▶ NOAA Climate Prediction Center – current data
Polar Eurasian Pattern
Standardized 3-Month Running Mean Polar Eurasian Pattern Index – 1950 to Present
▶ NOAA Climate Prediction Center – current data
Scandinavian Pattern
Standardized 3-Month Running Mean Scandinavian Pattern Index – 1950 to Present
▶ NOAA Climate Prediction Center – current data
Blocking
Northern Hemisphere 500 hPa Geopotential Height and Anomalies – Daily
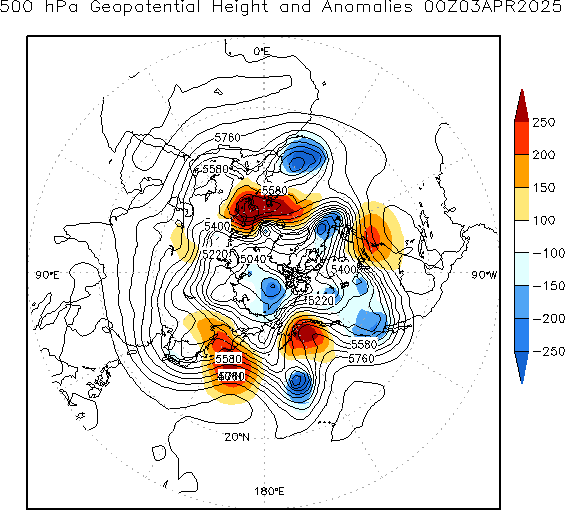
NOAA – National Weather Service – Climate Prediction Center – Click the pic to view at source
Northern Hemisphere Atmospheric Blocking Strength – 500 hPa GHGN – Prior 3 Months
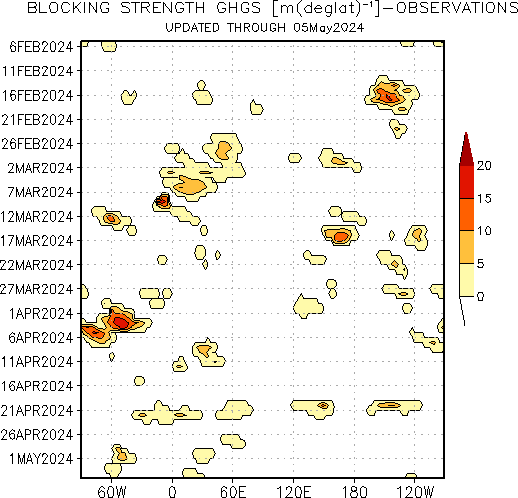
NOAA – National Weather Service – Climate Prediction Center – Click the pic to view at source
Northern Hemisphere Atmospheric Blocking Strength – 500 hPa GHGN – Prior 3 Months & 2-Week Forecast

NOAA – National Weather Service – Climate Prediction Center – Click the pic to view at source
Southern Hemisphere 500 hPa Geopotential Height and Anomalies – Daily
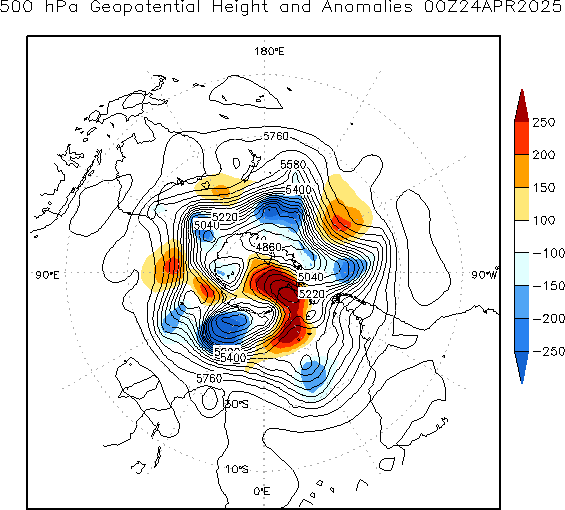
NOAA – National Weather Service – Climate Prediction Center – Click the pic to view at source
Southern Hemisphere Atmospheric Blocking Strength – 500 hPa GHGN – Prior 3 Months
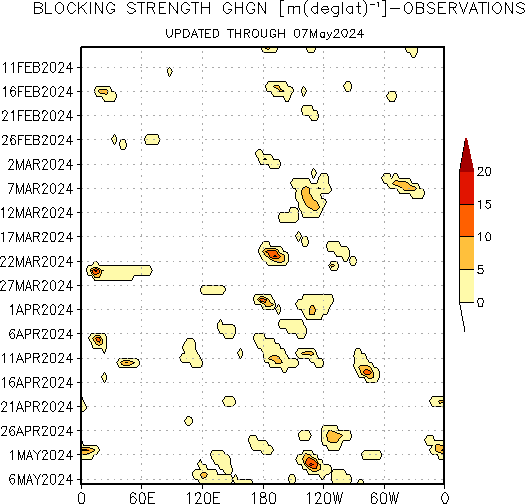
NOAA – National Weather Service – Climate Prediction Center – Click the pic to view at source
Southern Hemisphere Atmospheric Blocking Strength – 500 hPa GHGN – Prior 3 Months & 2-Week Forecast

NOAA – National Weather Service – Climate Prediction Center – Click the pic to view at source
Outgoing Longwave Radiation (OLR)
Outgoing Longwave Radiation (OLR) – Daily
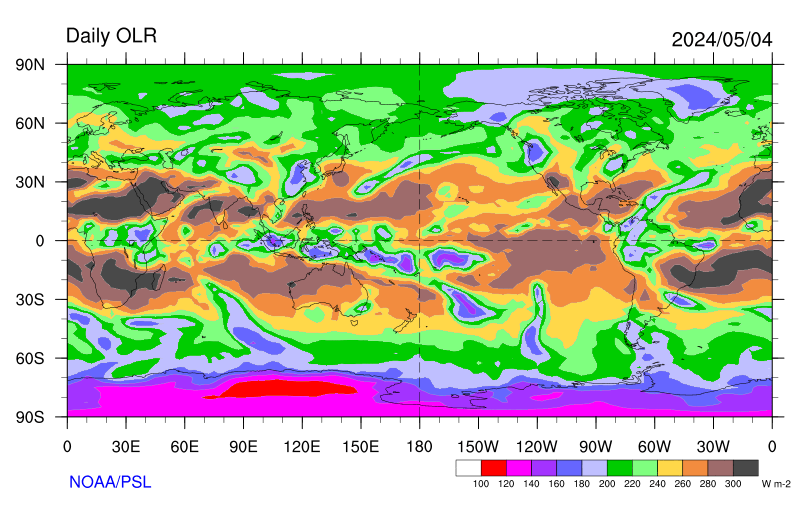
NOAA Physical Sciences Laboratory (PSL) – Click the pic to view at source
Outgoing Longwave Radiation (OLR) Anomalies – Daily
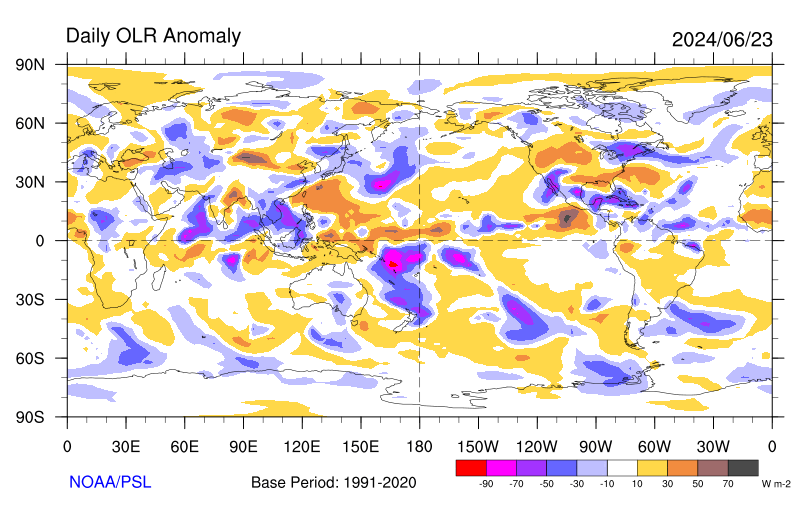
NOAA Physical Sciences Laboratory (PSL) – Click the pic to view at source
Outgoing Longwave Radiation (OLR) and OLR Anomalies – Prior Year

climate4you.com – Ole Humlum – Click the pic to view at source
Standardized Outgoing Longwave Radiation (OLR) Anomalies – 2000 to Present & 1975 to Present
▶ NOAA PSL – OLR Maps and Climatology
Madden–Julian Oscillation (MJO)
Madden–Julian Oscillation (MJO) – 15-Day Ensemble Forecast

NOAA – National Weather Service – Climate Prediction Center – Click the pic to view at source
Madden–Julian Oscillation (MJO) 2-Meter Temperature Composites – Daily
▶ NOAA Physical Sciences Laboratory – current data
Madden–Julian Oscillation (MJO) Index – Daily
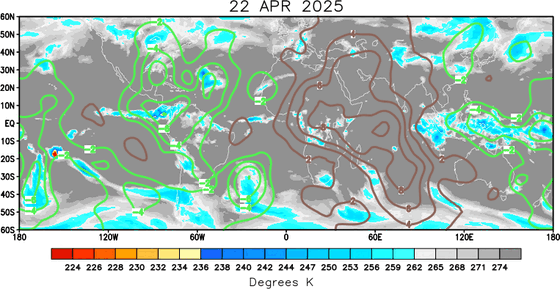
NOAA – National Weather Service – Climate Prediction Center – Click the pic to view at source
Madden–Julian Oscillation (MJO) Phase Diagram – 40 Days

NOAA – National Weather Service – Climate Prediction Center – Click the pic to view at source
5-Day Running Mean MJO Index – 6 Months
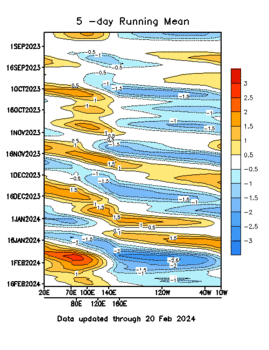
NOAA – National Weather Service – Climate Prediction Center – Click the pic to view at source
Madden–Julian Oscillation (MJO) OLR Hovmöller – 6 Months

NOAA – National Weather Service – Climate Prediction Center – Click the pic to view at source
15-Day Running Mean MJO Index – 1 Year
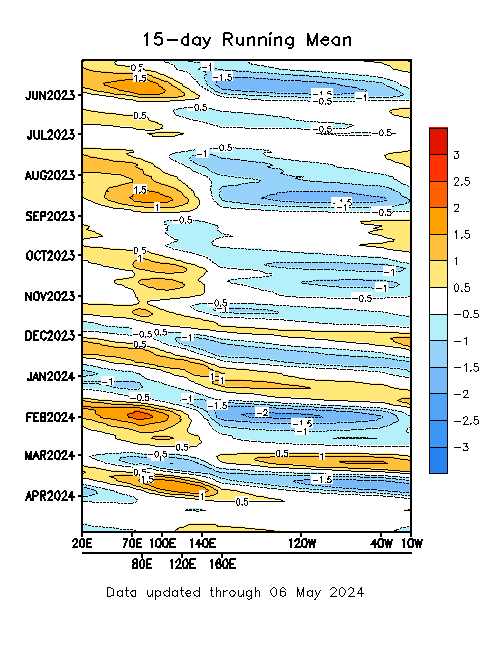
NOAA – National Weather Service – Climate Prediction Center – Click the pic to view at source
MJO Pentad Index at 120°E – Recent Years
Quasi-Biennial Oscillation (QBO)
Quasi-Biennial Oscillation (QBO) Index – Monthly
Total Explained Variance of Leading Modes
Total Explained Variance of Leading Modes – 1950 to Present
▶ NOAA Climate Prediction Center – current data
Calendar Months When Specific Teleconnection Patterns Are Important
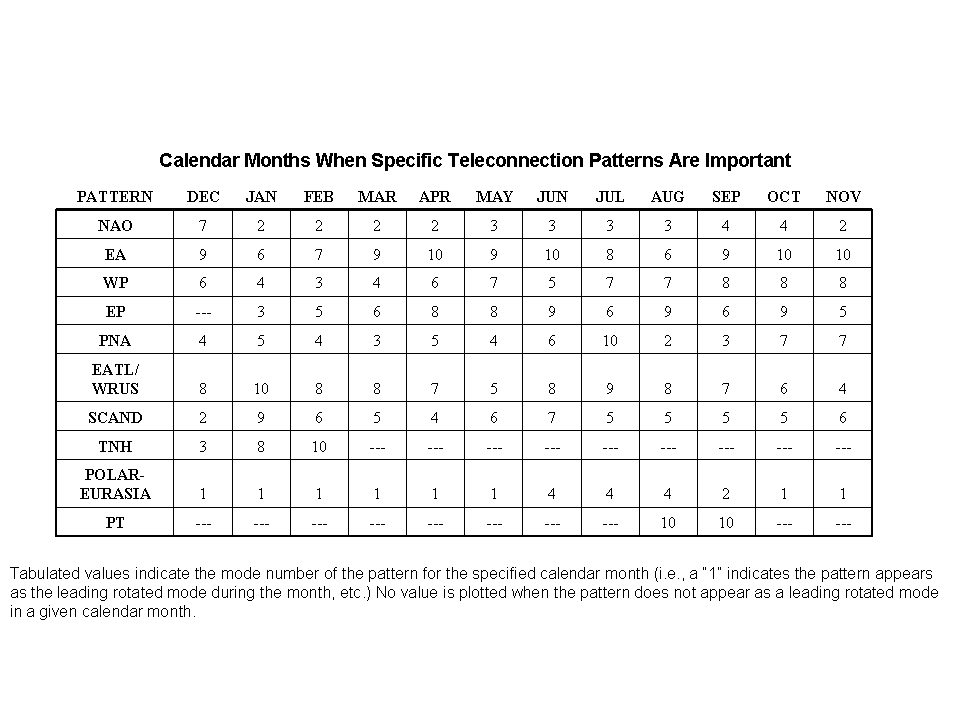
NOAA – National Weather Service – Climate Prediction Center – Click the pic to view at source
Source Guide
climate4you.com – Ole Humlum
Home Page – https://www.climate4you.com/
NOAA National Centers for Environmental Information (NCEI) (formerly NCDC)
Home Page – https://www.ncei.noaa.gov/
Climate Monitoring – https://www.ncei.noaa.gov/access/monitoring/products/
NOAA Physical Sciences Laboratory (PSL) (formerly ESRL Physical Sciences Division)
Home Page – https://psl.noaa.gov/
Map Room – https://psl.noaa.gov/map/
OLR Products – https://psl.noaa.gov/map/clim/olr.shtml
Reforecast2 Teleconnections – https://psl.noaa.gov/forecasts/reforecast2/teleconn/
MJO – https://psl.noaa.gov/mjo/
NOAA National Weather Service – Climate Prediction Center (CPC)
Home Page – https://www.cpc.ncep.noaa.gov/
Teleconnections Page – https://www.cpc.ncep.noaa.gov/products/precip/CWlink/daily_ao_index/teleconnections.shtml
AO Monitoring – https://www.cpc.ncep.noaa.gov/products/precip/CWlink/daily_ao_index/ao.shtml
AAO Monitoring – https://www.cpc.ncep.noaa.gov/products/precip/CWlink/daily_ao_index/aao/aao.shtml
NAO Monitoring – https://www.cpc.ncep.noaa.gov/products/precip/CWlink/pna/nao.shtml
PNA Monitoring – https://www.cpc.ncep.noaa.gov/products/precip/CWlink/pna/pna.shtml
MJO Monitoring – https://www.cpc.ncep.noaa.gov/products/precip/CWlink/MJO/mjo.shtml
SOI – https://www.cpc.ncep.noaa.gov/products/precip/CWlink/MJO/enso.shtml
Atmospheric & SST Indices – https://www.cpc.ncep.noaa.gov/data/indices/
Teleconnection Patterns (Teledoc) – https://www.cpc.ncep.noaa.gov/data/teledoc/teleintro.shtml
Blocking – https://www.cpc.ncep.noaa.gov/products/precip/CWlink/blocking/index/index.nh.shtml
The Royal Netherlands Meteorological Institute (KNMI) – Climate Explorer
Home Page – https://www.knmi.nl/home
KNMI Climate Explorer – https://climexp.knmi.nl/start.cgi
StormSurf.com
Home Page – https://www.stormsurf.com/
Global Jet Stream – 250 mb Wind and Pressure Animation
SSEC / CIMSS – University of Wisconsin–Madison
SSEC Home – https://www.ssec.wisc.edu/
Global Satellite Composites – https://www.ssec.wisc.edu/data/comp/
CIMSS Home – https://cimss.ssec.wisc.edu/
ECMWF – European Centre for Medium-Range Weather Forecasts
Home Page – https://www.ecmwf.int/
Charts – https://charts.ecmwf.int/
IRI/LDEO Climate Data Library – Columbia University
Home Page – https://iridl.ldeo.columbia.edu/
Atmospheric Circulation – https://iridl.ldeo.columbia.edu/maproom/Global/Atm_Circulation/
500 hPa Height Anomaly – https://iridl.ldeo.columbia.edu/maproom/Global/Atm_Circulation/Monthly_Height_500hPa.html
Naval Research Laboratory (NRL) – Marine Meteorology Division
Home Page – https://www.nrlmry.navy.mil/
Link Tutorial: Atmospheric Oscillations – Teleconnections
Teleconnections include the Arctic Oscillation (AO), Antarctic Oscillation (AAO), North Atlantic Oscillation (NAO), North Pacific Oscillation (NPO), the Madden–Julian Oscillation (MJO), Equatorial Indian Ocean Oscillation (EQUINOO) and Southern Oscillation (SO).
The Arctic Oscillation (AO):
https://www.cpc.ncep.noaa.gov/products/precip/CWlink/daily_ao_index/ao.shtml
30-day NH polar circulation animation: https://www.cpc.ncep.noaa.gov/products/intraseasonal/z500_nh_anim.shtml
The Antarctic Oscillation (AAO):
https://www.cpc.ncep.noaa.gov/products/precip/CWlink/daily_ao_index/aao/aao.shtml
30-day SH polar circulation animation: https://www.cpc.ncep.noaa.gov/products/intraseasonal/z500_sh_anim.shtml
The North Atlantic Oscillation (NAO):
https://www.cpc.ncep.noaa.gov/products/precip/CWlink/pna/nao.shtml
The North Pacific Oscillation (NPO), closely associated with the Pacific Decadal Oscillation (PDO):
Wikipedia – North Pacific Oscillation
The Madden–Julian Oscillation (MJO):
https://www.cpc.ncep.noaa.gov/products/precip/CWlink/MJO/mjo.shtml
Wikipedia – Madden–Julian Oscillation
WUWT – The Madden–Julian Oscillation (Dec 2010)
The Equatorial Indian Ocean Oscillation (EQUINOO), closely associated with the Indian Ocean Dipole (IOD):
Wikipedia – Indian Ocean Dipole
The Southern Oscillation (SO), collectively referred to with El Niño/La Niña as ENSO:
https://www.cpc.ncep.noaa.gov/products/precip/CWlink/MJO/enso.shtml
Atmospheric Components:
Atmospheric Circulation:
Wikipedia – Atmospheric Circulation
Wikipedia – Earth Global Circulation diagram
Atmospheric Pressure:
Wikipedia – Atmospheric Pressure
Atmospheric Waves:
Wikipedia – Atmospheric Wave
Brewer-Dobson Circulation:
Wikipedia – Brewer-Dobson Circulation
Ekman Transport:
Wikipedia – Ekman Transport
Gravity Waves:
Wikipedia – Gravity Wave
Jet Stream:
Wikipedia – Jet Stream
Polar Vortex:
Wikipedia – Polar Vortex
Precipitation:
Wikipedia – Precipitation
Rossby Waves:
Wikipedia – Rossby Waves
Tornadoes:
Wikipedia – Tornado
Trade Winds:
Wikipedia – Trade Winds
Tropical Cyclones:
Wikipedia – Tropical Cyclone
Westerlies:
Wikipedia – Westerlies
Atmospheric Gravity Wave Summary:
Gravity Waves – Wikipedia – Gravity Wave
– On an air–sea interface: Wikipedia – Surface Wave
– Internal gravity waves / Inertial Waves: Wikipedia – Inertial Wave
Rossby Waves – Wikipedia – Rossby Waves
Geostrophic Currents – Wikipedia – Geostrophic Current
Geostrophic Wind – Wikipedia – Geostrophic Wind
Additional Resources:
Dr. Roy Spencer – UAH
Home Page – https://www.drroyspencer.com/
Latest Global Temperatures – https://www.drroyspencer.com/latest-global-temperatures/
NASA Earth Observations (NEO)
https://neo.gsfc.nasa.gov/
SSEC / CIMSS – University of Wisconsin–Madison
SSEC Home – https://www.ssec.wisc.edu/
Global Satellite Composites – https://www.ssec.wisc.edu/data/comp/
CIMSS Home – https://cimss.ssec.wisc.edu/
ECMWF – European Centre for Medium-Range Weather Forecasts
Home Page – https://www.ecmwf.int/
Charts – https://charts.ecmwf.int/
IRI/LDEO Climate Data Library – Columbia University
https://iridl.ldeo.columbia.edu/
Weather Models / Ryan Maue (formerly COAPS/FSU and policlimate.com)
https://weathermodels.com/
 wpDiscuz