Pro: Multiple Studies Confirm the Reliability
A recent study conducted by scientists at NOAA’s National Centers for Environmental Information found no evidence that the U.S. temperature trend is inflated by poor siting of stations that comprise the US Historical Climatology Network (USHCN).
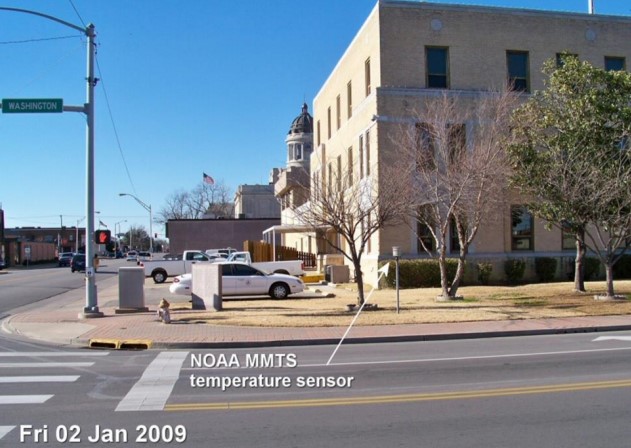
NCEI scientists conducted this study to determine the reliability of surface temperature trends over the conterminous U.S. (CONUS) following photographic documentation of poor siting conditions at USHCN stations.
A comparison of trends derived from poorly and well-sited USHCN stations indicates that there is a bias associated with poor exposure sites in the unadjusted USHCN version 2 data (relative to data from good exposure sites). However, this bias is consistent with previous studies documenting the impact of the widespread conversion to electronic sensors in the USHCN during the last 25 years because the majority of poor exposure sites were subject to this instrument change.
Of significant note, the sign of the bias is counterintuitive to photographic documentation of poor exposure because associated instrument changes led to an artificial negative (“cool”) bias in maximum temperatures and only a slight positive (“warm”) bias in minimum temperatures.
Adjustments largely account for the impact of instrument and siting changes but appear to leave a small overall residual negative (“cool”) bias in the adjusted USHCN version 2 CONUS average maximum temperature.
The adjusted USHCN CONUS temperatures are well aligned with recent measurements from NOAA’s U.S. Climate Reference Network (designed with the highest climate monitoring standards for siting and instrument exposure), thus providing independent evidence that the USHCN provides an accurate measure of the U.S. temperature.
The results of this study underscore the need to consider all changes in observation practice when determining the impacts of siting irregularities.
Information on the siting characteristics of USHCN stations and additional details on this study
These results are documented in: Menne, M.J., C.N. Williams, Jr., and M.A. Palecki, 2010: On the reliability of the U.S. surface temperature record. J. Geophys. Res. doi:10.1029/2009JD013094.https://www.ncdc.noaa.gov/monitoring-references/faq/temperature-monitoring.php
Con: Too Many Stations are Compromised And Not Maintained
A study in 2009 showed that almost 90% of weather stations used to measure climate in the USA have been compromised by urbanization effects. Some stations were in pristine rural condition years ago when first established, but now have become surrounded by asphalt, concrete, and builds which act as heat sinks, and energy sources such as air conditioner exhausts which raise local temperatures at night. Another 2015 study1 showed that almost half of the climate warming trend in the USA disappears if data from stations that have not been compromised is used.
As indicated in a 2009 study2, the majority of weather stations used by NOAA to detect the climate change temperature signal have been compromised by encroachment of artificial surfaces like concrete, asphalt, and heat sources like air conditioner exhausts.

This study demonstrates conclusively that this issue affects temperature trend and that NOAA’s methods are not correcting for this problem, resulting in an inflated temperature trend. It suggests that the trend for U.S. temperature will need to be corrected.
The United States temperature trends estimated from the relatively few stations in the classes with minimal artificial impact are found to be collectively about 2/3 as large as US trends estimated in the classes with greater expected artificial impact. The trend differences are largest for minimum temperatures and are statistically significant even at the regional scale and across different types of instrumentation and degrees of urbanization.

In 2019, a study by Oak Ridge Laboratory in Tennessee3 concluded that proximity to heat sinks such as builds and parking lots artificially warmed the air temperature recorded at a weather station, which vindicated the 2009 and 2015 studies.
A new report in 2022 is a follow up to a March 2009 study, titled “Is the U.S. Surface Temperature Record Reliable?” which highlighted a subset of over 1,000 surveyed stations and found 89 percent of stations had heat-bias issues. The 2022 report, Corrupted Climate Stations: The Official U.S. Surface Temperature Record Remains Fatally Flawed, finds approximately 96 percent of U.S. temperature stations used to measure climate change fail to meet what the National Oceanic and Atmospheric Administration (NOAA) considers to be “acceptable” and uncorrupted placement by its own published standards.
There is evidence of this same sort of siting problem around the world at many other official weather stations, suggesting that the same upward bias on trend also manifests itself in the global temperature record. Since the U.S. temperature record is thought to be “the best in the world,” it follows that the global database is likely similarly compromised and unreliable.
References:
- New study of NOAA’s U.S. Climate Network shows a lower 30-year temperature trend when high quality temperature stations unperturbed by urbanization are considered. American Geophysical Union, December 16, 2015. https://fallmeeting.agu.org/2015/press-item/new-study-of-noaas-u-s-climate-network-shows-a-lower-30-year-temperature-trend-when-high-quality-temperature-stations-unperturbed-by-urbanization-are-considered/
- Is the US Surface Temperature Record Reliable? https://www.heartland.org/_template-assets/documents/publications/SurfaceStations.pdf
- Impacts of Small-Scale Urban Encroachment on Air Temperature Observations. Ronald D. Leeper, John Kochendorfer, Timothy Henderson, and Michael A. Palecki, Journal of the American Meteorological Society, June 12, 2019. https://journals.ametsoc.org/doi/10.1175/JAMC-D-19-0002.1
- Corrupted Climate Stations: The Official U.S. Temperature Record Remains Fatally Flawed, the Heartland Institute, July 27, 2022, https://heartland.org/wp-content/uploads/documents/2022_Surface_Station_Report.pdf
You must be logged in to post a comment.