Go here and here for background information on Polar Vortices.
Polar Vortex Area
Southern Polar Vortex Area on a 450K Theta Surface:
→ View Southern Polar Vortex Area chart at NOAA CPC Stratosphere Monitoring
NOAA – National Weather Service – Climate Prediction Center
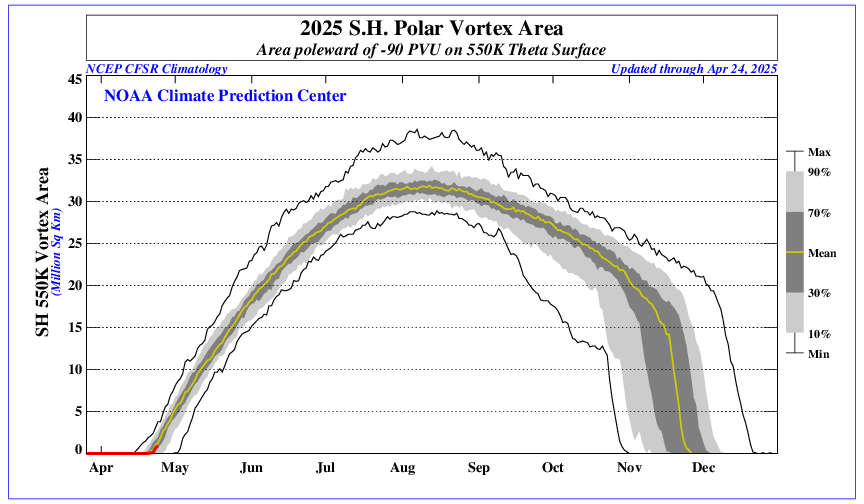
Click Here to view the Polar Vortex Area on a 550K Theta Surface
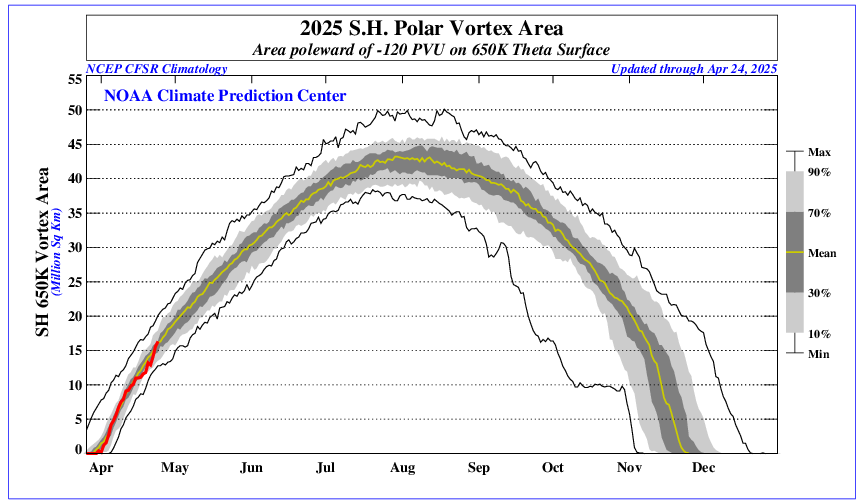
Click Here to view the Polar Vortex Area on a 650K Theta Surface
Wind
Southern Polar Wind – It is recommended that you click down through each height in succession to see polar vorticity with depth:
10 hPa/mb – Approximately 31,000 meters (101,700 feet) Wide and Focused Perspective
70 hPa/mb – Approximately 18,000 meters (59,000 feet) Wide and Focused Perspective
250 hPa/mb – Approximately 10,400 meters (34,000 feet) Wide and Focused Perspective
500 hPa/mb – Approximately 5,600 meters (18,000 feet) Wide and Focused Perspective
700 hPa/mb – Approximately 3,000 meters (10,000 feet) Wide and Focused Perspective
1000 hPa/mb – Approximates Mean Sea Level Wide and Focused Perspective
Northern Polar Wind – It is recommended that you click down through each height in succession to see polar vorticity with depth:
10 hPa/mb – Approximately 31,000 meters (101,700 feet) Wide and Focused Perspective
70 hPa/mb – Approximately 18,000 meters (59,000 feet) Wide and Focused Perspective
250 hPa/mb – Approximately 10,400 meters (34,000 feet) Wide and Focused Perspective
500 hPa/mb – Approximately 5,600 meters (18,000 feet) Wide and Focused Perspective
700 hPa/mb – Approximately 3,000 meters (10,000 feet) Wide and Focused Perspective
1000 hPa/mb – Approximates Mean Sea Level Wide and Focused Perspective
Temperature
Southern Hemisphere Temperature Area with Temperatures Colder than -78°C on 450K Theta Surface (Temperature below which Polar Stratospheric Clouds May Form):

NOAA – National Weather Service – Climate Prediction Center – Click the image to view at source
Southern Hemisphere Temperature Analysis at 10 hPa/mb – Approximately 31,000 meters (101,700 feet):

NOAA – National Weather Service – Climate Prediction Center – Click the image to view at source
Southern Hemisphere Temperature Analysis at 30 hPa/mb – Approximately 23,700 meters (77,800 feet):

NOAA – National Weather Service – Climate Prediction Center – Click the image to view at source
Southern Hemisphere Temperature Analysis at 50 hPa/mb – Approximately 20,100 meters (66,000 feet):

NOAA – National Weather Service – Climate Prediction Center – Click the image to view at source
Southern Hemisphere Temperature Analysis at 70 hPa/mb – Approximately 18,000 meters (59,000 feet):

NOAA – National Weather Service – Climate Prediction Center – Click the image to view at source
Southern Hemisphere Temperature Analysis at 100 hPa/mb – Approximately 15,000 meters (49,000 feet):

NOAA – National Weather Service – Climate Prediction Center – Click the image to view at source
Northern Hemisphere Temperature Analysis at 10 hPa/mb – Approximately 31,000 meters (101,700 feet):

NOAA – National Weather Service – Climate Prediction Center – Click the image to view at source
Northern Hemisphere Temperature Analysis at 30 hPa/mb – Approximately 23,700 meters (77,800 feet):

NOAA – National Weather Service – Climate Prediction Center – Click the image to view at source
Northern Hemisphere Temperature Analysis at 50 hPa/mb – Approximately 20,100 meters (66,000 feet):

NOAA – National Weather Service – Climate Prediction Center – Click the image to view at source
Northern Hemisphere Temperature Analysis at 70 hPa/mb – Approximately 18,000 meters (59,000 feet):

NOAA – National Weather Service – Climate Prediction Center – Click the image to view at source
Northern Hemisphere Temperature Analysis at 100 hPa/mb – Approximately 15,000 meters (49,213 feet):

NOAA – National Weather Service – Climate Prediction Center – Click the image to view at source
Southern Hemisphere Area Where Temperature is Below 195K or -78°C (Temperature below which Polar Stratospheric Clouds May Form):

NOAA – National Weather Service – Climate Prediction Center – Click the image to view at source
Northern Hemisphere Area Where Temperature is Below 195K or -78°C (Temperature below which Polar Stratospheric Clouds May Form):

NOAA – National Weather Service – Climate Prediction Center – Click the image to view at source
Southern Hemisphere Time vs. Pressure of Temperatures in Troposphere and Stratosphere (White Contour Outlines Indicate Area Below 195K or -78°C, where Polar Stratospheric Clouds may form):

NOAA – National Weather Service – Climate Prediction Center – Click the image to view at source
South Pole Ambient Temperature Profile (Ozonesonde):
NOAA Global Monitoring Laboratory ozonesonde temperature profiles for the South Pole station are updated regularly. View current South Pole ozonesonde data and plots at NOAA GML →
NOAA – Global Monitoring Laboratory (GML) – South Pole Atmospheric Observatory
Zonal Mean Temperatures at 50 hPa/mb – Temperature Anomalies (Atmospheric Temperature Anomalies at Approximately 20,100 meters / 66,000 feet):

NOAA – National Weather Service – Climate Prediction Center – Click the image to view at source
Global – 10 hPa/mb Height Temperature Anomalies – Atmospheric Temperature Anomalies at Approximately 31,000 meters (101,700 feet):

NOAA – National Weather Service – Climate Prediction Center – Click the image to view at source
Global – 30 hPa/mb Height Temperature Anomalies – Atmospheric Temperature Anomalies at Approximately 23,700 meters (77,800 feet):

NOAA – National Weather Service – Climate Prediction Center – Click the image to view at source
Global – 50 hPa/mb Height Temperature Anomalies – Atmospheric Temperature Anomalies at Approximately 20,100 meters (66,000 feet):

NOAA – National Weather Service – Climate Prediction Center – Click the image to view at source
Global, Southern Polar & Northern Polar Temperature Lower Stratosphere (TLS) – 1979 to Present:
RSS/AMSU lower stratosphere temperature time series are available via the RSS interactive browser. Select Channel TLS (v4.0) and the desired Region (Global, South Polar, or North Polar) to view current data.
→ Open RSS MSU/AMSU Time Series Browser
Remote Sensing Systems (RSS) – Microwave Sounding Units (MSU/AMSU) – Channel TLS v4.0
Geopotential Height and Vorticity
Global – 200 hPa/mb Height Anomalies – Atmospheric Pressure Anomalies at Approximately 12,000 meters (40,000 feet):

NOAA – National Weather Service – Climate Prediction Center – Click the image to view at source
Southern Hemisphere 500 hPa/mb Geopotential Height and Vorticity – Approximately 5,500 meters (18,000 feet):

Center for Ocean-Land-Atmosphere Studies (COLA) – Institute of Global Environment and Society (IGES) – Click the image to view at source
Southern Hemisphere – 500 hPa/mb Height Anomalies – Atmospheric Pressure Anomalies at Approximately 5,500 meters (18,000 feet):

NOAA – National Weather Service – Climate Prediction Center – Click the image to view at source
Southern Hemisphere – Vertical Cross Section of Geopotential Height Anomalies (Polar Vortex):

NOAA – National Weather Service – Climate Prediction Center – Click the image to view at source
Northern Hemisphere 500 hPa/mb Geopotential Height and Vorticity – Approximately 5,500 meters (18,000 feet):

Center for Ocean-Land-Atmosphere Studies (COLA) – Institute of Global Environment and Society (IGES) – Click the image to view at source
Northern Hemisphere – 500 hPa/mb Height Anomalies – Atmospheric Pressure Anomalies at Approximately 5,500 meters (18,000 feet):

NOAA – National Weather Service – Climate Prediction Center – Click the image to view at source
Northern Hemisphere – Vertical Cross Section of Geopotential Height Anomalies (Polar Vortex):

NOAA – National Weather Service – Climate Prediction Center – Click the image to view at source
“Ozone Hole”
Southern Hemisphere “Ozone Hole” Area:
The CPC ozone hole area plot blocks direct image embedding. View the Southern Hemisphere Ozone Hole Area chart directly at NOAA CPC Stratosphere Monitoring →
NOAA – National Weather Service – Climate Prediction Center
Southern “Ozone Hole” – 2026 Season Progress (Area, Minimum Ozone & Stratospheric Temperature):
 Annual Ozone Hole Area – Sep 7 to Oct 13 (PDF chart)
NASA – Goddard Space Flight Center – NASA Ozone Watch
South Pole Ozonesondes – 12–20 km Column Ozone:


NOAA – National Weather Service – Climate Prediction Center – Click the image to view at source
Northern Hemisphere Total Ozone:

NOAA – National Weather Service – Climate Prediction Center – Click the image to view at source
Global Total Ozone:

NOAA – National Weather Service – Climate Prediction Center – Click the image to view at source
South Pole Ozone Mixing Ratio:
NOAA Global Monitoring Laboratory South Pole ozonesonde data including ozone mixing ratio profiles: View at NOAA GML →
NOAA – Global Monitoring Laboratory (GML)
Other Indicators
Eddy Heat Flux
10 Day Averaged Eddy Heat Flux Towards The South Pole at 100 mb:

NOAA – National Weather Service – Climate Prediction Center – Click the image to view at source
Wind Speed / Vectors
Northern Hemisphere 250 hPa/mb Heights and Wind Speeds – View an animated version of the graphic:

NOAA – Physical Sciences Laboratory (PSL) – Click the image to view at source
Source Guide
Center for Ocean-Land-Atmosphere Studies (COLA) – Institute of Global Environment and Society (IGES)
Home Page – https://wxmaps.org/pix.html
Height and Vorticity Analyses – https://wxmaps.org/pix/analyses.html
Hurricane Potential – https://wxmaps.org/pix/hurpot.html
Forecast Page – https://wxmaps.org/pix/forecasts.html
NOAA – Physical Sciences Laboratory (PSL) (formerly Earth System Research Laboratory / ESRL)
Home Page – https://psl.noaa.gov/
Products – https://psl.noaa.gov/products/
Data – https://psl.noaa.gov/data/
Maps – https://psl.noaa.gov/map/
NOAA – Global Monitoring Laboratory (GML) (formerly ESRL/GMD)
Home Page – https://gml.noaa.gov/
South Pole Ozonesonde Data – https://gml.noaa.gov/ozwv/ozsondes/spo.html
NOAA – National Centers for Environmental Information (NCEI) (formerly National Climatic Data Center / NCDC)
Home Page – https://www.ncei.noaa.gov/
Products – https://www.ncei.noaa.gov/products
NOAA – National Weather Service – Climate Prediction Center (CPC)
Home Page – https://www.cpc.ncep.noaa.gov/
Stratosphere Monitoring – https://www.cpc.ncep.noaa.gov/products/stratosphere/polar/polar.shtml
Atmospheric & SST Indices – https://www.cpc.ncep.noaa.gov/data/indices/
Regional Climate Maps – https://www.cpc.ncep.noaa.gov/products/analysis_monitoring/regional_monitoring/
NASA – Ozone Watch (Goddard Space Flight Center)
Home Page – https://ozonewatch.gsfc.nasa.gov/
Antarctic Ozone Meteorology – https://ozonewatch.gsfc.nasa.gov/meteorology/SH.html
Annual Statistics – https://ozonewatch.gsfc.nasa.gov/statistics/annual_data.html
Weather Models – Ryan Maue’s Weather Maps (NCEP GFS, NAM, and ECMWF)
https://weathermodels.com/
Remote Sensing Systems (RSS)
Home Page – https://www.remss.com/
Upper Air Temperature (MSU/AMSU) – https://www.remss.com/measurements/upper-air-temperature/
Time Series Browser – https://images.remss.com/msu/msu_time_series.html
StormSurf.com
Home Page – https://www.stormsurf.com/
Model Products – https://www.stormsurf.com/mdls/menu.html
Global Jet Stream Wind and 250 mb Pressure – https://www.stormsurfing.com/cgi/display_alt.cgi?a=glob_250
North Atlantic Surface Pressure and Wind – https://www.stormsurfing.com/cgi/display.cgi?a=natla_slp
I get the first sentence describing the polar vortex. I like all the pretty graphs. But, I have to say I only have 60 or so college hours of Sciences, Astronomy, and Geology and there are just not enough words in plane English to decipher what this is all about.
Also, I think there is a defect in the ozone discussion. Ozone has a typical life of 30 minutes before decaying into oxygen. Ozone is formed from sunlight interacting with Oxygen. Therefore, I think, Ozone does not exist in the stratosphere and above for longer than 30 minutes after sundown.
Feel free to offer clarification or corrections.
http://www.pa.op.dlr.de/arctic/index.html
I’ve been reading up on the affects of UV light on the stratosphere and the affect of cosmic rays (charged protons and nuclei on the troposphere). Apparently with lessened solar activity i.e. slacker solar wind the magnetic flux of the earth increases quite a bit. This increase in magnetic field lines allows many more charged particles to enter the troposphere especially at the poles. Experiments have shown that charged protons and nuclei excite gas molecules or whatever molecules they clash with. This in turn ionises these particles, but also has the affect of ionising much larger particles of dust, ice particles, sulfer particles etc. Particles with like charges tend to stay together, so my thinking is, within the atmosphere this can consolidate particles floating around in the atmosphere. These densely packed charged particles then can act as strong nuclei for water droplets to form increasing cloud cover on some parts of the earth i.e the polar and cool temperate regions.
Now this cloud cover has two affects. The first is that it acts as an insulator preventing heat from escaping into the stratosphere and into space. The second is that it acts as an insulator reflecting light away from land surfaces and dark oceans like the arctic ocean.
Simultaneously, with a reduction in solar activity, there is also a reduction in UV light. UV doesn’t really have an affect on the troposhere like cosmic rays have, but UV interacts strongly with gas molecules in the stratophere, creating ozone and releasing heat as it does so. Now if there is a reduction in the amount of UV light, a reduction in ozone production follows and a cooling in the stratosphere…..especially a low latitudes nearer the equator where the effect of the sun is greatest. The stratosphere here will cool off more quickly than at the arctic and shrink in volume.
Remember that the arctic receives little heat from the sun for much of the year, but there is a transfer and storage of heat from warmer waters from the tropics. Arctic waters are also very dark so they can absorb a lot of heat from relatively little sunshine. To summarise we have a warmer troposhere in the arctic with more cloud cover and a relatively cooler stratosphere further to the south.
Now normally frigid arctic air is usually contained in the arctic and a fairly strong polar vortex exists. However if the difference is troposheric temperatures between the arctic and lower latitudes is reduced and inversly the relative temperatures in the stratosphere over the artic and lower latitudes is increased, this can shift the formation of high pressure areas north into the north atlantic and pacific. Pressures tend to reduce south of this i.e azores, meditaranean areas. Once an area of high pressure with a cold top forms i.e from Greenland down over the north atlactic, it tends to feed up warmer air into the artic, which is pushed up over the relatively cold air in the arctic troposphere. Ofcourse it cools, but it forms a temperature inversion near the poles, creating an area of higher pressure. On the eastern side of the high pressure area out over the atlantic, the now relatively warmer, but frigid arctic air can escape easily, without the impediment of a strong polar vortex.
My thinking on all of this is that a combination of a warming arctic during increased solar activiy, followed by a cooling stratosphere because of lessened solar activity and increased cloud cover at high latitudes because of increased cosmic rays can weaken and expand the polar vortex. If the polar vortex is strong, it is contained more or less near the poles, but if it is weak it can become much larger, dragging the jet stream further south. Effectively this has the affect of cooling the climate of the earth. Simultaneously something similar would happen in the southern hemisphere.
If the sun were to enter a long period without much activity, i think the entire earth would evetually cool. Cold air would often spill out of the poles because of the effects i’ve just explained and cool the land masses and especially the oceans further south. An obvious affect would be on the North Atlantic Drift. This current is largely driven by wind. Remove the wind for long periods of time and you lessen the affects of the current on the climate. Another affect may be to slow down the thermohaline curculation in atlactic. If the surface of the North Atlantic were to cool substansially and possibly become less salty because of melting fresh water ice caps and increased rainlfall in the summer months, this overturning of water may stop for some time, until the sun became much more active again.
Hope you enjoy reading, and that it offers some insite into the physical mechanisms that ultimately dictate our weather patterns and climate.
One mistake :
Like. charged particles are _repelled_ by each other \
“Particles with like charges tend to stay together”
Particles with like charge avoid each other. It is important to understand that this repulsion can be overcome by two particles approaching each other above a certain critical speed, which is mass dependent. Two particles that bump into each other (meaning, contact) can stick together depending on what they are made of. This is an important aspect of agglomeration of air pollution particles. For example, if they are condensed volatiles, they are likely to be sticky and accumulate into a giant dendritic particle which may be composed of thousands of tiny spheres.
These actions and results have nothing to do with gas molecules save in very specific cases. An H2S molecule can turn into a cloud condensation nucleus and eventually create a rain drop.
Following from my earlier post on the 19th of December 2011, have a look at the CERN cloud chamber experiment. To search for it look for Jasper Kirkby on YouTube. It seems as though cloud nuclei can be formed from secondary particles, where cosmic rays have bombarded our atmosphere. However we havn’t been able to measure this in real time in the atmosphere, largely because we don’t yet have the technologoy to do so. My earlier explanation of how our atmoshere is working could probably do with refining, because i’m sure there are flaws in my explanation. Feel free to comment.
Interesting theorizing Edward. Complicated subject, still wide open as to what is going on it seems.
Thanks JustTheFacts, Very good reference page. Maybe a little bit more descriptive captions?
More graphics:
Northern Hemisphere Winds at 10 hPa: http://earth.nullschool.net/#current/wind/isobaric/10hPa/orthographic=-90.0,90.0
Southern Hemisphere Winds at 10 hPa: http://earth.nullschool.net/#current/wind/isobaric/10hPa/orthographic=-90.0,-90.0
Regarding “A Sober Look At The Northern Polar Vortex”
http://wattsupwiththat.com/2014/01/07/a-sober-look-at-the-northern-polar-vortex/
rgbatduke, Carla, justthefactswuwt, TB : Awakening from a stupor, I am too late to catch responses from the blog “A Sober Look At The Northern Polar Vortex”.
Do you FEEL that there is a gap between rigorous “standard modeling” of the polar vortices and their actual behaviour, apart from issues related to “chaotic behaviour”? I am assuming that comments on anomalies are refering to work that already accounts for Coriolis effects (which is standard). The geomagnetics and LOD comments are interesting, as perhaps somewhat related to my interests, but at a later time. “Coriolis accleration” itself happends to be an interesting historical example whereby a term was missing from classical analysis of mechanics (a hundred years or more ago – “… 1835 paper by French scientist Gaspard-Gustave Coriolis …” according to wikipedia), and I remember making the same mistake in courses I took several decades ago. I am interested in finding what MAY be manifestations of an analogous “missing chiral term” in electrodynamics. Bode’s law for planetary orbits, red shift quantization in astronomy, and some aspects of the behaviour of elementary particles (this latter one I am not at all comfortable that I am interpreting statements correctly), are some of the examples that have been suggested as manifesting this “chiral term”. After several years, I still have not found time to go step-by-step through the underlying electrodynamics, so I don’t want to lead people astray, and in the end there is a strong likelihood the ideas are flawed (albeit they “look” extremely well-founded, even if vehemently criticized, to me). But it strikes me that if there is something very anomalous about polar vortices, they may warrant (considerable!) effort to check.
I have perhaps 2 to 4 hours over the next 2 days to seek clarification of the “Polar Vortex” discussions. After that (and maybe before) I will be dragged off on other priorities. But perhaps there is something to pursue here over the long term, if and after I do some related “home hobby-project-work” that has long been sidelined. So please don’t spend to much time on responding – I was want a “gut feel” idea if you think something fundamental is missing from standard modeling (more importantly for me – standard physics implementations).
Bill Howell says: February 14, 2014 at 8:49 am
Do you FEEL that there is a gap between rigorous “standard modeling” of the polar vortices and their actual behaviour, apart from issues related to “chaotic behaviour”?
I don’t “FEEL that there is a gap”, we know that there’s a gap, only question is how big. As was cited in the article you linked to:
“Many atmospheric general circulation models (GCMs) and chemistry–climate models (CCMs) are not able to reproduce the observed polar stratospheric winds in simulations of the late 20th century. Specifically, the polar vortices break down too late and peak wind speeds are higher than in the ERA-40 reanalysis. Insufficient planetary wave driving during the October–November period delays the breakup of the southern hemisphere (SH) polar vortex in versions 1 (V1) and 2 (V2) of the Goddard Earth Observing System (GEOS) chemistry–climate model, and is likely the cause of the delayed breakup in other CCMs with similarly weak October-November wave driving.”
“In the V1 model, the delayed breakup of the Antarctic vortex biases temperature, circulation and trace gas concentrations in the polar stratosphere in spring. The V2 model behaves similarly (despite major model upgrades from V1), though the magnitudes of the anomalous effects on springtime dynamics are smaller.”
“Clearly, if CCMs cannot duplicate the observed response of the polar stratosphere to late 20th century climate forcings, their ability to simulate the polar vortices in future may be poor.”
Assessment and Consequences of the Delayed Breakup of the Antarctic Polar Vortex in Chemistry-Climate Models Hurwitz et al., 2009
“It is unclear how much confidence can be put into the model projections of the vortices given that the models typically only have moderate resolution and that the climatological structure of the vortices in the models depends on the tuning of gravity wave parameterizations.
Given the above outstanding issues, there is need for continued research in the dynamics of the vortices and their representation in global models.”
Stratospheric Polar Vortices, Waugh et al. 2010
I’d recommend also reading:
http://wattsupwiththat.com/2014/01/18/introducing-the-new-wuwt-northern-polar-vortex-page-with-explanation-and-observations/
http://wattsupwiththat.com/2014/02/01/a-displaced-polar-vortex-and-its-causes/
http://wattsupwiththat.com/2014/02/08/when-does-a-displaced-polar-vortex-becomes-a-split-vortex/#comment-1562964
the comments in the second one go into particular depth on causes of vortex variability.
I have perhaps 2 to 4 hours over the next 2 days to seek clarification of the “Polar Vortex” discussions. After that (and maybe before) I will be dragged off on other priorities. But perhaps there is something to pursue here over the long term, if and after I do some related “home hobby-project-work” that has long been sidelined. So please don’t spend to much time on responding – I was want a “gut feel” idea if you think something fundamental is missing from standard modeling (more importantly for me – standard physics implementations).
You are unlikely to make much headway in 2 to 4 hours, but, over the long term, the more minds we have working on the gaps, the sooner we are likely to fill in the missing pieces.
YIKES! That was fast – you’ve set a standard I can’t meet! I really appreciate the response, and I can go through the three additional links you have provided over the next day or two (but real work will have to wait for 2-3 months from now at the least). I can also bring this up in exchanges with contacts over the next few months. Thanks, justthefactswuwt.
Polar cyclones are climatological features that hover near the poles year-round. The stratospheric polar vortex develops pole-ward and above the subtropical jet stream .
The southern polar vortex is along the edge of Antarctica. Do you know that September’s maximum sea ice limit will be along the same latitude as the South Magnetic Pole? Watts up with that? Check out a new theory that answers a lot of questions and engages many forcing factors: https://www.harrytodd.org
http://www.temis.nl/protocols/o3col/data/omi/2016/o3doas20160922.gif
http://www.temis.nl/protocols/o3col/data/omi/2017/o3doas20170922.gif
Practically identical 2016 and 2017 vernal equinoxes at the South Magnetic Pole. What’s up with that?
https://www.harrytodd.org
Hi. Thanks for the page[s]. NCEP links here need updating. See
(There may be others.)