By: Marc Morano
Climate Depot Special Report
The BBC is reporting that 11 climate slides prepared by activist climate scientists in the UK somehow convinced UK Prime Minister Boris Johnson that the world faces a climate crisis. Mr. Johjnson should be prepared to reconsider his views now that he will get — the rest of the climate story from Climate Depot.
BBC” Climate change: The science briefing that convinced Boris Johnson – BBC: A slide show that Prime Minister Boris Johnson says helped convince him on climate change has been revealed for the first time. …

He called the presentation, given just after he took office, “very important”. The “teach in”, as it was described in email correspondence, took place in the Cabinet Room of Number 10 Downing Street on 28 January 2020. It was organised by the office of Sir Patrick Vallance, the government’s chief scientific adviser. The briefing consisted of 11 slides showing key aspects of climate science and its impacts and the presentation was led by Prof Stephen Belcher, the chief scientist at the Met Office.
“I got them to run through it all and, if you look at the almost vertical kink upward in the temperature graph, the anthropogenic climate change, it’s very hard to dispute. That was a very important moment for me,” Mr Johnson told reporters on the prime ministerial plane. He has also described it as his “road to Damascus” on climate – a phrase from the bible meaning a turning point in someone’s life.
#
Revealed: The 11 slides that finally convinced Boris Johnson about global warming
#
Below is a point-by-point rebuttal to the claims that Johnson was “convinced” by. The UK climate slides are presented and rebutted in this comprehensive Climate Depot report.
These are the slides and climate science information that Johnson should have viewed.
#
UK Climate Slide #1:

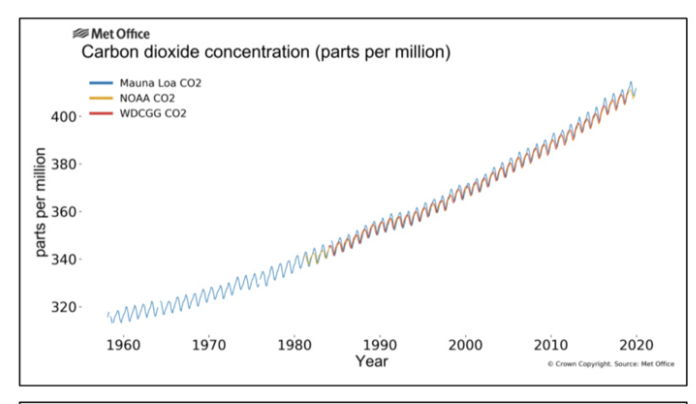
UK Climate Slide 1a: “The graph in the top left is known as a Keeling Curve, and shows the increase in atmospheric CO2 levels over 1960-2020, measured in parts per million.”
Climate Depot Response: This is a chart showing CO2 is rising in the atmosphere. This is known. What was not shown to Boris Johnson was a geological perspective of the Earth’s CO2 levels. The much longer CO2 level history of the earth counters the limited snapshot shown to Boris Johnson.


Read Chapter 3 excerpt of Green Fraud: ‘Man-Made Climate Change Is Not a Threat’ – ‘Hundreds of causes & variables influence climate’ not just CO2– Excerpt: University of Pennsylvania geologist Dr. Robert Giegengack has declared, “CO2 is not the villain that it has been portrayed.” Today’s levels of roughly four hundred parts per million (PPM) of CO2 are not alarming. In geologic terms, today’s CO2 levels are among the lowest in earth’s history. “Climate change is governed by hundreds of factors or variables, and the very idea that we can manage climate change predictably by understanding and manipulating at the margins one politically selected factor (CO2), is as misguided as it gets. It’s scientific nonsense,” University of London professor emeritus Philip Stott has noted.

#
UK climate Slide #1b: “The graph in the bottom left shows the increase in global temperatures over 1850-2020, compared to the 1850-1900 average.”

UK Climate Slide #1c: “The map in the top right shows warming over 2009-19, compared to the 1961-90 average.”

Climate Depot Response:
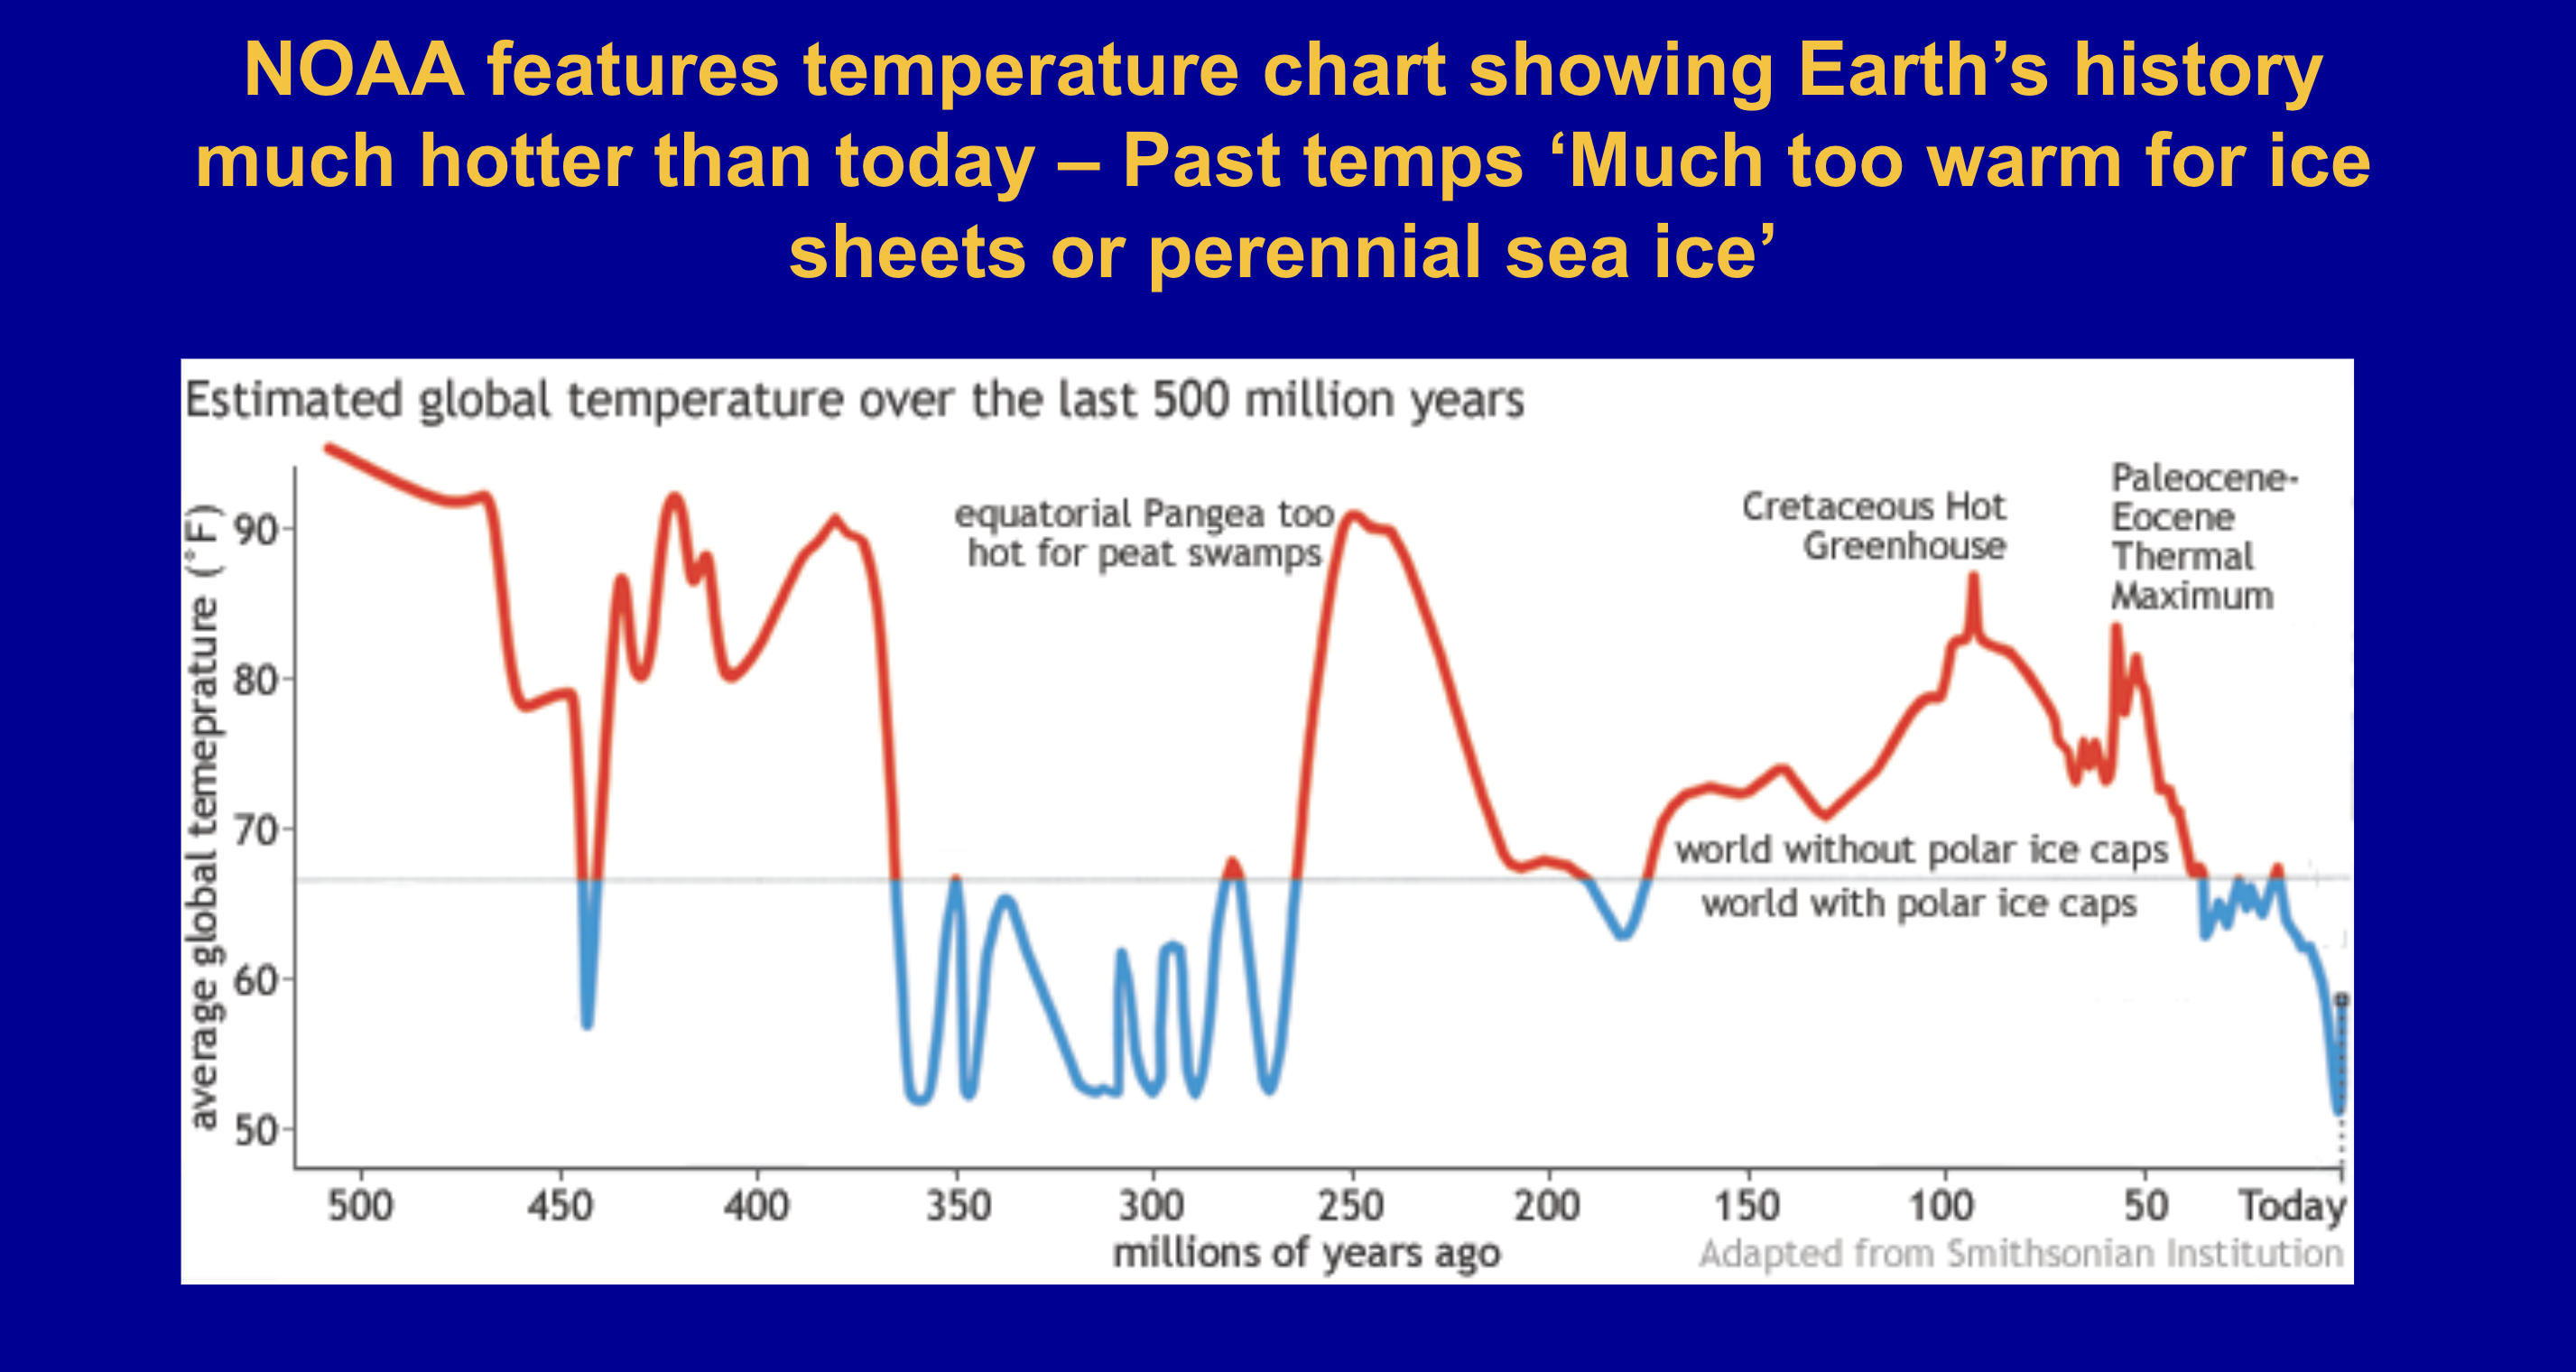
No wonder the climate activist scientists presenting to PM Johnson only focused on the past 100 plus years or so. The longer geologic view of the earth as shown below in U.S. government charts are very clear that the current temperature of the Earth does not represent a “climate emergency.”
“Preliminary results from a Smithsonian Institution project led by Scott Wing and Brian Huber, showing Earth’s average surface temperature over the past 500 million years. For most of the time, global temperatures appear to have been too warm (red portions of line) for persistent polar ice caps. The most recent 50 million years are an exception.” Source


Greenpeace co-founder Dr. Patrick Moore also puts the amount of the temperature rise since 1880 into perspective by using a more plausible temperature scale.

Temperature baselines can be manipulated by climate campaigners in myriad ways. See:Statistical politics: Prof. Mike Hulme on ‘politically charged’ climate baseline changes from 1961-1990 to 1991-2020: ‘In an instant; today, the world’s climate has ‘suddenly’ become nearly 0.5°C warmer’
Excerpt from Green Fraud: MIT climate scientist Richard Lindzen ridiculed “hottest year” claims. “The uncertainty here is tenths of a degree. It’s just nonsense. This is a very tiny change period,” Lindzen said. “If you can adjust temperatures to 2/10ths of a degree, it means it wasn’t certain to 2/10ths of a degree.”
Award-winning climate scientist Lennart Bengtsson has stated, “We are creating great anxiety without it being justified….There are no indications that the warming is so severe that we need to panic….The warming we have had the last 100 years is so small that if we didn’t have meteorologists and climatologists to measure it we wouldn’t have noticed it at all.”
Global temperatures have been holding nearly steady for almost two decades, according to satellites from the Remote Sensing Systems (RSS) and the University of Alabama at Huntsville (UAH). Many peer-reviewed studies have found the Medieval Warm Period and the Roman Warming Period were as warm as or warmer than current. temperatures.
Climatologist Pat Michaels explained that the world’s current temperature “should be near the top of the record given the record only begins in the late 19th century when the surface temperature was still reverberating from the Little Ice Age.”
So-called “hottest year” claims—based on surface data dating only back to the nineteenth century—are political statements designed to persuade the public that the government needs to take action on man-made climate change.33 In addition, temperature revisions made by NASA and NOAA have enhanced the “warming” trend by retroactively cooling the past.
#
UK climate Slide #1d & Slide 8 deal with sea level: “The graph in the bottom right shows global sea level from 1993 to 2020, compared to the 1993-2010 average, in mm. The graph uses satellite datasets from organizations including the Commonwealth Scientific and Industrial Research Organisation (pink) and the National Aeronautics and Space Administration (light blue).”
Climate Depot Response:Read Chapter 3 excerpt of Green Fraud: ‘Man-Made Climate Change Is Not a Threat’ – ‘Hundreds of causes & variables influence climate’ not just CO2– Excerpt: “Ocean levels have been rising since the last Ice Age. Global sea levels have been naturally rising for ~20,000 years. There is no evidence of an acceleration of ocean-level rise, and therefore no evidence of any effect of mankind on sea levels. According to tide gauges, ocean levels are rising less than the thickness of one nickel (1.95 mm thick) per year or about the thickness of one penny (1.52 mm thick) a year.
The 2018 “State of the Climate Report” by Norwegian professor Ole Humlum explained, “Data from tide gauges all over the world suggest an average global sea-level rise of 1–1.5 mm/year, while the satellite record suggests a rise of about 3.2 mm/year. The large difference between the two data sets still has no broadly accepted explanation.”
As former NASA climatologist Dr. Roy Spencer’s research has shown, “Sea level rise, which was occurring long before humans could be blamed, has not accelerated and still amounts to only 1 inch every 10 years.”
University of Pennsylvania geologist Robert Giegengack has said, “At the present rate of sea-level rise it’s going to take 3,500 years to get up there [to Al Gore’s predicted rise of 20 feet]. So if for some reason this warming process that melts ice is cutting loose and accelerating, sea level doesn’t know it. And sea level, we think, is the best indicator of global warming.”

Tony Heller: “NOAA says “the absolute global sea-level rise is believed to be 1.7-1.8 millimeters/year” – about half what NASA is claiming from their satellite data. Sea level has risen 400 feet in the last 20,000 years – almost all of that before 8,000 years ago. It has nothing to do with humans.”
2021 State Of The Climate Report: It was not a good year for the climate narrative
#
UK Climate Slide #2:

“The black lines show observations of global temperature since 1860, based on datasets including the Met Office HadCRUT4 dataset, while the red and blue lines show model results. The upper chart shows model simulations excluding the influence of human activity on global temperature results.”
Climate Depot Response: What an utter load of nonsense Johnson was subjected to by the climate “experts.” Using climate models to “simulate” what global temperature would have been without human influence is pure speculation.
UN IPCC’s Third Assessment Report admitted: “The climate system is a coupled non-linear chaotic system, and therefore the long-term prediction of future exact climate states is not possible.”


For a climate reality check, read Chapter 3 excerpt of Green Fraud: ‘Man-Made Climate Change Is Not a Threat’ – ‘Hundreds of causes & variables influence climate’ not just CO2The scientific fact is that your heralded “state-of-the-art climate models could “show” any outcome you wish to create. Climate activist Michael Mann admitted in 2017: “Predictions can never be ‘falsifiable’ in the present: we must ultimately wait to see whether they come true.”
Prominent scientists have exposed your climate model con. See: Page 113 of The Politically Incorrect Guide to Climate Change: In 2007, top UN IPCC scientist Jim Renwick admitted that climate models do not account for half the variability in nature and thus are not reliable. “Half of the variability in the climate system is not predictable, so we don’t expect to do terrifically well,” Renwick conceded.
Page 110: Predictions Are Suddenly “Evidence,” Models are Now “Data” – And yet, such is the climate establishment’s attachment to their computer models that they have begun to refer to their predictions as “evidence” and “data.” Scientists affiliated with the federal Oak Ridge National Laboratory in Tennessee claimed in 2011, “We find evidence from nine climate models that intensity and duration of cold extremes may occasionally, or in some cases quite often, persist at end-of-20th-century levels late into the 21st century in many regions.” And Seth Wenger of the University of Georgia has said that “the most dire climate models show temperatures in Idaho rising an average of 9 degrees in 70 years. That would make Boise pretty unpleasant. None of us want to believe that.” But Wenger added, “I have to set aside my feelings and use the best data.”
Models Do Not Equal Evidence: The assertion that models are now “evidence” raised the ire of former Colorado State Climatologist Roger Pielke Sr. “The use of the term ‘evidence’ with respect to climate models illustrates that this study is incorrectly assuming that models can be used to test how the real world behaves,” Pielke explained.

Paul D Williams – Published:24 October 2005 – The Royal Society#UK Climate Slide #3:

“The map compares Arctic sea ice extent in 1980 and 2019. Meanwhile, the text states that over this time, September Arctic sea ice extent declined by 12% on average – resulting in an overall loss of almost 3.5m km2. “Climate Depot Response:“A Tipping Point” is claimed! If only PM Johnson had known that so-called climate tipping points go back to the 19th century!

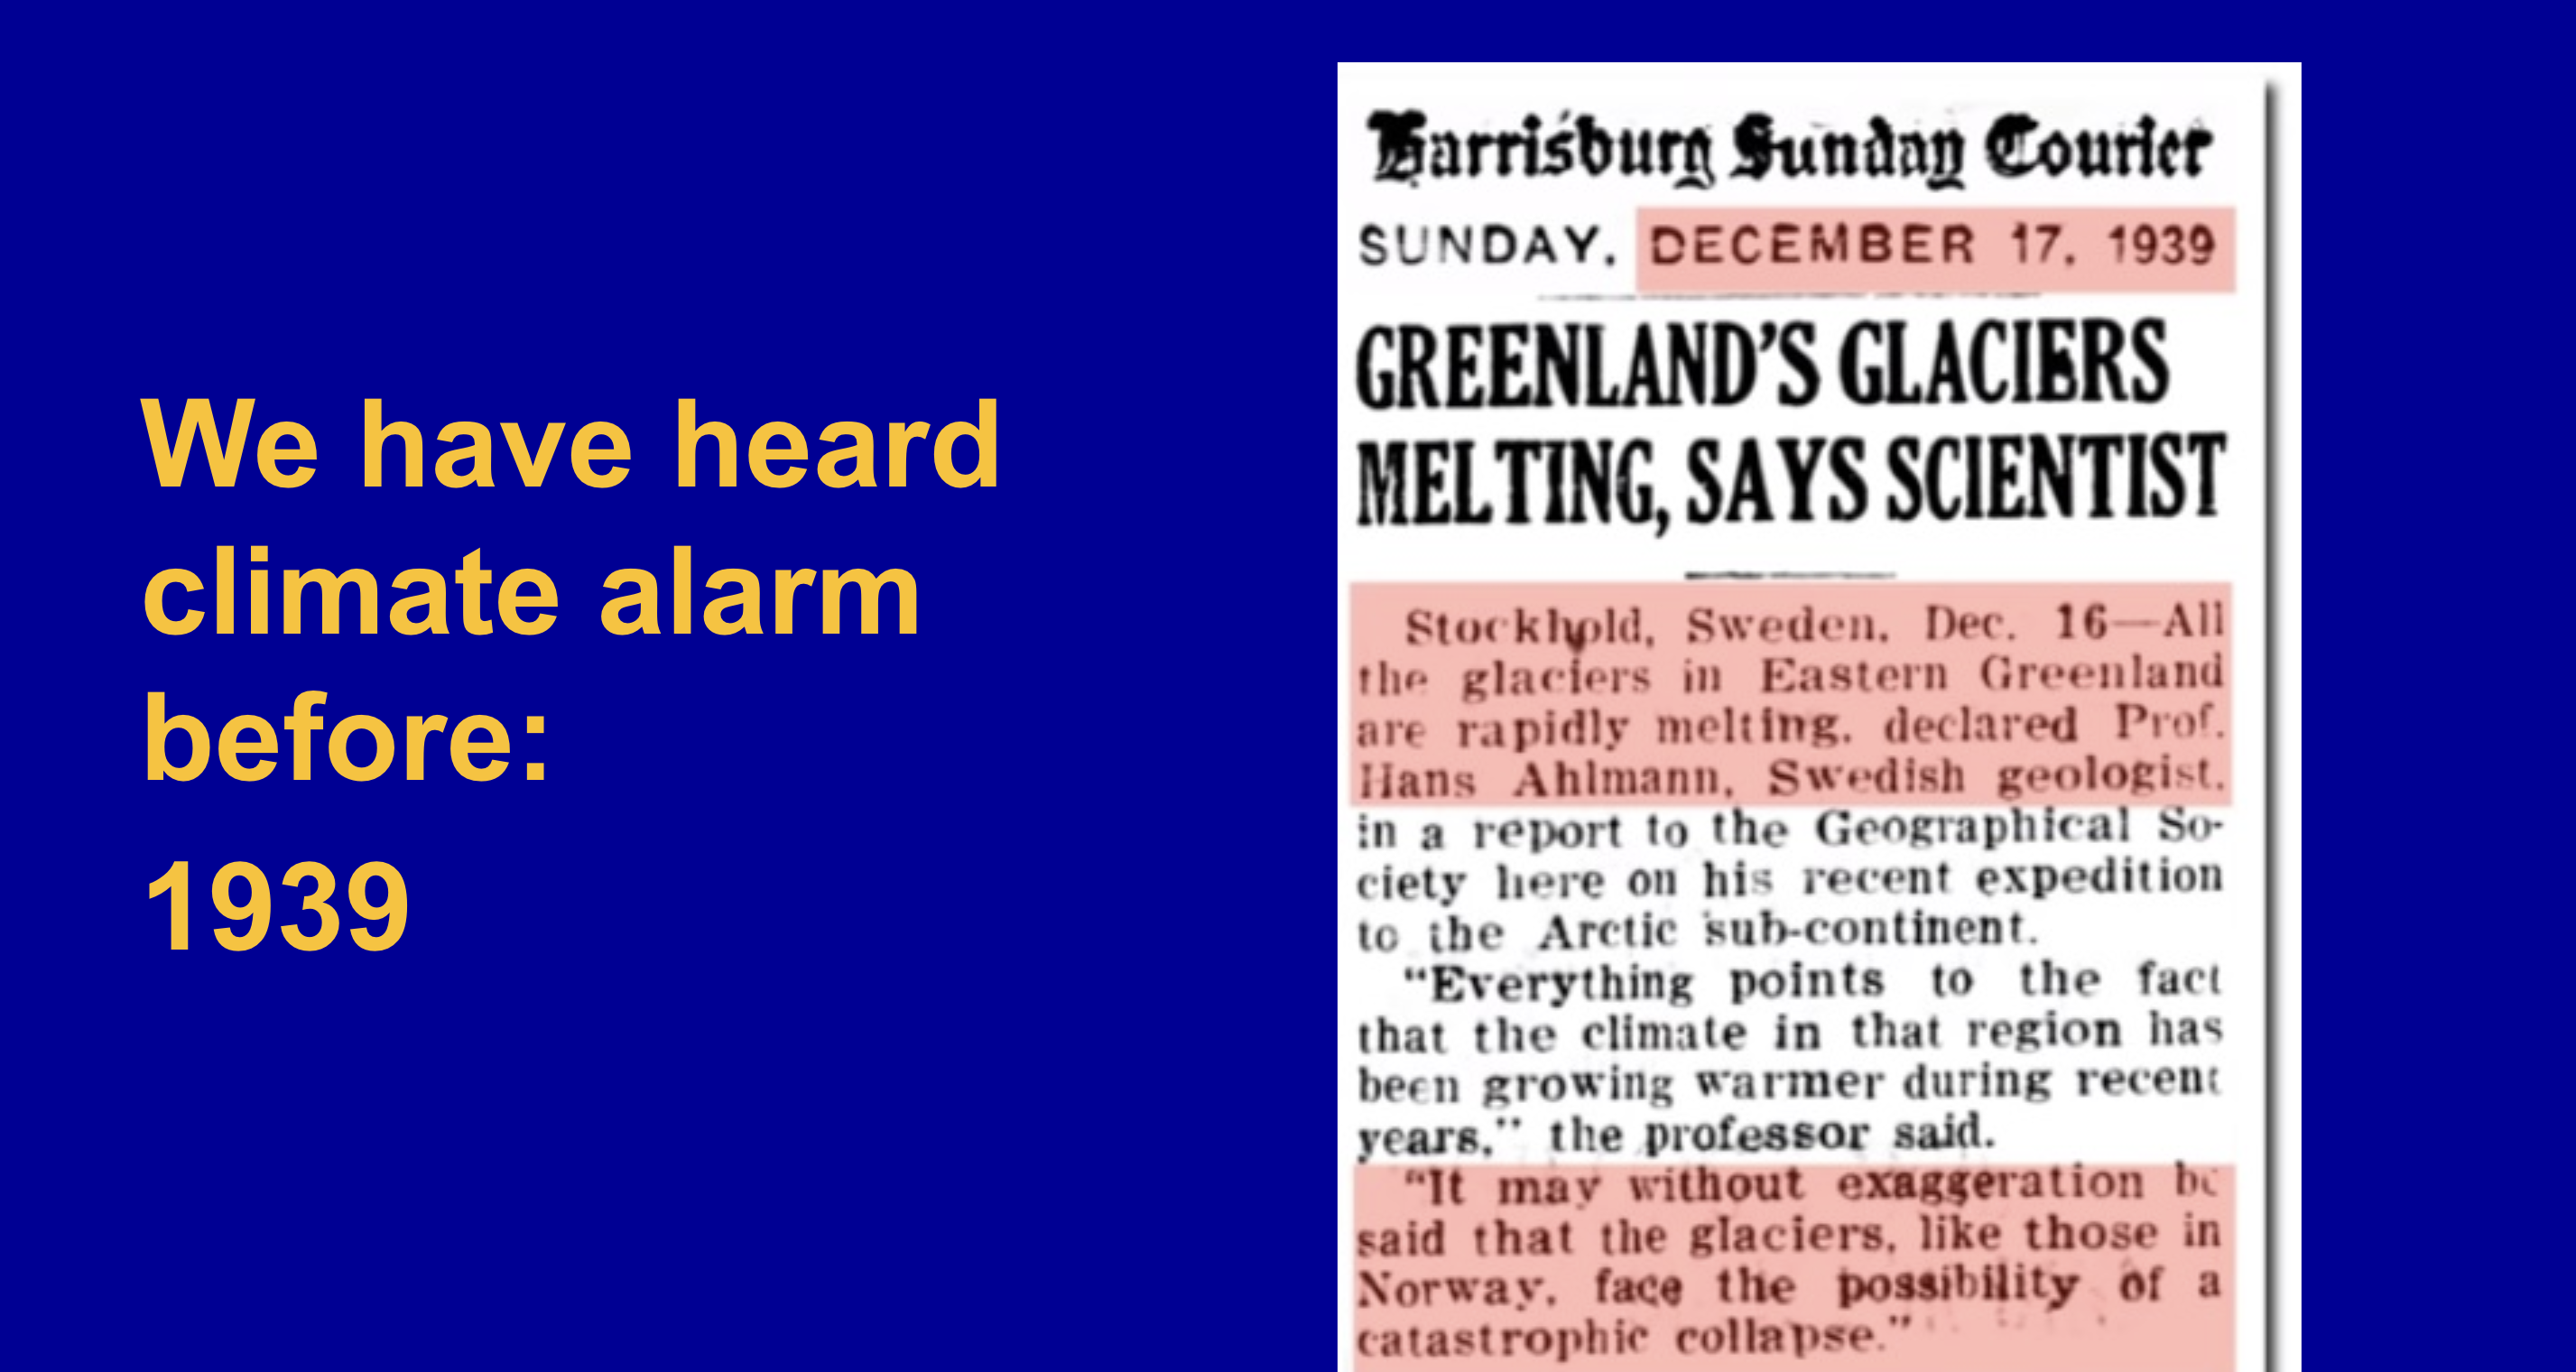
See:Earth ‘serially doomed’: The official history of climate ‘Tipping Points’ began in 1864 Excerpt from Green Fraud: Recent Arctic ice changes are not proof of man-made global warming, nor are they unprecedented, unusual, or cause for alarm, according to experts and multiple peer-reviewed studies. A study published in 2017 in the Hydrological Sciences Journal found that Arctic sea ice extent grew during the 1940s to about 1980 before declining. “The recent period of Arctic sea ice retreat since the 1970s followed a period of sea ice growth after the mid-1940s, which in turn followed a period of sea ice retreat after the 1910s.” The study found that the start of the satellite era monitoring of Arctic ice in the late 1970s “coincided with the end of several decades during which Arctic sea ice extent was generally increasing.”A 2019 study of sea surface temperatures in Greenland between 1796 and 2013 found warmer temperatures from the 1920s to the 1940s: “Temperatures were warmer than today in the 1920s and 1940s and even briefly during the 1800s,” Kenneth Richard wrote of the study, which was published in the American Geophysical Union’s journal Paleoceanography and Paleoclimatology.
Another study the same year, by Danish researchers from Aarhus University, found that “Greenland’s glaciers have been shrinking for the past century, suggesting that the ice melt is not a recent phenomenon caused by global warming.” Glaciologist Jacob Clement Yde pointed out, “Seventy percent of the glaciers have been shrinking regularly since the end of the 1880s.”Arctic September Minimum Sea Ice Extent Trend RISING Over Past 10 Years – Norwegian Data

Meteorologist: Polar sea ice trends are ‘an antidote to climate alarm’Also, Tony Heller of Real Climate Science reported in 2022: “Arctic sea ice extent is about the same as it was in 1991. … There has been no trend in Arctic sea ice extent for the past fifteen years.
According to the National Snow and Ice Data Center in Boulder, Colorado, Arctic sea ice extent finished the year at the highest level since 2003.

Arctic sea ice extent is about the same as it was in 1991.

There has been no trend in Arctic sea ice extent for the past fifteen years.


#
UK Climate Slide #4:

“This dataset uses daily observations of both variables, taken at thousands of locations across the globe over 1901-2018, to produce “indices” of extreme temperature and precipitation.”Climate Depot Response:Climate activists are always claiming that current weather and temperatures are unprecedented and out of the norm. But historical data and studies prove otherwise.Heatwaves?! Book reveals ‘75% of the U.S. states recorded their hottest temperature prior to 1955’
The following is an excerpt from author Marc Morano’s best-selling book, The Politically Incorrect Guide to Climate Change.
The World Is Not Burning: Al Gore has likened the Earth to a sick child. “The Earth has a fever that is growing more, and more intense,” the former vice president insisted. The Earth does not have a “fever.” Greenpeace co-founder Patrick Moore explains, “I do not believe the earth has a fever because it’s colder now it has been through most of the history of life.”
As Nobel Prize-winning physicist Ivar Giaever points out, “.8 degrees is what we’re discussing in global warming. .8 degrees. If you ask people in general what it is they think—it’s 4 or 5 degrees. They don’t know it is so little.”
And climatologist Pat Michaels explained that in any case the world’s “temperature should be near the top of the record given the record only begins in the late 19th century when the surface temperature was still reverberating from the Little Ice Age.”
The late geologist Bob Carter dismissed warming claims: “I call this sort of stuff kindergarten science…. The fact that the temperature was warmer at the end of the 20th century than it was in the preceding hundred years, is such a piece of kindergarten science. It’s true, and it is completely meaningless in telling you anything about climate change.”
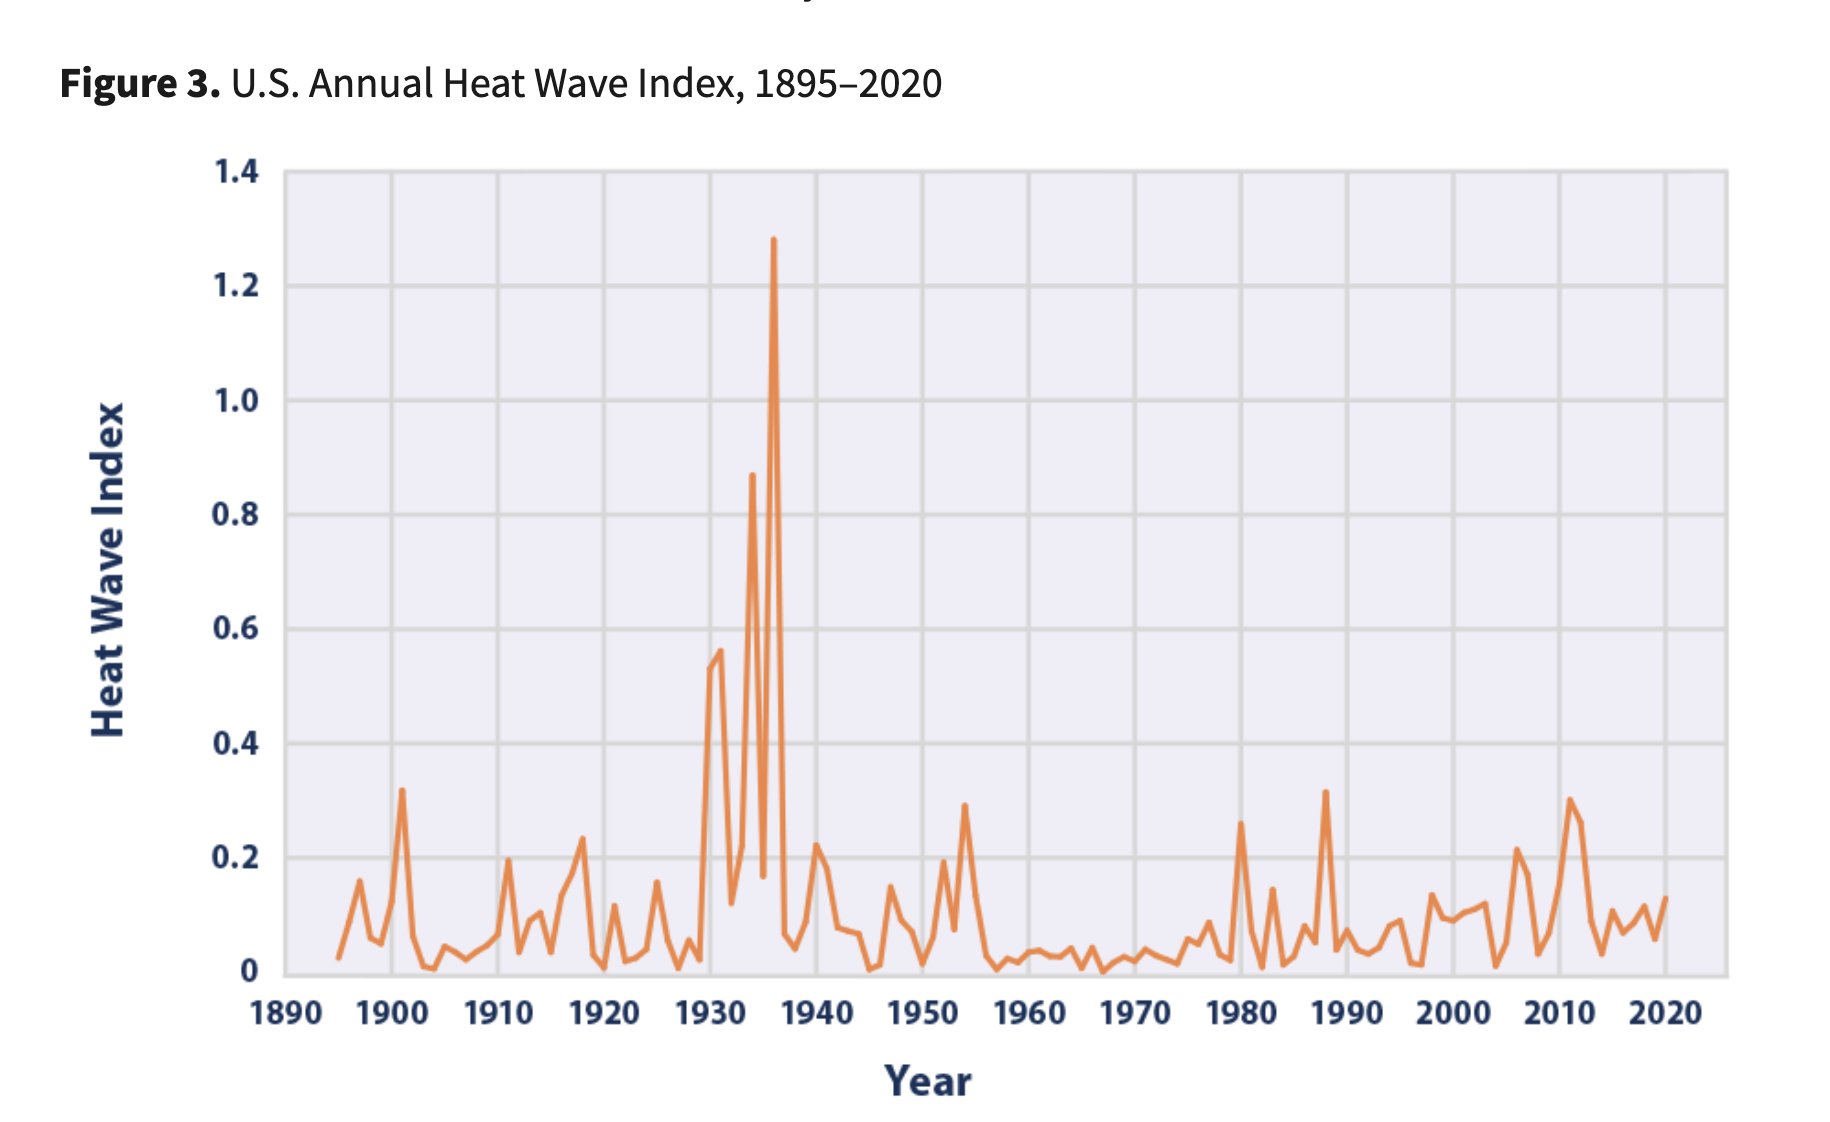
Climatologist John Christy’s research on the United States has found that “about 75% of the states recorded their hottest temperature prior to 1955, and over 50 percent of the states experienced their record cold temperatures after 1940.
”
Data from the Environmental Protection Agency agrees with Christy: the EPA website features a 2016 chart labeled “the U.S. Heat Wave Index from 1895 to 2015,” and it reveals that the worst U.S. heatwaves by far happened in the 1930s. (END EXCERPT)
New Study Finds No Evidence Of Global Warming Increasing Extreme Rainfall
1000 year rainfall study suggests droughts and floods used to be longer, worse
Study: No Difference Between 20th-century Rainfall Patterns and Those in the Pre-Industrial Era
Analysis: Record Rainfalls A Thing Of The Past:Note from Paul Homewood: “The rainfall from Harvey was the greatest from a single storm. However, this was just in one spot, as Harvey was stuck over Houston for a week. Other storms have dumped more rain, but spread over a wider area.” ‘We keep being told by climate alarmists that global warming is responsible for more intensive rainfall, the theory being that a warmer atmosphere can hold more moisture. Funny then that when we look at rainfall records across the US for all sorts of different timescales, we find none at all since 1981.’
Warmist Blames India Monsoon On ‘Climate Change’ But Annual rainfall trends debunk –India’s monsoon rainfall has been running just above average this year, but within the normal range (regarded as 10% +/-)
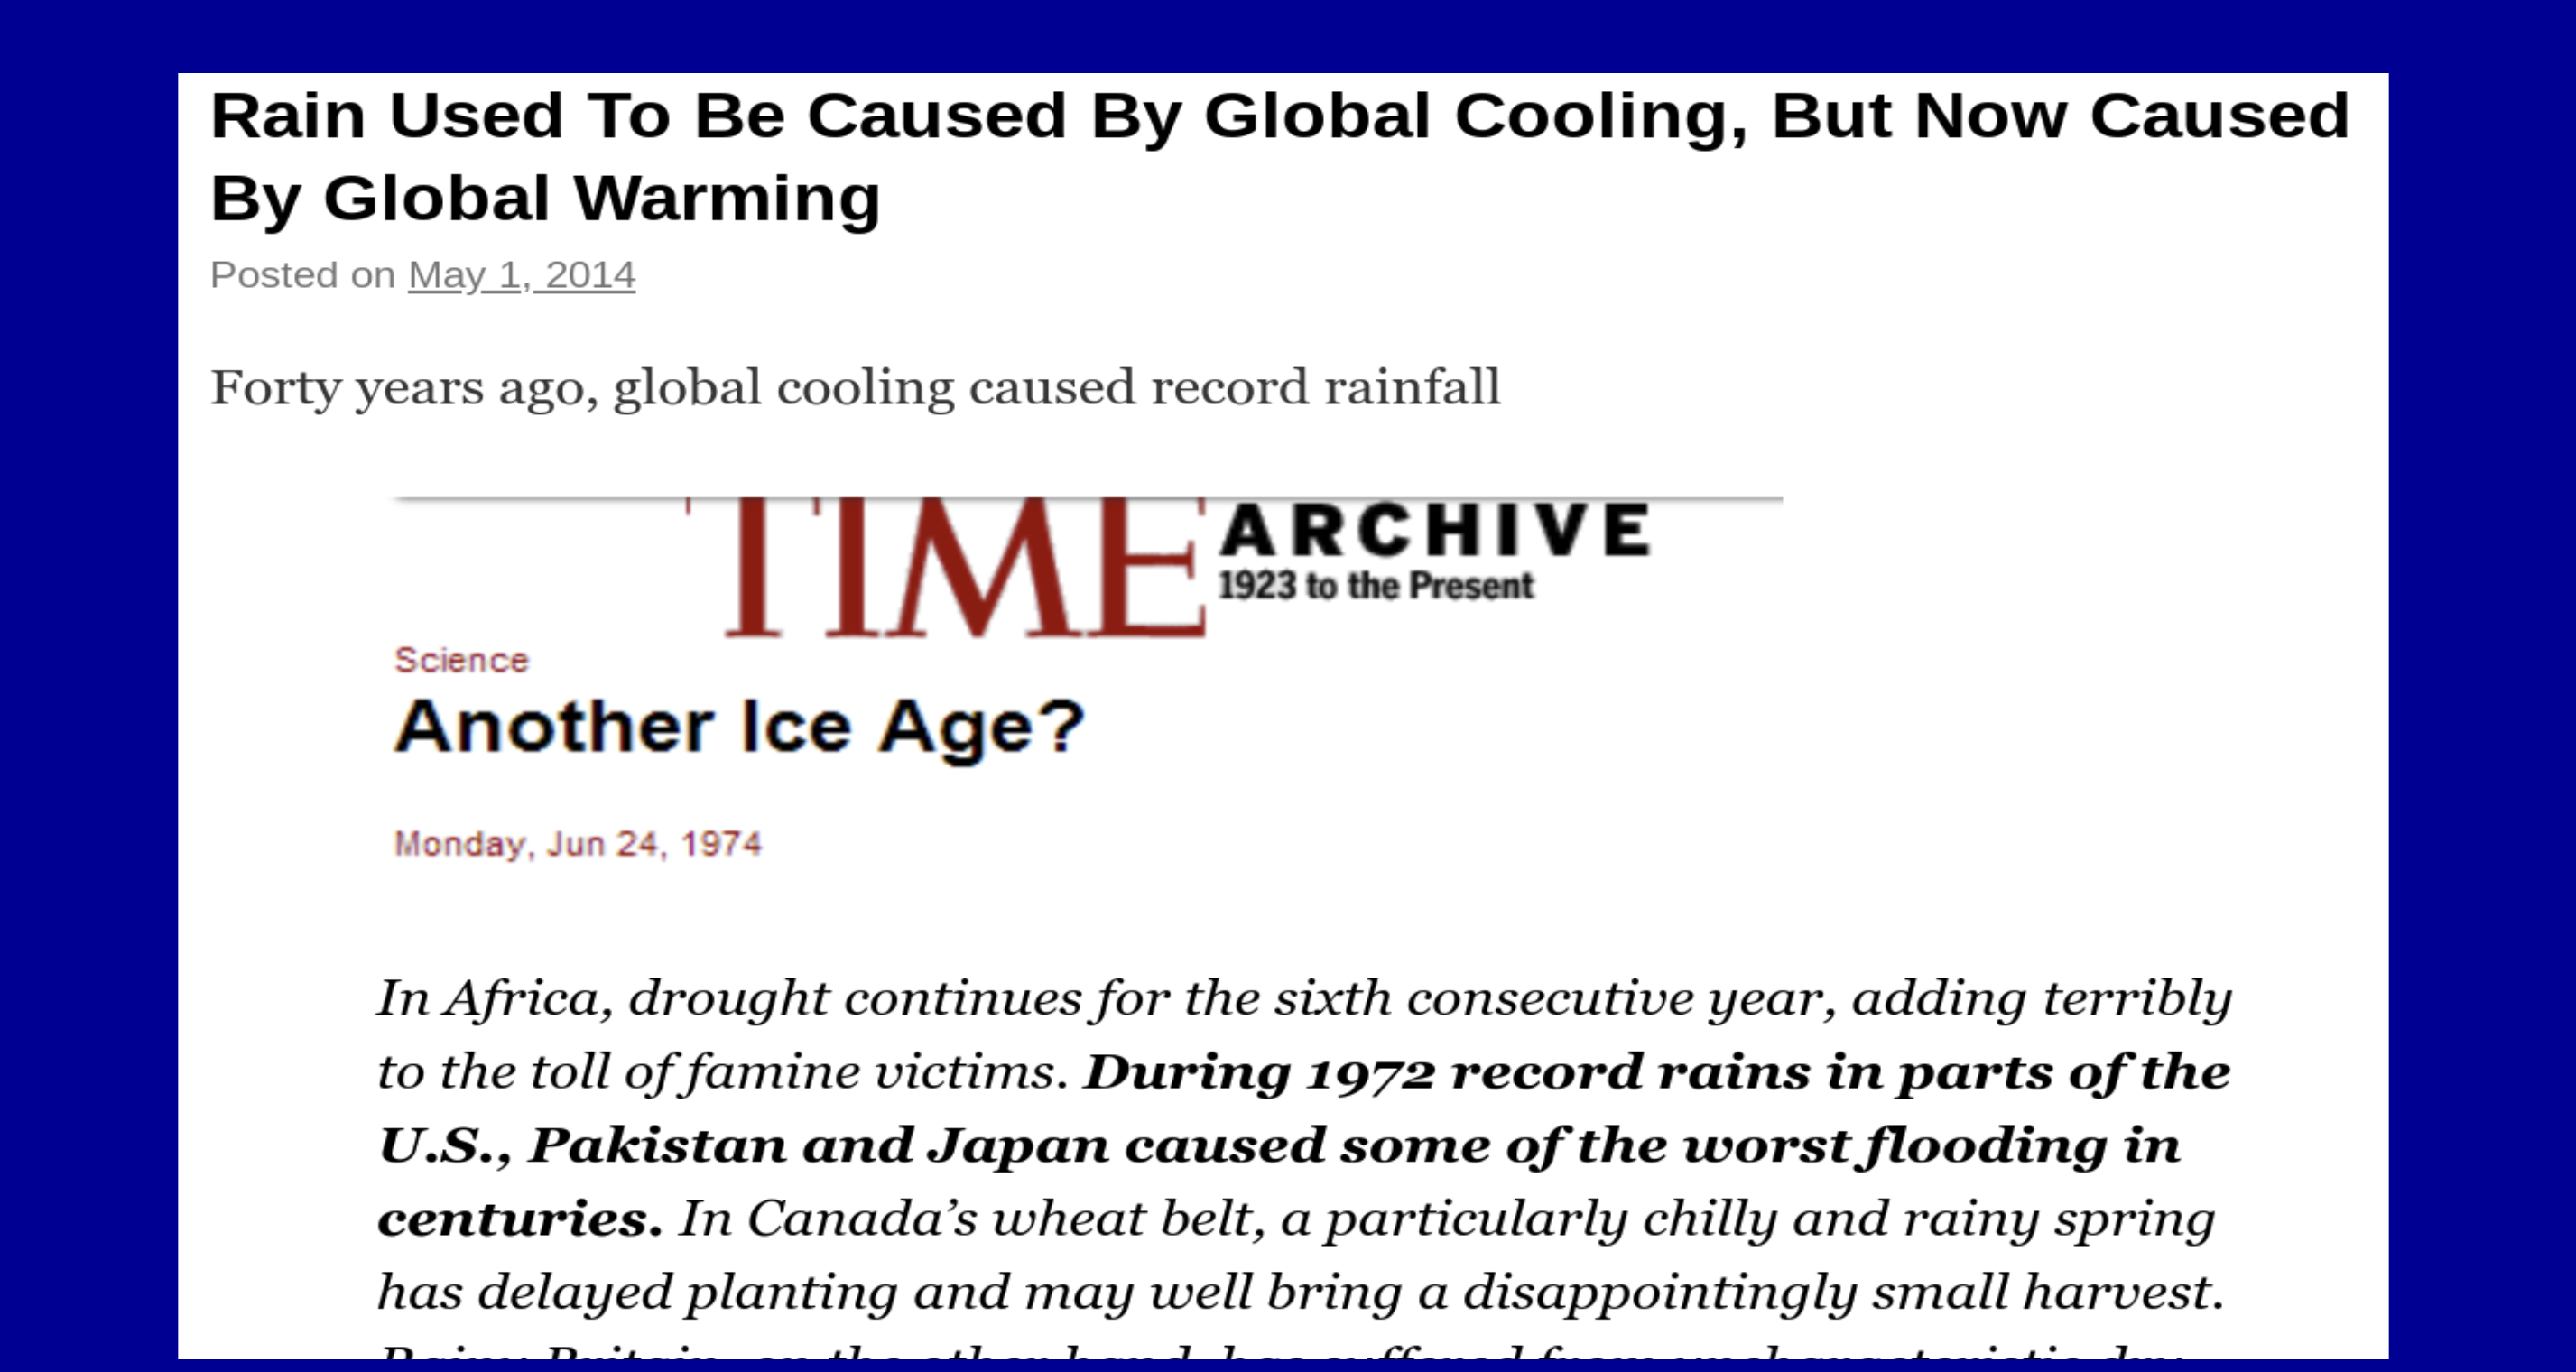
Reality Check: Global Cooling Led To More Extremes Of Rainfall – ‘Rainfall actually increased sharply during the period of global cooling in the 1960s and 70s’
Analysis: ‘Extreme Fraud At NOAA’ – ‘NOAA US temperature graphs…being adjusted upwards to track CO2’
Tony Heller of RealClimateScience.com: “This warming trend since 1970 does not exist in the thermometer data, so where does it come from?
There has been a large decrease in the number of stations reporting data over the past 30 years. But in the final adjusted data set, they use temperatures for all 1,218 stations regardless of whether or not there is actually any thermometer data.
In other words, they are simply making up data. More than 40% of the data in the final data set is now fabricated.
NOAA US temperature graphs are completely fraudulent, and they are being adjusted upwards to track CO2.
#
UK Climate Slide #5:

“This slide features a range of images, maps and graphics showing the impacts of climate change. These are grouped under four subheadings – ‘flooding and sea level rise’, ‘heatwaves, health and disease’, ‘wildfires’ and ‘biodiversity’.
Climate Depot Response:
(For sea-level rise & heatwaves, see previous answers above)
“Flooding and sea-level rise”:
Excerpt from Green Fraud: Roger Pielke Jr. of the University of Colorado testified to Congress there was simply “‘no evidence’ that hurricanes, floods, droughts, tornadoes are increasing.”
A 2020 study by Pielke published in the journal Environmental Hazards found that the “evidence signal of human-caused climate change in the form of increased global economic losses from more frequent or more intense weather extremes has not yet been detected.”
On nearly every metric, extreme weather is on either no trend or a declining trend on climate timescales. Even the UN IPCC admitted in a 2018 special report that extreme weather events have not increased. The IPCC’s special report found that “there is only low confidence regarding changes in global tropical cyclone numbers under global warming over the last four decades.”56 The IPCC report also concluded “low confidence in the sign of drought trends since 1950 at global scale.”
Pielke testified to Congress on the current state of weather extremes, “It is misleading, and just plain incorrect, to claim that disasters associated with hurricanes, tornadoes, floods, or droughts have increased on climate timescales either in the United States or globally.”

Floods
A 2017 study on floods found “approximately the number expected due to chance alone.”
Another 2017 study in the Journal of Hydrology found no increase in global floods: “Compelling evidence for increased flooding at a global scale is lacking.”
A 2019 study found that the world is the safest from climate-related disasters that it has ever been: “A decreasing trend in both human and economic vulnerability is evident. Global average mortality and loss rates have dropped by 6.5 and nearly 5 times, respectively, from 1980 to 1989 to 2007–2016. Results also show a clear negative relation between vulnerability and wealth.”
Climatologist John Christy has explained why the extreme weather claims are unscientific: “The non-falsifiable hypotheses can be stated this way, ‘whatever happens is consistent with my hypothesis.’ In other words, there is no event that would ‘falsify’ the hypothesis. As such, these assertions cannot be considered science or in any way informative since the hypothesis’ fundamental prediction is ‘anything may happen.’ In the example above if winters become milder or they become snowier, the non-falsifiable hypothesis stands. This is not science.”
#
“Biodiversity”
#
“Wildfires”

Excerpt from Green Fraud: Droughts Aren’t Getting Worse, Either— and Neither Are Wildfires
“Droughts have, for the most part, become shorter, less frequent, and cover a smaller portion of the U.S. over the last century,” Professor Roger Pielke Jr. observed.
NOAA (National Oceanic and Atmospheric Administration) has concluded there is “no trend in global droughts since 1950.” Other studies found “a decline in drought levels in recent decades,” noted the Global Warming Policy Forum in 2020. “The IPCC says it is hard to say (‘low confidence’) whether global drought has become better or worse since 1950,” said the GWPF.
A 2015 study found that megadroughts in the past two thousand years were worse and lasted longer than current droughts.
There is “less fire today than centuries ago,” as scientists and multiple studies counter the claim that wildfires are due to “climate change.”
#
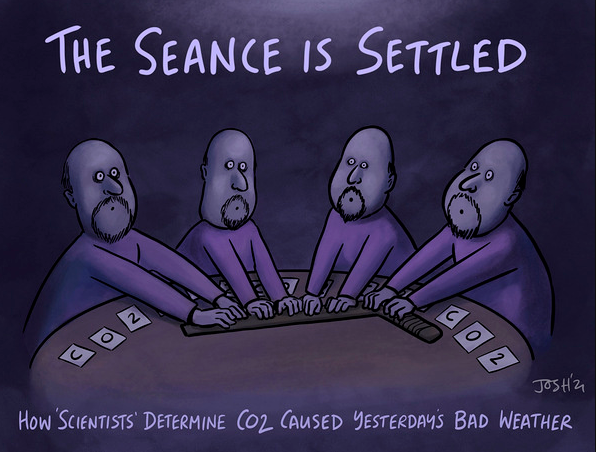
Climate Expert: Attribution Science Was Designed To Bolster Climate Lawsuits
#
“Health & disease” impact from climate?!

Meteorologist Anthony Watts: “New data shows the global climate-related death risk has dropped by over 99% since 1920. Despite the near constant caterwauling from climate alarmists that we are in a “climate emergency”, real-world data, release at the end of 2020 shows that climate related deaths are now approaching zero. The data spans 100 years of “global warming” back to 1920 and shows “climate related” deaths now approaching zero. Above is an update of the graph in the 2020 peer-reviewed article by Bjørn Lomborg: Welfare in the 21st century: Increasing development, reducing inequality, the impact of climate change, and the cost of climate policies.”
Study Finds We’re Winning The War On Climate-Related Diseases – ‘A wholesale rolling back of the biggest killers like diarrhea and malaria’
We Are Winning The War On Climate-Related Diseases – ‘Dramatic falls in climate-related mortality over the last 30 years’
’Watch: Bjorn Lomborg: 95% Fewer Climate-Related Deaths Over Last 100 Years
#
UK Climate Slides #6, #7, #9, #10, #11


“It shows the relationship between accumulating atmospheric CO2, rising global temperatures and climate change risks.”
Climate Depot Response: All the remaining slides (with the exception of the repeated Slide #8 sea level rise claims previously addressed) are just typical scaremongering from the climate activist scientists with more “tipping points” warnings. The slides are nothing more than just more scary predictions of future alleged man-made climate doom based on models and projections that are designed to scare the public and lobby governments for climate action. When current reality fails to alarm, make scarier and scarier predictions of the future.
Book reveals UN’s goal of ‘2 degree’ limit of ‘global warming’ has no scientific basis – ‘Pulled out of thin air’ – Book Excerpt: In 2007, Jones emailed, “The 2 deg C limit is talked about by a lot within Europe. It is never defined though what it means. Is it 2 deg C for globe or for Europe? Also when is/was the base against which 2 deg C is calculated from? I know you don’t know the answer, but I don’t either! I think it is plucked out of thin air.” “Two degrees is not a magical limit—it’s clearly a political goal,” says Hans Joachim Schellnhuber, director of the Potsdam Institute for Climate Impact Research (PIK). Professor Roger Pielke Jr. explained in 2017 that the 2-degree goal “is an arbitrary round number that was politically convenient. So it became a sort of scientific truth. However, it has little scientific basis but is a hard political reality.”Pielke Jr.: How Billionaires Tom Steyer & Michael Bloomberg Corrupted Climate Science – ‘Climate politics’ pursued by ‘corrupting the scientific literature’– “At the center of the corruption of climate science discussed here a highly technical scenario of the future (called Representation Concentration Pathway 8.5 or RCP8.5). Over the past decade this particular scenario has moved from an extreme outlier to the center of climate policy discussions.”
The premise of future warming is based on the unscientific goal of limiting future warming to specific temperature goals. See:
‘Science’ lobbying: UN IPCC Author in 2021: ‘More and more starting to get scared…& hopefully that’ll affect the way they vote’– IPCC Author Jim Kossin, who works for The Climate Service, a consultancy firm which helps corporations navigate Biden’s push for climate risk disclosure,: “I think people are more and more starting to get scared,” said Jim Kossin, senior scientist with climate risk firm The Climate Service who was among the IPCC authors for the chapter on extremes. “I think that’ll help to change people’s attitudes. And hopefully that’ll affect the way they vote.”


Why should we put stock in more predictions of climate doom when previous predictions have not panned out?
AFTER 50 YEARS OF FAILED PREDICTIONS, SCIENCE IS IN CRISIS
‘Climate Science’s Long List Of Failed Predictions’
Laugh at Discredited Paul Ehrlich’s failed predictions: ‘If I were a gambler, I would take even money that England will not exist in the year 2000.’And the implication of the UK climate slides is that governments can “solve” the alleged “climate crisis.” Of course, that is nonsense.


Shock graph of rising CO2 emissions despite ‘planet-saving’ UN climate pacts shows ‘farce’ of ‘climate action’– Greenpeace co-founder Dr. Patrick Moore: “What a farce the IPCC Paris Accord and all previous ‘agreements’ to reduce CO2 emissions have been. If only the collective billionaire-class would recognize that CO2 is entirely beneficial we could get on with making the world a better place.”
Climate Depot’s Marc Morano: “Get ready for more futility as the Green New Deal will continue meaningless ‘climate action.’”
griff, what was the slide (or slides) that you have prepared for BoJo?
Duped or co-opted in exchange for stage time in the political theater?
From the article: ““I got them to run through it all and, if you look at the almost vertical kink upward in the temperature graph, the anthropogenic climate change, it’s very hard to dispute. That was a very important moment for me,” Mr Johnson told reporters on the prime ministerial plane. He has also described it as his “road to Damascus” on climate – a phrase from the bible meaning a turning point in someone’s life.”
Michael Mann and his Hockey Stick Team strike again!
Boris has been fooled, like so many others, by a bogus, bastardized, dishonest, computer-generated, global surface temperature record that is totally made up to promote the human-caused climate change “hotter and hotter” scam, and looks nothing like the temperaure charts recorded by human beings down through the years, which show current day temperatures are no warmer than temperatures in the recent past, which means CO2 is a minor player in Earth’s temperatures.
The Big Lie (Hockey Stick charts) of Michael Mann and Phil Jones is still propelling this climate change scam.
The only thing that will deprogramme current legacy politicians is to be voted out for decades
He had a “road to Dumbasscus moment”? I’ll bet he has a lot of those.
How can anybody expect Johnson to believe otherwise? Just imagine you only hear one side of an issue. Imagine anybody who disagrees is marginalized and silenced. Imagine censorship of facts and opinion that don’t fit the consensus view.
No need to imagine, it has been going on for decades. Global warming/climate change is just the bellwether issue for how to treat inconvenient science.
I was very disappointed with this contribution.
The added inserted graphs etc included in these comment are of very poor quality. In many cases it is impossible to read the graphs, the number and their relevance.
This document is of no use to those of us trying to convince our friends and colleagues that CAGW is bogus because these parts are illegible.
Please can you reissue this document with inserts that can be read!
“The added inserted graphs etc included in these comment are of very poor quality. In many cases it is impossible to read the graphs, the number and their relevance.”
I would have to agree with that. Many of the graphs produced lately are barely legible and I don’t feel like taking out my magnifying glass to look at them.
I found Paul Homewood’s piece shorter and easier to follow.
https://notalotofpeopleknowthat.wordpress.com/2022/02/03/how-boris-was-conned-by-the-met-office/
But the point is, this is a distraction. Even if the Met’s and Vallance’s alarmist view of the world is correct, it makes no difference to the fact that the UK Net Zero program is idiotic.
Of course the alarmists would rather argue about the science, because that means the debate starts from the assumption that if the science shows there is a problem, Net Zero must be right.
Wrong! Net Zero is crazy whether the Vallance/Met Office presentation is right or wrong. Its completely immaterial. Net Zero is crazy because its impossible to do, and even if possible would have no effect, none, on global warming.
This is the argument that has to be made.
And I have been emailing my MP recently with this very argument, but all I can get out of him so far is that he “supports the PM’s position on net zero”. Ever the optimist though, I am not finished yet. I will keep on trying to influence him with facts, even though he doesn’t like them.
The facts I would put to him are pretty simple:
There is an account of how much wind is needed here:
https://www.imperial.ac.uk/news/223373/uk-offshore-wind-target-must-least/
Here is a taster:
And also this:
You notice the usual engineering illiteracy in these matters. The amount of storage in terms of duration isn’t specified. We need a capacity (presumably faceplate?) of 108GW.
Then for some reason not specified in this journalistic piece we need a battery capacity of 140GW. But for how long do we need to be able to deliver this 140GW from batteries? A day? Two days? A week?
Probably, in a world in which all home heating and all vehicles are running off electricity, at least a week.
This is the part that is totally impossible to achieve. There’s not enough battery production in the world to deliver enough batteries to make a dent. The result of this is one of two things. You could conceivably raise the number of turbines so that even during the very low wind periods you get more power. There are some estimates further down this thread in Ben Vorlich’s reply to Griff about what that would imply, and the numbers get absolutely huge and obviously impractical.
Just suppose as a for instance that all the turbines are 4MW. How many would that require to deliver the proposed 108GW? Around 27,000. But that isn’t going to cut it without the impossible levels of battery storage. So if you are going to do it with battery backup you probably need at least 100,000 units to get the storage requirement down to reasonably practical levels, and even then?
Someone more qualified than me could do the numbers, but maybe even this is absurdly optimistic.
The other way you can do it is abandon battery storage. In this case maybe you can do with the 27,000 turbines and 100% backup with gas fired plant. But even putting up 27,000 turbines offshore is an absolutely huge project. And maintaining them, once they are built.
Anyone who regularly goes to the English coast will have seen what are described as huge wind farms under construction. They take years to fully build out, and in some places they even have visitor information centres for the admiration of tourists. This is not like cars rolling off a production line. And their total output is tiny compared to the plan. Look here for numbers:
https://en.wikipedia.org/wiki/Wind_power_in_the_United_Kingdom
The supposedly gigantic offshore farms deliver, faceplate notice, not usable power, single numbers of MW.
The total current farms generated in 2020, from this link, 75,369 GW-h from 24GW faceplate.
You can’t even back this up with batteries, the idea of backing up the proposed total of 108GW is ridiculous.
So I don’t believe there is any chance of building out 108GW in the timescales of the Net Zero project. But even could you build it, you could not back it up with batteries. So it will have to be backed up by gas. The result of this will be to increase total dependence on gas. You take it out of the boilers, but you put it back in to the heat pumps via electricity generation. And you take out the gasoline from the cars and replace that with electricity from gas powered generation.
Because the real question to ask, if you are installing all this gas backup, and if its functioning is essential to having a viable grid, why not just install and run the gas? Why bother with the wind? Why embark on a huge national project whose only real result is to increase dependence on gas at enormous cost?
Notice in all of this reasoning there has been no mention of global warming or CO2 emissions. Its irrelevant. The project is impossible in itself, regardless of what happens to global emissions or temperatures. it cannot be done, and any serious attempt will result in a social and political disaster in the UK.
Slide #2a is specious and irrational. The main component of post 1990’s warming, particularly the boreal warming, is weaker solar wind states driving a warmer AMO (via negative NAO conditions), and an associated decline in low cloud cover. Rising CO2 forcing is expected to increase positive NAO, that cannot drive a warmer AMO.
https://archive.ipcc.ch/publications_and_data/ar4/wg1/en/ch10s10-3-5-6.html
Perhaps the biggest snow job is the belief that the public really cares. They don’t. The public is highly skeptical of the claims of threats from climate change. The concerns of the elite are not in sync with the concerns of the public. That’s true in the US and the UK and probably in many other countries as well.
The problem being that all established political parties are signed up to the green cr*p, with all those further to the left of Boris screaming that he isn’t going far or fast enough. And a lot of people do swallow this cr*p.
“The only thing necessary for the triumph of evil is for good men to do nothing.”
People are staying quiet for the most part.
Not good
The BBC journalist writing this article is Justin Rowlatt.
It could contain false information.
Like your stuff but it’s just to convoluted and verbose for the uninitiated
Willis E does a much more cogent takedown of these sorts
Boris must be an idiot to fall for this crap!
And today I read a piece where its conceded that the only way to make the move to EVs work is to implement a per mile charge. The reason being that the current model of taxing the gas they use will vanish as all cars become EVs.
So think about this for a few moments.
First we move all cars to EVs. They cost twice as much, but we do it.
Then we charge per mile, so they cost as much to run as the gasoline or diesel powered cars they replace. Or maybe more.
Then we screw up the grid by moving it to intermittent wind and solar power generation, which we anyway cannot do on a scale to meet the new demand from all these EVs (not to mention the heat pumps).
So we insist that all car chargers have to have smart meters so they can be turned off when they threaten the stability of the grid. Which will be every day at about 6pm.
Think about what this means. This is making everyone spend twice as much for cars to buy them, then taxing them so they cost as much as or more than current gasoline costs, and then making it difficult and sometimes flat impossible to fill them up.
Political oblivion awaits the party and the Prime Minister that presides over any serious attempt to do this.
Johnson is a buffon. In fact at this moment in the history of western culture being a buffoon appears to be de rigueur.
Science speaks, real money whispers.
Carrie Symonds got her political start running the campaigns of Zac Goldsmith. She is head of public relations at the Aspinall Foundation. Goldsmith and Aspinall are top Tory moneybags. Goldsmith’s The Ecologist is the flagship magazine.
Follow the money trail…
To think a slide-show changed BoJo’s mind is plainly silly.
Goldsmith founded the CEN and the EU CDP. Charity Commission for England and Wales has a statutory inquiry into the Aspinall foundation…
In other words the slide-show is for the plebs. Could it be that the US is clueless about UK power structures? Likely, as they follow Prince Charles’ NetZero :
From Alice in Wonderland 1999 :
A look at Met Office series 1991-2020 average UK temperatures shows no warming. Why wasn’t he shown this data which the TheGWPF has published. Somebody is either wrong or right about temperature increase in the UK.Interesting that the world’s longest record of air temperatures is measured from circa 1680 in the UK Midlands temperature charts, showing the end of the Little Ice Age and subsequent periods of hotter and colder variations.