Guest Post By Javier
A no-assumptions look at the global warming evidence helps clarify the possibilities.
The planet’s surface has been warming since the depths of the Little Ice Age, and particularly since ~ 1850 AD. The surface temperature record, however incomplete or uncertain, reflects this warming. Hypotheses about why the warming is taking place can be grouped into three general categories:
- The energy input is increasing. This is the basis of the variable solar output hypothesis.
- The energy output is decreasing. This is the basis of the greenhouse gases hypothesis.
- The transfer of heat within the system is changing. This is the basis of some hypotheses for a reduced vertical exchange in the ocean, or for changes in the oceanic currents that redistribute the heat.
A combination of these categories cannot be ruled out.
Whatever causes the temperature change must necessarily affect its rate of change, the velocity at which temperature changes over time, measured in °C/decade. A velocity that varies continuously and can be positive (warming) or negative (cooling).

Figure 1. 9-year global surface temperature rate of change (4-year averaged) in
°C/decade. The Pause is indicated by the khaki box. Source: Met Office UK, HadCRUT 4.
There are two features in the evolution of the temperature rate of change since 1850 (figure 1).
- A long-term increasing trend, represented by the linear adjustment, that indicates the warming has been progressively accelerating. The current rate is 0.14°C/decade.
- A very variable rate that indicates that the surface of the planet does not warm continuously but through periods of warming interrupted by periods of cooling.
These two features have been described with the analogy of a man walking his dog. The man’s path being the long-term trend, and the dog’s path the variability around that trend. There is an apparent but irregular periodicity in the temperature rate of change, meaning that the dog does not move at random. Periods of warming and cooling are of roughly 30 years each, constituting the known 60-year oscillation.
Additionally, during each 30-year period there is a reversal in the direction of temperature change, that goes through a period of change in the rate opposite to the main oscillation. This behavior of the data can be graphically represented by a curve oscillating with these characteristics (Figure 2, thick grey curve).

Figure 2. 9-year global surface temperature rate of change (black curve) and 60-year oscillation (grey curve). The analogous position to the present in previous oscillations is shown with red arrows.
What we call the “Pause” is just the latest change in the periodical behavior of the temperature rate of change. Something that should be expected simply as an extrapolation of past behavior. However, assumptions taken about the cause of global warming precluded most scientists from simply extrapolating past observations. Further extrapolation suggests the Pause is the beginning of a non-warming period that should be ~ 30 years long.
The examination of the evidence without assumptions leads to the following observations:
- The surface of the planet has been warming in a linearly accelerating way since 1850. The long-term rate of warming is currently 0.14°C/decade.
- Periods of higher rate of warming alternate with periods of lower or negative rate of warming in an irregular ~ 60-year oscillation.
- The rate of warming presents also a ~ 20-year oscillation, and usually inverts its direction of change after about a decade.
Now we can start testing possible causes. The leading candidate according to most climate scientists is the anthropogenic increase in GHGs. By comparing the temperature rate of change with the increase in the main GHG, CO2, we can see that this affirmation is not supported by the evidence (figure 3).

Figure 3. 9-year global surface temperature rate of change (black curve, LHS) and 10-year change in the natural logarithm of atmospheric CO2 concentration (blue curve, RHS). The logarithm better represents the changes in forcing by CO2. The red dashed lines are the linear adjustment to the black curve for each half of the data. Source: 1850-1958 Law Dome. 1959-2017 NOAA.
We can see why many scientists are mistaken about this issue. The increase in CO2 since the 1960s coincides with a period of increase in temperature rate of change (orange box in figure 3). They just needed to explain away the prior cooling (blue box in figure 3) which they did by using aerosols, a byproduct of the early global
industrialization. However, by looking at the long-term rate of change we can see that the increase in CO2 cannot explain the increase in warming from 1850-2018. Most of the CO2 increase has taken place in the second half of the period, while both halves of the temperature data are not significantly different and have a similar slope in their linear adjusted rate of change (dashed red lines, figure 3).
Obviously, the increase in CO2 cannot explain the 60-year oscillation either. This oscillation is also unlikely to have a solar origin, as there is no 60-year solar periodicity. It may have an oceanic origin, since it is present in some oceanic indices. Alternatively, it could be caused by an oceanic-atmospheric interaction.
Solar variability can be related to both the long-term increase and the periodical oscillation in the temperature rate of change (figure 4). It is at least plausible that it contributes to both.

Figure 4. 9-year global surface temperature rate of change (black curve, LHS) and 11.1-year averaged monthly sunspot number (red curve, RHS). The position of the lows from two well known solar periodicities are indicated by red arrows. Source: Silso.
Measuring solar activity by its proxy, the 11-year averaged monthly sunspot number, we can see a long-term increase in solar activity since 1850, matching the increase in rate of warming. Additionally, the oscillations in solar activity are compatible with the oscillations in the temperature rate of change, particularly during the first 80 years of the record and the last 40. However, the 40 years in between are in clear disagreement.
Periods of very low solar activity in the 170-year record coincide with periods of low or negative temperature rate of change. It is possible that the 60-year oceanic oscillation is paced and reinforced by the periods of low solar activity and the oscillation then continues through the periods of higher solar activity.
The CO2-hypothesis is an atmospheric hypothesis of climate, where the atmosphere acts as the main controller of how much energy enters or leaves the system. Its main contender is the oceanic-solar hypothesis of climate, where the oceans control the surface temperature and do so by integrating the changes in solar output and deep ocean heat exchange. In this hypothesis the oceans are quite sensitive to small solar changes but also to other factors (clouds, wind, upwelling) that can determine a different response at times. The climate control by the oceans
could compensate, in great measure, for changes in atmospheric non-condensing greenhouse gases, like CO2. This would explain the thermal homeostasis of the planet during the Phanerozoic Eon, when great changes in solar output and GHGs took place.
In conclusion, a no-assumptions look at the evidence of warming shows that solar forcing has changed during the period 1850-2018 in a more consistent manner with the warming rate than CO2, and thus constitutes a better candidate for the main cause of the observed warming. There is insufficient evidence to evaluate other possibilities over the entire period.
Variable solar irradiance.
https://imgur.com/a/alC7C1y
Hi Javier. Great post. I see the 60 -70 yr oscillation as a mostly arctic ocean ice build\ ice melt affect. When the arctic is more ice free uninsulated sea ice formation cools the arctic ocean to depth and releases latent heat into the polar vortex weakening it. When the arctic becomes packed with sea ice (because the arctic ocean cooled) incoming north Atlantic water warms the arctic waters slowly melting the pack ice again. This process drives the AMO because of ocean currents in and out of the arctic–easy. The tricky bit is what is happening in the north Atlantic? The cold AMO should lead to an increased deep water THC circulation which exits the Atlantic altogether. This water must be replaced by water coming in. But from history we get the AMO staying cold for 30 odd yrs hence the sst remains cold despite increased incoming water and the weakened polar vortex weakening the NAO slowing the north Atlantic drift. The replacement water must be deep Atlantic water drifting into the cold AMO area because of gravity. This has interesting consequences. A slight warming of the antarctic ocean (more of its water entering the south Atlantic) cooling of the south Atlantic and equatorial areas but surface areas of the north Atlantic retain the AMO negative pattern.
I see the negative AO leading to the slow accumulation of terrestrial ice/snow over the next 30 yrs amplifying the atmospheric overturning (increased meridional winds) leading to increased deep water upwelling and cloud cover cooling the NH pacific ocean. In fact the negative AO should do this by itself. However because the solar cycle also affects the AO, if solar activity remains weak at the end of the 30 yr ice build cycle there will be a continued slow terrestrial ice/snow accumulation due to the sustained negative AO. This slow accumulation/loss of terrestrial ice/snow over centuries driving more/less wind velocity I see as one of the main climate drivers. I see UV ocean penetration as important and possibly cosmic rays also (maybe). What drives SH variability must also be very important.
As I see it–bruce (currently!)
Interesting hypothesis that Arctic sea-ice oscillations are a cause and not a consequence. According to the “Stadium wave” hypothesis there is no beginning or end to the oscillation, it is just a carousel turning with each part being consequence of the previous and cause to the next.
AARI sciemtists see Arctic ice in a similar way

The most probable regulator of the physical geographical process can be found from analysis of the relationships between the components of the climate system. It is not necessary to investigate the cause-effect relationships between all these components in succession. It is sufficient to choose one of them, let us say sea ice, and consider its direct interaction with the atmosphere and the ocean – in the climate system and the significance of internal mechanisms in the natural process. Pg 1
The idea that the ice area growth at present can be achieved by changes in only the haline structure of the upper ocean layer, as a result of surface Arctic water overflowing onto warmer but more saline water, is supported both by calculations and empirical data. Pg. 46
https://rclutz.wordpress.com/2015/12/23/arctic-sea-ice-self-oscillating-system/
An analysis of cause-effect relationships does not leave any doubt in what direction and in what order the climate signal propagates in the atmosphere-ocean-polar ice system. This is not the direction and order usually assumed to cause present climate change. When it has become clear that the changes in the ocean, caused by disturbances of its freshwater balance, precede changes in the extent of sea ice, and the latter the changes in the atmosphere, then there was nothing left but for us to acknowledge self oscillation to be the most probable explanation for the development of the natural process. Pg. 58
Ron
You are referring to the downstream effects. The primary driver of Arctic sea ice volume / extent starts with the volume and timing of Equatorial evaporation and global atmospheric blocking mechanisms. The control mechanism that set the 2012 May to September SIE rate of decline and ultimate SIE minimum date was nowhere near the Arctic,
The Arctic is the recipient, not the driver.
With regards
Javier,
we do not get any further in the search for the cause of global warming
since the LIA by sticking to your “THREE GENERAL CATEGORIES” …
All arguments out of those 3 categories were 1,000 times regurged and fed
again all over, without getting to the bottom of real causes.
The only alternative is adding a 4th category, either stating:
…. 4th: “The energy input is increasing”. This is the basis of the “unknown
variable hypothesis” …
but better still:
…. 4th: “The energy INPUT is increasing”, while forgetting the Sun´s changing
output, but rather focussing on the variable energy INPUT ( “insolation”=
“incoming solar radiation”), which varies between 1408 and 1318 W/m2 in
daily fashion, depending on Earth positions in the Earth orbit.
As everybody can imagine, only a slight orbital change for a couple of days can
easily produce some Watt/m2, thus insolation input on Earth. Every astronomer
knows well that the Earth orbit is NOT an airplane´s straight line, but a WINDING
SPIRAL, thus producing distance variables within the Earth orbit, the EOO (Earth
orbit oscillations) or “”Earth orbit perturbations””.
Javier, by excluding the 4th category and hiding all orbital perturbation variables,
by stating that there are only 3 categories, you further the warmist cause, by making
people believe that only 3 categories exist, which are all covered by warmism.
Read my booklet containing exact orbital details… some good insights on the subject
as well for all interested in http://www.knowledgeminer.eu/climate-papers.html
JS.
Do we see this variation in the satellite TSI data? As they are being dragged along with us, they should see most of the same variability.
Loren,
the TSI is a calculated construct for a theoretical CONSTANT distance of
Sun to Earth of 150 Mio km length. It is not a measured value…. furthermore, nobody presents you the formula they actually employ in Davos at the TSI observation center…..
The TSI-value completely keeps all distance changes of the orbit out of
the TSI result, which is NOT distance dependend…..
If the energy input is increasing, that is still the first category, even if it is from orbital changes. However we have very good physicists that really understand the orbit of the Earth. I am sure they haven’t overlooked the changes you talk about as a possible climatic influence if only to include them in the models. I haven’t read anything like that in the scientific literature.
Many times over again, your famous quote:
1.) I haven’t read anything like that in the scientific literature.”…. and please
add: “and therefore, because I (and your finger pointing at yourself) was not
able to find the relevant literature, IT MUST BE WRONG! …..
The climate “science” left the peturbations and the spiral flight open
unconsidered until 2006, in preparation of AR4. And then they
colluded in the chapter preparation to omit all references to the orbit,
within the less 1,000 year range (Milankovitch for 20,000 years and
more stuff…. (I have an Email from an actual participant)
and they “cheered and clapped each other on the back, once this was decided”
at the preparatory meeting in 2006….. so much for your MODEL people….
…… Find an ASTRONOMER, and not a physicist on the spiral advance movement
of Earth… the famous Carl Gauss himself tried to find the mathematical
formula for the spiral advance during 4 years of observation….and discovered
the “Least Squares Method” out of his observations…..
2.) In your first category the Sun OUTPUT changes…..
but here I am talking of the Sun OUTPUT stays unchanged and the
solar input at the TOA changes, due to orbital changes ….. therefore
the fourth category…..
1) No, I don’t think it must be wrong because it is not in the scientific literature. Its absence makes me skeptic, because obviously you could be wrong and I wouldn’t know it. I am not going to dedicate a huge amount of time to learn something in great detail only to see if you are right or wrong. The people you need to convince are the people that already know in great detail what you talk about, i.e. the experts in orbital variations. I just know enough to understand what Milankovitch is about.
If you can convince them that what you say makes sense you’ll have no problem to get it published.
2) No. The first category is changes in the energy input to the climate system. That includes changes in solar output, and orbital changes if they affect climate at the time frame we are discussing in this article.
There is one point: You write about the cold LIA and conclude that volcano eruptions plus missing sunspots are not good enough to explain the low temps in the17 cty….. And you conclude further that there must be SOME OTHER FORCING, acting to produce those low temps at that time and a forcing, leading us out of the cold afterwards into the present warm…. Therefore: It must EXIST some type of forcing, which is being kept below the public horizon, the missing link, some forcing, which does not please the AGW-proponents. And to find this forcing, one needs to read “Non-gatekeeper literature”.
The gatekept literature, freely available, is based on collution (NASA astronomy and GISS Mann´s warmist climate in the same hand as NASA-GISS), which put the orbital forcing into the “poison cabinet”…..
The other warmist outfit is the Catholic church Louvain Uni in Belgium, where the Milankovitch stuff comes from….and they as well, suppress the public´s view on perturbations/oscillations of the Earth´s flight spiral advance, with the aim of putting the warming effect of the spiral movement as a gain into the pockets of AGW, of the CO2-lie and of the Pope in Rome as “climate defender”……
Interesting is that you reject all independent research and that you
just want to copy out of AGW gatekeeper literature ….enough for you is
your quote: “” I just know enough to understand what Milnkovitch is all about””” ……- ???- Real science is different, will get to the bottom and rejects all floating on the surface…. this is what journalist do, but not scientists.
I think you must confuse me with somebody else. I think the LIA can be explained by the low solar activity reflected in the cluster of solar grand minima. High volcanic activity was not responsible but contributed to the LIA being colder. This is all well reflected in the literature as I share the opinion of quite a few climate scientists and astrophysicists. I am not looking for missing forcings outside the literature.
Your catholic conspiracies are amusing but Dan Brown already made a career out of that. I am pretty sure that if scientists from Université catholique de Louvain have a point of view, it is theirs and not the last Pope’s. Nobody is suppressing public’s views.
I do not reject independent research. I just keep it in the unconfirmed category until it is confirmed by unrelated scientists. I have been in science long enough to know how easy it is to be wrong and how hard it is to be right. And I am not a climate scientist, so I do not do research on climate science. I just judge how solid it is and how many unstated assumptions it takes, and I do it on published scientific literature, because I lack the capacity to check it, so I have to trust that the data and procedures are correct and independent experts have looked at it.
“by comparing the temperature rate of change with the increase in the main GHG, CO2, ”
I thought water vapor was the main GHG.
Water vapor is the main ghg . . . and it has been increasing.
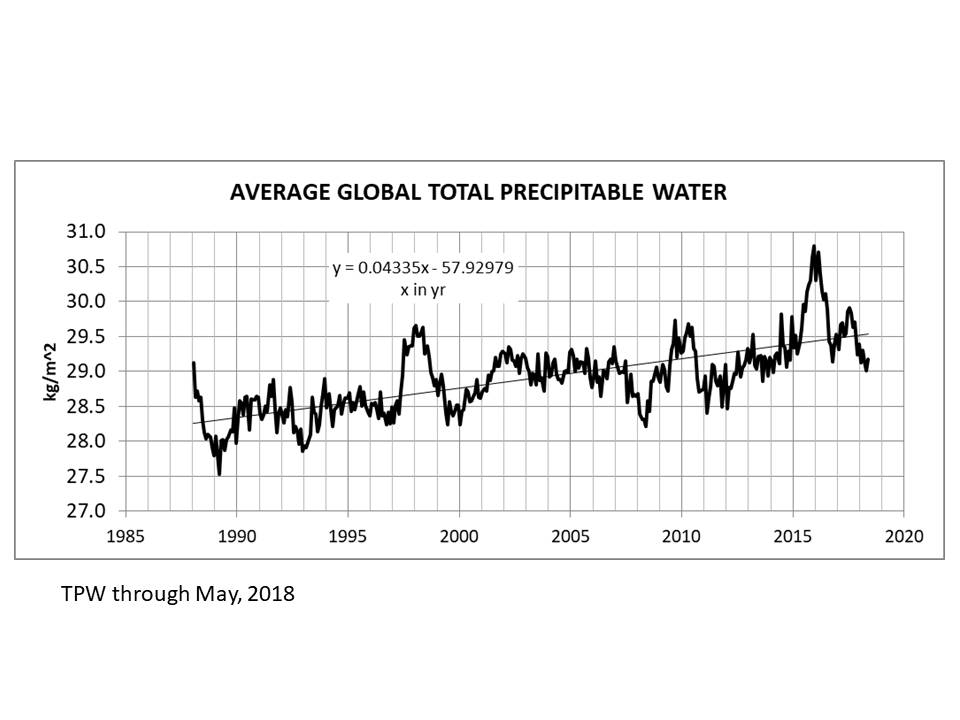
The ISCCP and NCEP Reanalysis both disagree with this graph from RSS that only covers ice free oceans and none of the polar regions. They show no increased water vapor during this period and actually show a decline.
The link below covers the water coulmn data from NASA and also showed the same thing.
https://friendsofscience.org/assets/documents/Water_Vapor_Decline_Cools_the_Earth__NASA_Satellite_Data.htm
However, this method has not received widespread use in part because humidity is a local measurement and precipitable water is a total column measurement. I am not in favor in this type of guess because it is like estimating the maximum temperature threshold will be 37.5c and next month it will be 35.7c based on how potentially warm it may be that month for the time of year with a southerly source and very low relative humidity levels. Instead of the actual maximum temperature was 35.3c because relative humidity was lower than the total column.
Relative humidity (RH) is the ratio of the partial pressure of water vapor to the equilibrium vapor pressure of water at a given temperature. Relative humidity depends on temperature and the pressure of the system of interest. The same amount of water vapor results in higher relative humidity in cool air than warm air. A related parameter is that of dewpoint.
The water column data determined by relative humidity, pressure and temperature of the whole atmosphere. It just increases the potential errors when one can just show the relative humidity trend. It just ignores all trends in local weather because it doesn’t matter what the weather conditions are because it ignores all of them. The reason why they don’t show the more accurate representation of the planets water vapor via relative humidity is because it is not showing what they want it too.
Comparing the water column with global temperatures is false because these then need adjusting with relative humidity and pressure.
Thank you.
“Calculations by a line-by-line radiative code show that upper atmosphere water vapor changes at 500 mb to 300 mb have 29 times greater effect on OLR and temperatures than the same change near the surface.”
So, that is what the computer code shows.
What do the upper atmosphere measurements show?
“Water vapor is the main ghg . . . and it has been increasing.”
And why has it been increasing?
90% of H2O in the air came from the ocean.
Certainly a lot of the water vapor has always come from the ocean. No significant change there. But most of the INCREASE in water vapor correlates quite well with increased irrigation. http://globalclimatedrivers2.blogspot.com
No, PWC relates to absolute humidity and not relative, as that remains the same (over reasonable time scales). That means that global temps have risen to accomodate that extra water. Irrigation is a mere drop in the ocean compared to the 70% of the globe covered with it.
There is a non-condensing GHG that does have a mechanism to explain the observered increase.
Absolute humidity is what matters wrt the so-called ghe. All three data sources graphed in Figure 1 at https://wattsupwiththat.com/2018/06/09/does-global-warming-increase-total-atmospheric-water-vapor-tpw/ are increasing at approximately 1.5% (of the means of the measurements by each of the sources) per decade since 1990. I used the mean for Rss data as 29 per Willis at https://wattsupwiththat.com/2016/07/25/precipitable-water/
You can’t compare absolute humidity to global temperatures because these temperature readings have been as the result of energy in the atmosphere relative to humidity. The absolute humidity occurs regardless of all observed temperatures and therefore meaningless. Absolute humidity relies on the entire atmosphere and these readings do not. Only the more recent including RSS shows it increasing as to the earlier link they didn’t.
https://friendsofscience.org/assets/documents/Water_Vapor_Decline_Cools_the_Earth__NASA_Satellite_Data.htm
Confirmation bias?
Only relative humidity matters because absolute humidity is REGARDLESS of temperature. IF GHE wasn’t reliant on temperature then it may have had some meaning.
To do a fair comparison you need to compare energy content trend of the atmosphere against absolute humidity.
maybe it is all the nuclear plants
they need a lot of cooling water
meaning they put out a lot of warm water…
> linearly accelerating
What exactly does this mean? The literal interpretation would be that temperatures have been increasing as a quadratic function.
The Y axis measures velocity of warming (Δtemp/Δtime). The increase in velocity over time represents acceleration of warming. The surface temperature of the planet is increasing faster now on average than a century ago. Or that is what the data says. The graph shows that most of the acceleration comes from a decrease in cooling. The planet just doesn’t cool down as it used to.
It stands to reason that there is more water vapor in the air in a warmer world than a cooler, hence drier one. That alone, IMO, could explain decreased cooling.
Having lived in hot, humid places and cold, dry ones, I’ve experienced this personally.
I noted same in 80s grey-type “MW” pattern in Southern Africa’s rainfall in Mozambique [54 year cycle], Botswana [60-year cycle] and South Africa [66-year cycle].
Dr. S. Jeevananda Reddy
Normally, I like your writings and analysis, Javier.
Only this time, you open with assumptions while disavowing assumptions.
Assumption A) Every possible influence on temperature is well known.
Assumption B) Every possible cause of cooling and warming allows analysis to initiate with warming since 1850.
Yes, A & B are related, but they are not interchangeable.
All that a cooling event requires is an interruption of incoming energy or a massive cold influx or both.
When that incoming energy interruption ceases, or the cold influx ceases; warming will initiate until Earth’s temperature matches incoming energy levels.
Are these influences known? No.
Speculation can cite solar system dust clouds blocking sunlight or massive ocean turnover, but that doesn’t make them so.
In any case, CO₂ is a very poor candidate for causing global warming. Other speculative ideas may be potentially better candidates.
Only time will tell.
Hopefully, climate science recovers sufficient scientific rigor and wisdom to accurate identify and track all influences over many cycles of cooling and warming. Maybe, just maybe, climate science will at some point in the future be able to recognize climatic signals of global cooling, the deadly side of climate.
Obviously we only have a few decades of data for many important things for climate change, and for some only a few years (like Argo). However I think we have a good idea of the type of things that could warm the Earth’s surface for several centuries by the amounts we are measuring. When it is finally solved I am sure that while the exact mechanisms might be unknown to us now, the cause isn’t. We are not going to discover a new source of energy capable of warming the Earth and unknown to us.
One of the large contributors to the “60-year cycle” is the Pacific Decadal Oscillation, or PDO. Now, a century of records won’t give anyone a good picture of a 60-year cycle. But some tree-punchers collected tree cores from around the Pacific Rim and came up with a time series of the PDO back to 1600. Here’s the paper:

https://journals.ametsoc.org/doi/full/10.1175/JCLI3602.1
and here’s the money graph:
Hope it shows up….
Rather than treat it as a cycle, it’s more fun to treat it as a sequence of “phase shifts” from warm to cool and back, with shifts occurring every few decades. I got my two cents in for a study of Alaskan climate shifts:
https://irma.nps.gov/DataStore/DownloadFile/468891 page 50, or
https://irma.nps.gov/DataStore/DownloadFile/493831 page 54.
Here’s a list of phase durations, between shifts, i.e., half a “cycle”…
Table 6. NP/PDO regime shifts since 1600
Regime shift
1627
1695
1762
1806
1833
1853
1922
1947
1976
Average Duration, years (remember, these are half “cycles”)…
68
67
44
27
20
69
25
29
44
From the report, “NP regime durations have ranged from 20 to 69 years, with a bimodal distribution centered around 28 years and 68 years.”
So if a process whose full duration ranges from 47 to 135 years, and tends to flip randomly between those durations, fits your idea of a cycle, I’m sure you’ll have an easy time predicting when the next flip will be.
Back in the 1970s when I was entering into the field of climatology one faculty wage commented that the only two verified cycles in all of climatological data were those of 24 hour and 365.25 day length.
He was so correct.
The PDO was discovered by a Pacific NW fisheries guy. Where the salmon hung out was definitely cyclical. This was only in the late ’90s, after “climate change” was supposedly “settled science”.
Before then, the science of climatology was in its infancy. Its growth has been retarded by “climate science”, ie computer gaming, such that even now it’s still only at best a tweenager. But more likely a toddler.
Climate science is way beyond infancy. It’s a corpse.
The lurching zombie apocalypse,
No it doesn’t. That is why I did not say it was a cycle. I said it was an irregular oscillation.
Javier,
Fair ‘nuf. Your exact words were “irregular ~ 60-year oscillation”. Since the definitions of oscillation include back-and-forth variations, with or without a regular frequency, your description is apt.
The “you” in my comment was not you, but rather those who overuse the concept and word “cycle”.
“Cycle” means a distinct frequency; “random” is white noise; this is somewhere in between.
The PDO is quasi-random, with, apparently, two preferred time scales (20 and 68 years) of variation. I’m sure a longer record would come up with something a bit different.
A “cycle” to a geologist is generally a quasi-periodic fluctuation in the mathematical sense.
But in my estimation, only if is it more quasi-periodic than quasi-random (if this verbiage makes any sense).
The PDO seems to flip kind of randomly between two states, but on preferred time scales of decades (rather than weeks or centuries).
Also in my estimation, quasi-periodic, or even quasi-cyclic, implies the physics of the process includes some restoring force that would cause an oscillation between states, like the classic weight on a spring. El Nino partially fits this, what with cold pools, warm pools, trade wind reversals, etc. that have physical interconnections. So the occurrence of el Nino sets the stage for the next la Nina, and back again. However, it’s not purely cyclical, since el Ninos need (again, in my estimation and research) a “kicker”, in the form of a westerly wind burst aka cross-equatorial tropical cyclone pair, at the right time of the season (November or April) to get the Kelvin waves going to move the warm pool back to the east. Westerly wind bursts are weather events, and therefore essentially random on our predictive time scales.
So ENSO, aka “el Nino – Southern Oscillation” has cyclical forces but random kickers. That’s why forecasts are, and have been, so awful.
On the other hand, the PDO (where the O is for Oscillation) does not have any cyclical restoring forces, that I know of.
The other side says the earth was in ‘radiative balance’ between 1850-1930 (thick dark arrow), when solar activity was falling, then they blame CO2 instead of the sun’s increasing activity (thick red arrow) afterward.
Compare the 73.4 v2 SSN average between 1850-1930 to the 94.9 average SSN since 1930.
The flat red line at 94 SSN is my decadal solar warming threshold. So the other side calls the earlier time of below average solar activity “in balance”, as compared to the latter time of higher activity, and thinks nothing of ignoring the average energy imbalance from that, about 0.15W/yr, or 1.5W/decade, nor discounting it as the source of 20th century warming.
I haven’t read all this but just as a matter of interest, has anyone calculated the heat output of all the cities of the world (day and night, winter and summer) and removed that from the final global temp figures? I can’t believe it’s not of some significance. Even though it escapes into space, the heat output would be somewhat constant would it not? And of course as population grows so does the output….
EIA says total human energy consumed in 2015 was 168000 TeraWatthours, which converts to 19.2E12 watts by dividing by the number of seconds per year.
The area of the Earth is 5.1E14 square meters.
19.2E12 divided by 5.1E14 gives about 0.0376 watts per square meter. Which is below the geothermal average of around 50 milliwatts per square meter.
Earth emits about 240 watts per square meter of outgoing longwave radiation, so the proportion of outgoing longwave radiation added by humans is
.036 divided by 240 which equals .00015 or 150 parts per million.
For the sake of argument, if you say human energy output is confined to 1 percent of Earth’s surface then the OLR from that 1 percent is .015 of the solar OLR.
That’s why human energy is considered insignificant to solar. If you add human metabolism at 100 watts per person times 7E9 people then you add 7E11 watts, also insignificant.
Thank you…
I was thinking more of the heat island effect of cities which seems to be reflected in the surface temp data. If this is so, why is not satellite measurement picking this up?
Just a though bubble……..
The Little Ice Age, much like a skater accidentally falling through the tin pond ice, experiencing hypothermia, body temperature drops, then is rescued, and the body temperature starts to rise.
It is this observed rising body temperature or metabolic warming trend that people are in angst over.
What do you expect to happen when getting out of an ice age?
Grab a petrie dish, load it up with some or other bug, let it grow, put it in fridge, the bugs wane in number, remove from fridge, temperature rises and bug population explodes.
No mystery save for the cause of the ice ages, which no one has yet been able to explain. It’s the ice ages that are the problems, not the warming of the biosphere when the ice age forcing disappears.
Louis Hissink:
The Little Ice Age was caused by extensive volcanic eruptions that spewed dimming SO2 aerosols into the atmosphere.. It is not a stretch to infer that earlier Ice Ages were simply caused by more extensive volcanism.
That is the claim.
Now, since the LIA is shown by hundred of different papers to be a true, many-hundred year worldwide occurrence between 1350 (beginning the downturn), 1650 (the lowest point) and 1850 (temperatures returning to their year 900 “average”), – NOT as also claimed, a single decade, single country random happening in north Europe – show those hundreds of “extra” volcanoes occurring worldwide between 1350 and 1850.
No, no. Not two or three. The hundreds of extra volcanoes.
Sadly, the idea that “The Little Ice Age was caused by extensive volcanic eruptions that spewed dimming SO2 aerosols into the atmosphere,” does not resist a modicum of data. Ice cores show that the Holocene Climatic Optimum had much higher levels of volcanic activity and SO2 than the LIA.
“does not resist a modicum of data.”
How about considering a feedback mechanism a several stratospheric aerosol injections ….
https://agupubs.onlinelibrary.wiley.com/doi/abs/10.1029/2011GL050168
“Our results suggest that the onset of the LIA can be linked to an unusual 50 year long episode with four large sulfur-rich explosive eruptions, each with global sulfate loading >60 Tg. The persistence of cold summers is best explained by consequent sea-ice/ocean feedbacks during a hemispheric summer insolation minimum; large changes in solar irradiance are not required.”
But that would require you letting go of your ABCD, “its the sun” climate science. And we know that’s not going to happen.
” the Holocene Climatic Optimum had much higher levels of volcanic activity and SO2 than the LIA.”
That may be true, however it had several more W/m^2 available at 65 deg N, so an ice/ocean feedback was unlikely(?), even if we could resolve such a small dip in temps at that time.
Well, sorry. This has nothing to do with the Sun. I have looked at the effects of volcanic eruptions in real data.
https://wattsupwiththat.com/2018/05/10/the-effect-of-volcanoes-on-climate-and-climate-on-volcanoes/
What the evidence shows is short-term effects. Nothing longer than a decade.
All the long-term effects are postulated in computers.
And then we have that the warmer period in the Holocene, the Holocene Climatic Optimum is the period with highest volcanic activity in the Holocene.
Sorry, I am not buying that the LIA was due to volcanic activity. It goes against the evidence. I wouldn’t buy it even if I was buying the CO2 thingy.
“All the long-term effects are postulated in computers.”
As opposed to curve fitting that is.
Javier – models are the best we have, the complex vitual world we have invented runs on them and they are a tad more informative than trying so hard to make the “sun wot do it”, by inventing variable frequency causeless cycles (that must be a zero sum in any case).
As opposed to real science based on laborious gathering of real evidence that can be used to discriminate between hypotheses.
Javier:
I have read your WUWT post on volcanic eruptions, where you initially admit that the solar LIA hypothesis has the problem that the cooling started before some of the solar grand minima started and that the cold periods don’t exactly match the low solar activity periods, then go on to ignore this discrepancy and insist that it WAS due to solar activity and that “IT IS IMPOSSIBLE THAT THE LIA WAS CAUSED MAINLY BY VOLCANIC ACTIVITY”.
You have two major problems with your analysis:
1. We know from large modern eruptions that cooling always occurs because of SO2 injections into the atmosphere, The amount of cooling will be affected by existing temperatures. If it occurs during an El Nino, it will not produce the usual La Nina. If it occurs during a La Nina episode, it will extend the La Nina and/or worsen it. During the LIA, when temperatures were already quite low, the effects of any eruption would have been enhanced, probably leading to increased sea ice formation, glaciation, etc., and albedo changes. Because of the 20 known VEI4 and larger eruptions during the 70 year Maunder Minimum, for example, there would not have been time for significant warming between eruptions to have occurred. Consequently, the eruptions HAD to have caused lower temperatures.
2. Most importantly, as I have previously pointed out, it is IMPOSSIBLE to make proxy measurements of solar irradiance when the atmosphere is polluted with SO2 aerosols, etc. which reduce the flux of atmospheric isotopes reaching the Earth,s surface. Thus, you have no basis for concluding that the LIA was caused by reduced solar activity.
Javier:
I am confused: what is the difference between volcanic SO2 and total SO2? Where else does the SO2 come from, other than from eruptive or effusive volcanic emissions?
The scale on the graph is such that it is difficult to be certain, but it appears that the increased volcanism of the Little Ice age is represented by the second vertical spike from the right.
I see you have a theory but you haven’t researched it. The sulfate in ice cores has a dual origin, either volcanic or from sea salt. The origin can be distinguished by comparison with other sea salts.
Quote ” Ice cores show that the Holocene Climatic Optimum had much higher levels of volcanic activity “. Yes sir. But also, evidence show a high level of geologic upheavals. Why?
Now those stopped after ~2345bce. As found by L Thompson, the Quelccaya saw abrupt extended freezing some 5ky ago, which only started re-melting some 60years ago. That was in the tropics. Was ~5ky ago the start of polar melting, which has lately been accelerating (the less ice remains, the faster that melts).
Astronomer JF Dodwell first put his finger on it, but “the lure of incredible certitude” that the Earth has always been so, dumped him. Time to take a second sober look again?
Got to find the rocks
Regarding Figure 3: It compares a rate of change of global temperature with logarithm of atmospheric concentration, not with rate of change of logarithm of atmospheric CO2 concentration. The correlation would be better if the comparison gets changed towards apples-apples, vs. rate of change of global temperature with rate of change of CO2.
Also, please explain why global temperature and atmospheric CO2 (or log thereof) should be smoothed by different amounts of time (9 years for one, 10 years for the other).
That is correct, it compares the change in the forcing with the effect on the rate of change in the temperature. It is the right comparison if the forcing affects how the temperature changes over time.
The 9-year rate of change is not smoothing, it is the unit of calculation. You can choose 30-year trends, 10-year trends or whatever span you decide. I decided on 9-year trends because a study from MetOffice used that amount and showed an adequate resolution to the changes. The 11.1-year smoothing in solar data is because that is the average duration of the solar cycle, so it is the best smoothing to eliminate cyclical variability. The 10-year smoothing in CO2 isn’t required and has very little effect as the annual CO2 data is quite smooth, but since the solar data is smoothed I went for it for being more comparable.
Regarding Figure 1: What’s up with using linear trend best-fit-lines, as if being ignorant of an accelerating tendency? What’s up with start date later than the start date of HadCRUT4 without explanation for that?
A linear increase of a velocity graph is acceleration, and as the graph says is a 9-year trend, so the first point is for the Jan 1950-Jan 1959 trend, and as the data is very noisy and requires a 4-year averaging the average is 4 years shorter. It is all in the caption of the figure.
I have a theory.
A human being gives off heat at about 100W per hour. There are 7.6 billion people on the planet.
so every 10 people produce 1 kilowatt hour, 24 hours a day.
7 600 000 000
760 000 000
760 mega watts per hour…24/7.
Even though we give off heat, a vast number of people on earth actually need to produce heat directly, using fossil fuels and nuclear to keep themselves warm in the NH Winter. All of that heat eventually makes its way to the environment. Even heat produced by wind power or remote solar would still contribute to the heat load.
No machine is 100% efficient, there is always an element of waste heat. Think of the heat in car motors…
Right now…all over the planet there are tens of billions of engines, motors, pumps, industrial processes and computer circuits…all working away all giving off heat….
I know it’s almost a moronically simple thought…but maybe we’re just ‘heating up’ the planet…with like ‘heat’?
No, compared to the sun; all of mankind and his/her industrial complex is orders of magnitude smaller than the amount given off by the sun. However man and his heaturban island effects may explain some of the surface temp increase data. If UAH doesnt show a new cooling trend starting soon; then we just have to assume that the long term trend coming out of the Little Ice Age is still continuing. It is up to the alarmists to prove that that is not true and instead it is because of CO2. So far they they are losing the argument as they have no proof that CO2 has done anything.
SOMETHING DOESNT ADD UP.
Both the https://www.co2.earth/
and https://www.bloomberg.com/graphics/carbon-clock/
base their CO2 numbers on Mauna Loa.
However as you can see Bloomberg is 1 ppm more AND
CO2earth site has July 2017 number higher than August 2018 even though raw CO2 emissions are up 2% over that period. Furthermore that site has July 2017 as 407.07 and Aug 27,2017 as 404.82 I know the figure drops with photosynthesis but 2.25 ppm in 1 month!!!!!!!!!
There is a seasonal cycle, so August of a year is often lower than July of the previous year.
You should get the data at an official source, like NOAA.
https://www.esrl.noaa.gov/gmd/ccgg/trends/index.html
You can’t have a month’s data before the month is over. There is no August 2018 data until September.
You need to look at all forcings.
jeez
Do you have a better candidate?
Show it.
Javier,
Not a better candidate, but one that js ignored due to conjecture that it js unimportant. There are two sources of heat to this rock we live on, solar and geothermal. We know much about solar and almost nothing about the amount of geothermal energy being put jnto the 70% of our planet covered by water. How much is/has been going into the mix where and when. Not quantified and at present evidently not reliably quantifiable. Perhaps some serious observational data could answer some of the questions about this variable. Assuming that it is inconsequential is not acceptable. “Forcings” schmorsings. Energy in and energy out is how things work. All other variables are modifiers of those two variables and not only do we not really know how those modifiers actually work but we are missing one of the inputs. Entropy is always working to dissipate that energy as it is produced, stored and redistributed but that is really all there is. Co2 is most likely relatively insignificant within the mishmash of intercorrelated modifying variables.
True, but it is difficult to evaluate with so little data about geothermal energy. However it is known it is a small contributor. Most of the exchange takes place at the bottom of the oceans, where the water is extremely cold, and the exchange with the surface can take a thousand years, with the result of cooling the surface, not warming it. It doesn’t look like a good candidate.
Javier
“True, but it is difficult to evaluate with so little data about geothermal energy
however it is known it is a small contributor.” That is an internally inconsistent statement. With so little data how can it be known to be a small contributor? Pure conjecture. That thousand year old water may indeed cool the suface but having been heated by geothermal energy it may cool it much less than it would have. The energy budget does not allow for energy input within our planetary envelope to disapear but only through escape from that envelope into space. Entropy there wants to take it to absolute zero.
visiting a gold mine once
I was surprised to find increasing T so much as you go down
[sorry I lost that graph showing the relationship between T and depth]
It is not. While we have very poor information on how it has changed over the past 170 years, we have good information that it is too small to matter.
https://www.solid-earth.net/1/5/2010/se-1-5-2010.pdf
That is in mW/m². When averaged it is estimated at 0.09 W/m². Really small compared to other forcings.
170 years? What about that 1000 year old water that is now coming to the surface that is warmer than it would have been without geothermal heat? And the thousands of years of geothermal heat absorbed by the oceans before that? And how hot were those heat injections over those thousands of years? That .09 w/m^2 is reals close to Lief’s .1 which he uses to describe the variation in solar energy due to the solar cycles. Of course he says that does not effect the climate either.
But you surely need something better than what you think is a good idea. You need some sort of evidence, right?
Correct! It is not an “idea”. It is a conjecture that would make a much more valuable research project than most of the so called research projects which we fund today.
They have tried that. Total failure.
http://virakkraft.com/Had4_CMIP5_deriv.png
The next hundred years will tell the story. CO2 concentrations are sure to continue their steady increase, and if all the ice in the world melts, or if the long-term temperature trends are barely affected, we’ll know.
My own guess is that those hitting the alarm button will be regarded by the next century’s scientists similar to how we regard doctors who used to bleed patients to reduce a fever. Along the way we’ll have wasted plenty of money, time, and resources on various futile schemes, but we won’t have suspended democracy in order to decarbonize the global economy.
But no matter what the trends show, the True Believers will not change their views. They are all-in, and reversing their position would shatter their psyche.
I think I will try not to ask “what” causes climate change. The more accurate and helpful question seems to be: How does climate change at this time and how long will that last?
Coach Springer:
Climate change is driven solely by the amount of SO2 aerosols in the atmosphere. Since they are of mostly volcanic origin, no prediction of the future can be made .
for $1,000 Alex I( will say what is the sun?)
Javier ==> I am not certain that you haven’t been suckered into using the 1850 start date for your analysis.
I’d like to see you analysis started at the real start of modern warming, not the artificial “beginning of the Industrial Era.”
Kip, if we have problems agreeing with the global surface temperature data since 1850, much less trust can be placed on earlier data that is local or regional in nature, and often proxy data.
Another problem is that a great deal of the warming up to 1790 was undone in the very cold period 1790-1840, so the analysis becomes very dependent on the chosen dates.
Although the uncertainty in the values of the early years is large, I think we have evidence that we got the trends more or less correctly, as the periodicities are present.
Javier we are on the correct path , where as AGW is on the wrong path and the historical climatic record backs this up.
Javier ==> 1790-1840 isn’t just another oscillation? like 1945-1970?
Could be. I haven’t looked at the data because there is no global data for the period. However it was a cooler period due to the coincidence of the Dalton minimum and extraordinary volcanic activity. The combination of lack of good data and extraordinary conditions are far from ideal to extract information about the ordinary cause of the 300-year global warming.
Javier ==> “Although the uncertainty in the values of the early years is large, I think we have evidence that we got the trends more or less correctly, as the periodicities are present.” I’m a little leery of this circular reasoning — your hypothesis is the periodicities –so you can’t rely on them to verify the data — the data have to verify your hypothesis. If you periodicities don’t work back to 1750-1700- 1650 then I think you have a problem.
Maybe not insurmountable, but surely a problem.
Actually the periodicities are not part of my hypothesis because there is no hypothesis in the analysis for this article. It is just observation. Analysis of temperature velocity and comparison to CO2 and solar variability.
The periodicities just show up and should not be ignored as they provide information. In reality to postulate an agent I just need something that has been increasing between 1850 and 2018 more or less continuously, and solar activity fits the bill. Nothing says that whatever is warming the surface of the Earth needs to reproduce the oscillations. That is again another assumption. That periods of low solar activity correspond to periods of negative rate of change in temperature is a plus.
“This oscillation is also unlikely to have a solar origin, as there is no 60-year solar periodicity.”
Yet you cite Mazzarella, A., & Scafetta, N. (2012) in disagreement with Willis’ periodicity analysis. Is that double-speak?
https://arxiv.org/ftp/arxiv/papers/1206/1206.5835.pdf
“…the analogy of a man walking his dog.”
Neil deGrasse Tyson also used this analogy for a TV special to explain climate. It does have a serious flaw as an analogy. In the real world, climate is subordinate to weather. That is, weather is an independent variable while climate (an average) is a dependent variable. In the dog walking analogy, the man is actually (usually) determining the general path (independent variable) and the dog is adding noise (an additive independent variable that is related to the man’s path.) So, the resultant of the two is a dependent variable determined principally by the man, with a minor influence from the dog, depending on the length of the leash (and perhaps the age of the dog). That is to say, while walking along the beach (as was the illustration with Tyson) the man chooses a path that keeps him out of the surf, but allows the dog to approach it. However, at the end of the trip, the man decides to walk back to the car and the dog has no choice but to stay within a leash-length of the man. Put another way the man ‘wags’ the dog, while weather ‘wags’ the climate.
That depends on the dog. Some dogs walk their owners.
Too much dog, not enough man!
I did acknowledge “usually.” however.
Greg has pointed out that if you want to see the effects of climate forcings on the world mean temperature, dimensional analysis tells you that you need to look at the first difference (or rate of change of) temperature rather than the raw temperature itself.
A glance at the plot presented by Greg here clearly shows a persistent ~9.1-year signal in the first difference of the world mean temperature that is present for two separate 45-year periods. The first is between about 1870 and 1915 and the second is between about 1960 and 2015. There is a 45 year period between 1915 and 1960 where the 9.1-year period is absent. Any model needs to explain why this is the case.
First – The ~ 9.1 year period is just what you would expect if there was lunar tidal forcing.
The two dominant cycles in the application of lunar tides to the Earth’s surface are:
a) the variation in latitudinal force associated with 18.613-(tropical)year Lunar Nodal Cycle (LNC) that is caused by slow retro-grade precession (with respect to the Vernal Equinox) of the tilted lunar orbit.
b) the variation in the strength of the force at a given location associated with the 8.847-(tropical)year Lunar Apsidal Cycle (LAC) caused by slow pro-grade precession (with respect to the Vernal Equinox) of the perigee of the lunar.
The fact that the two lunar precessions move it opposite directions means that the cyclicity in the combined lunar tidal forcing takes place at a periodicity that is equal to the harmonic mean of 8.847 years and 18.613 / 2 = 9.307 years i.e.
2 x (9.307 x 8.847) / (9.307 + 8.847) = 9.071 years ~ 9.1 years.
Second – There is a secondary forcing term in the lunar tidal forcing that is associated with the changing strength of the tidal forces acting upon the Earth caused by the 20.2937-year Perigean New/Full moon cycle. The strongest tidal forces acting upon the Earth occur when either a New or Full moon is nearest to the Earth (i.e. when it is at a Perigee distance of ~ 356,000 km).
If you superimpose the 9.1-year lunar forcing term with half the Perigean New/Full moon cycle (i.e. 20.3937 / 2 = 10.1469-years), you get a natural reinforcement of the 9.1-year pattern in the first difference of the world’s mean temperature for roughly 45 years, followed by a 45-year period where the 9.1-year pattern disappears (it reverts to a quasi bi-decadal periodicity), followed by a reappearance of the 9.1-year pattern for another 45 years.
This is in fact what appears to happen in the curve for the first difference of the world’s mean temperature.
Hence, a simple lunar tidal forcing model can be used to explain much of the decadal warming and cooling in the world’s mean temperature at scales longer than about 7 years. [Note: It does not necessarily explain the slow centennial scale warming since the last mini Ice_age.]
Note: [I am working on a paper to publish my 2014 finding that the Perigean New/Full Moon cycles act as a forcing upon the world’s mean temperature by triggering Pacific Penetrating Madden Julian Oscillations that trigger moderate to strong El Nino events.]
Err Ian, look at the figures. All of them show “the first difference (or rate of change of) temperature rather than the raw temperature itself.” I guess this is a case where we all agree on that.
Personally I don’t doubt the Moon can affect temperatures through tides, and in fact I discussed the issue of the lunar ~ 9-year cycle in the article linked about the 60-year oscillation in AMO. But I don’t see how lunar cycles could cause the observed warming for the last 170 years, which is what this article is trying to explain.
Javier,
I was not criticizing your arguments. I fact, I admire your courage to try and wipe the slate clean and see what we really do and do not know. In addition, I am very grateful that you have a thick enough skin to put up with so many people trying to criticize your work. You truly are someone who deserves our (collective) praise and thanks for all that you do.
I believe that the Moon primarily influences the world mean temperature through its control over the rate at which the Earth warms and cools. This is, in fact, a slight modification of one of the three options that you propose at the start of your article:
“The transfer of heat within the system is changing. This is the basis of some hypotheses for a reduced vertical exchange in the ocean, or for changes in the oceanic currents that redistribute the heat.”
The chief way that it does this is that it changes the rate at which thermal energy in the oceans and atmosphere are transferred from the tropics to the higher latitudes. It does this by changing the frequency at which El Nino’s occur to La Nina’s.
Note that in this argument it is important to realize [the obvious statement] that conditions that favour La Ninas necessarily preclude the conditions that favour El Ninos. However, this does not mean that the underlying driving mechanism for El Ninos is the same as that for LA Ninas.
The dominant cycle observed for La Nina’s is an 11-year cycle associated with the upwelling of cool deep ocean water in the Humbolt current. The obvious forcing candidate for this cycle is the solar activity cycle. Since conditions favoring La Ninas preclude conditions favoring El Ninos, this automatically means that there is a suppression of El Nino conditions roughly once every ~ 11 years. This is why El Ninos are primarily observed around the times of solar minimum. It comes about not because of a preference for the El Nino forcing mechanism to occur at solar minima but because precluded at occurring at solar maxima (which favour La Nina conditions).
El Ninos are triggered by Pacific Penetrating Madden Julien Oscillations (PPMJOs) that set off westerly wind bursts in the western equatorial Pacific Ocean.
MJOs are a manifestation of Kelvin-like gravity waves propagating along the Coriolis equator. Most of the time these Kelvin-like waves are de-coupled from the convection/precipitation in the Earth’s atmosphere and they move along the Earth’s equator with an easterly speed of about 15 m/sec. This closely matches the easterly speed of the sub-lunar tidal peak along the Earth’s equator, when measured at the same time each day. This strongly implies that the Kelvin-like wave that constitutes an MJO is just a lunar-driven upper atmospheric gravity wave that is formed by the slow movement of the sub-lunar tidal peak towards the east (when measured at the same time each day).
[When observed at the same time each day, the Moon moves roughly 12 degrees per 24 hrs towards the east. This means that when observed at the same time each day, the sub-lunar tidal peak moves at an easterly speed of (12/360) * 40075 km / (86,400 secs) = 15.46 m /sec.]
However, there are times when this propagating Kelvin-like gravity wave couples with the convection/precipitation and it slows down to a speed of ~ 5 m/sec. This takes place above the sections of the Earth’s equator between East Africa and the western Pacific Ocean. This modified atmospheric/oceanic wave of precipitation is what is known as a Madden Julian Oscillation (MJO).
This means that El Ninos conditions are being forced by the 8.85/4.43-year cycles of the lunar tides (Note that the tidal influence of the 8.85 year LAC cycle dominates over the 18.6/9.3 LNC cycle near the Equator), modified by the fact that La Nina conditions are being forced by the 11.1-year cycles in solar activity. Hence, you get a natural long-term modulation of the 9.1-year lunar pattern by a 45-year cycle, since:
(8.85 x 11.1) / (11.1 – 8.85) = 43.7 years ~ 45 years
Just to drive home Javier’s point that the long-term climate forcings are more complex than most people think, here is a little more complexity.
The ~ 45-year half modulation cycle of the first difference in the world mean temperature over the last 150 years is most likely just a manifestation of the 88.5-year Gleissberg cycle that is naturally present the variation of long-term lunar tidal forcing caused by the Perigean New/Full Moon Cycles {note that these are the long-term lunar tidal forcing cycles that are best aligned with the annual (seasonal) solar cycle].
This means that on multidecadal to centennial time-scales you have the 88.5-year Gleissberg cycle in the lunar-induced warming and cooling of the Earth which are present with the (lunar-driven) 60-year in the world’s trade winds. Hence, it should be expected that poorly resolved long-term temperature cycles look like they are a mish-mash of the 60 and 88.5-year cycles since (88.5 + 60) / 2 = 74 years. We need another 150 years of climate data to solve this puzzle.
You might be interested in my latest paper:
Ian Robert George Wilson* and Nikolay S Sidorenkov, A Luni-Solar Connection to Weather and Climate I: Centennial Times Scales, J Earth Sci Clim Change 2018, 9:2
https://www.omicsonline.org/open-access/a-lunisolar-connection-to-weather-and-climate-i-centennial-times-scales-2157-7617-1000446.pdf
Ian, thank you for your kind words.
I believe that what you say about the solar-ENSO connection is not only reasonable and explanatory, but it is also supported by evidence. I recently wrote about it:
https://wattsupwiththat.com/2018/07/05/solar-minimum-and-enso-prediction/
The probability that just the change of Niña to Niño at the solar minimum since SC19 is due to chance is lower than 1 in 4000, and the probability is even lower if we include the Niña when solar activity increases, but it gets difficult to calculate.
It is clear that solar activity affects ENSO, so your studies go in the right direction.
Those that reject solar variability as an important climatic factor face an uphill battle, as well as those that defend that CO2 is the main control knob of climate.
Good point.
addressed to Ian
I am a great fan of the gb cycle since my first investigation. Although. My latest results show that the last gb cycle ending in 2014 was 86.5 years.
Click on my name henryp to find out more.
“There is a 45 year period between 1915 and 1960 where the 9.1-year period is absent. Any model needs to explain why this is the case.”
Because large volcanic eruptions are also absent during that period.
Lgl,
The tidal stresses that cause the changes in vulcanism are being driven by the lunar tidal massaging of the Earth. You are talking about a symptom and not a cause. However, it is a symptom that may reinforce the cause.
Ian
Yes, but weren’t the tidal forces equally strong 1915-1960?
My pet hyp. is that the cause is the planets accelerating the moon and thereby affecting Earths rotation. Some skilled person (you:) should look into that.
Please read my paper:
Wilson, I.R.G., 2011, Are Changes in the Earth’s Rotation
Rate Externally Driven and Do They Affect Climate?
The General Science Journal, Dec 2011, 3811.
http://gsjournal.net/Science-Journals/Essays/View/3811
Thanks, interesting.
Must say that I agree with Javier that we are globally cooling from the top [lats] downward
looking at energy coming in
i.e. , for example, T max
problem is that in both cases, up until now [?]
i.e . arctic and antarctic,
we have a few natural factors going against
arctic: movement of the inside of the earth, going more north east
antarctic: volcanic activity
It would be nice if we could also see the curve representing the strength of the AMOC over the last century or two.
Only been observed continually since 2004.
http://nora.nerc.ac.uk/id/eprint/503128/
The change in temperature trends representing the North Atlantic ocean and AMO reflect the changing strength of the AMOC.
http://www.rapid.ac.uk/rw/images/diagrams/n16_1_temp_anomaly_plot.png
Observations, inferences, and mechanisms of the Atlantic Meridional Overturning Circulation: A review
https://agupubs.onlinelibrary.wiley.com/doi/epdf/10.1002/2015RG000493
I have not linked any of these specifically directly, but there are many papers on AMOC simulations and models.