By Jim Steele
On May 5, 2021, the Bulletin of the Atomic Scientists published Nicholas Wade’s article “The Origin of COVID: Did people or nature open Pandora’s box at Wuhan?” After detailing all evidence the article suggested COVID-19 was created at the Wuhan Institute of Virology. Likewise the former CDC director and politicians had previously warned of the human-engineered virus. Furthermore a Chinese virologist from Wuhan, Dr. Li-Meng Yan, bravely disagreed with her government’s denial, publishing that COVID‑19 was purposively engineered. Despite the “lab leak” theory’s increasing probability, it had first been quickly dismissed by virologists and the media. Why?
In 1982 Nicholas Wade had also co-authored the book Betrayers of the Truth: Fraud and Deceit in the Halls of Science. Virtually everything he warned about, can be seen regards the COVID deceit. Wade is not an anti-science conspiracy theorist. Wade wrote for the preeminent scientific journals Nature and Science and was the New York Times’ editorial science writer from 1982 to 2012. Wade simply warned modern science is not free of fraud and its self-policing safeguards can be easily corrupted.
Unlike Darwin or Galileo, modern careerist scientists are pressured to produce certain results to ensure their income and status. Although many resist such pressures, history is littered with those that couldn’t. Regards COVID-19, Dr. Peter Daszak, president of EcoHealth Alliance, depends on government grants and donations. EcoHealth Alliance’s slogan is A World Without Pandemics. They controversially believe by making natural animal viruses more infectious to humans in the lab, science can learn how to prevent future pandemics. Thus if they dared admit their engineered virus had escaped the lab causing 3 million deaths and destroying businesses, their funding would collapse.
Similarly other virologists feared attributing the pandemic to an escaped engineered virus would also restrict their research and funding. So Daszak and others immediately labeled the “lab escape theory” a conspiracy theory. Likewise Dr Fauci, a longtime proponent of such “gain of function” research, labeled his critics “anti-science”. This same tactic is used by climate scientists to defend their funding. They label skeptics “deniers” and “peddlers of misinformation”. In contrast, they portray themselves as delivers of gospel truths. It is precisely such elitism Wade had warned about. Although elites may have gained their status for good reason, to maintain their status, they are not immune from fabricating data.
Wade documented how the uncritical acceptance of elite opinions has led to bad science. For example the story of Hideyo Noguchi, once hailed as the greatest microbiologist since Louis Pasteur. When he died in 1928, Noguchi had published 200 papers claiming he had identified the causes of yellow fever, polio, rabies and others. Although his work proved wrong 50 years later, he had never been challenged, simply because he worked for the most prestigious research institute of his time.
In the 1970s, John Long was exalted for developing tissue cultures to study Hodgkin’s disease, a feat no other could accomplish. Although it was later shown Long’s cultures were from Owl monkeys and not humans and his data all fabricated, his publications had sailed through peer review because he worked for the prestigious Massachusetts General Hospital. It took Long’s more honest assistants to point out falsified data. Japanese anesthesiologist Yoshitaka Fuji fabricated data in a whopping 172 peer-reviewed papers starting in 1993. In 2015, the editor of the most prestigious medical journal the Lancet, suggested Half of Science Is Wrong. Similarly, in 2015 Stanford University epidemiologist John loannidis echoed much of what Wade wrote in 1982. In the paper Reproducibility in Science: Improving the Standard for Basic and Preclinical Research the authors wrote “there is compelling evidence that the majority of these discoveries will not stand the test of time. To a large extent, this reproducibility crisis in basic and preclinical research may be as a result of failure to adhere to good scientific practice and the desperation to publish or perish.”
The take home message is all scientific claims, and all elites, must be critically questioned. Whether Daszak and Fauci, or climate scientists Michael Mann and Kevin Trenberth, elite scientists are not totally trustworthy despite media narratives. Mann hired a public relations person to shape his public image. It’s the skeptics who ensure the scientific process is not short-circuited by power hungry elites who try to prevent further debate.
For example in climate science, emails exposed elites like Phil Jones, Thomas Wigley and Ben Santer who discussed how to “adjust” observed temperature trends to better supported their CO2 theory. Warming in the 1930s and 40s similar to today, suggested a naturally oscillating climate. So in 2009 they wrote, “It would be good to remove at least part of the 1940s blip, but we are still left with why the blip”. Accordingly, much temperature data has since been adjusted as exemplified in the Death Valley temperature trends from the US Historical Climate Network. They removed the observed “warm blip” (black line below) to create a trend (red line) that better fit their theory.
Accordingly the motto of the oldest scientific institution is Nullius in Verba: Take no one’s word!

June 13, 2021
Jim Steele is Director emeritus of San Francisco State University’s Sierra Nevada Field Campus, authored Landscapes and Cycles: An Environmentalist’s Journey to Climate Skepticism, and proud member of the CO2 Coalition
Hard to make unwarranted adjustments while the satellites are watching.
No problem. Satellite data are usually highly indirect, and need a lot of complex processing. Opportunities for adjustments abound.
UAH only makes warranted adjustments, not unjustified ones to cool the past.
I too have faith, John.
Just facts. No faith required.
All UAH adjustments are open and explained.
UAH have always been under huge pressure
As are those of RSS. Yet both sets disagree with one another, and both sets are frequently revised by their producers, sometimes creating pronounced differences in trend. Revised versions of the satellite data sets typically create much bigger differences than the relatively minor adjustments made by surface sets.
RSS caved to the Borg Team.
Warranted is an opinion. Keeping the data AND processes open to criticism is what makes UAH measurements part of science. ALL climate data sources should be so open.
Where is the UAH source code made available so that we can properly review and replicate their work?
Note that as point of comparison GISS makes their source code available here. Everything you need to replicate their work is included. It will even download the necessary input files for you. When I run it on my machine I get exactly the same result as what GISS publishes. This is the level of transparency I’m looking for from UAH.
The Dominion version of data “adjustments”.
The satellite datasets have plenty of adjustments as well and the UAH and RSS datasets, which are both derived from the same satellite instrumental data disagree more than the surface temperature datasets. Here is Carl Mears from RSS saying the surface temperature datasets are more accurate than the satelite datasets
https://youtu.be/8BnkI5vqr_0
Fortunately Berkeley Earth produced an independent analysis using their own homogenisation procedure. Gives the same basic result as the existing datasets. Independent replication – a cornerstone of modern science.
BE’s adjustments are as unwarranted as HadCRU’s and GISS’. Please read Judith Curry on that score.
Has prof. Curry researched homogenisation, or just written opinions on a blog?
If you change time of observation, or move a station, or change an instrument etc. there will be problems with the data that need to be corrected if you actually care about doing good science.
Having been part of the team, she is thoroughly familiar with its procedures.
Thank you for the answer to my question – I wasn’t aware of that.
However, as I said, the blog post mentioned is not questioning homogenisation in BEST.
If you actually care about doing good scince you recognise that the data is what the data is. You may have plausible reasons for applying adjustments but you do not “correct” the data unless you have knowledge of a specific, quantifiable error. And once you start adjustng data to allow for this and that, you are entering the realm of prediction.
They do have plausible reasons. There is a good overview paper on the basics by Blair Trewin here:
https://sites.stat.washington.edu/people/peter/593/Trewin.pdf
If you only look for reasons that cool the past, that’s what you end up doing.
Do Berkeley Earth look to only cool the past? Using their automated algorithm? Their code is all in the public domain, can you find where they have coded it to only cool the past?
BTW There are technical reasons for not altering current temperatures but to make adjustments to the past. It doesn’t actually make any difference to the anomalies (mathematically there cannot be a difference).
Similarly if you don’t have data you don’t have data. Period. ‘Extrapolation’, ‘interpolation’, you say tomahto, I say tomayto … it’s still fiddling the figures.
And the figures are largely meaningless. I can vary my daily temperature readings by 0.2° simply by moving the sensor from one end of the windowsill to the other. (I’ve done it using calibrated pairs). And the climastrologists are expecting mankind to panic over temperature differences ‘calculated’ (read ‘invented’) to two decimal places.
In the real world, who cares?
Thank you! As an Engineer for over 20 years, I never in my entire time of working in the Aerospace industry have ever come across a time when data was ‘adjusted’ or ‘manipulated’ to fall within the required or desired outcomes. Data is always data and never manipulated. Once you do that, its no longer valid data.
Now, you can fit your data to meet your desired outcomes depending on how you set up your upper and lower limits or how aggressively you want to smooth everything out but as you said, the data is what the data is. There is no adjustment. If you don’t like the results or think something was off, you adjust the test and the parameters for taking data and run it again. From there, you leave it up to the analysts and chief engineers to figure out what they want to do with it and how they want to present it. However, the data is what the data is. Period. Except it seems when it comes to climate related data.
The BIG problem is that there continues to be positive adjustments to recent data when the need for Time of Day and other adjustments disappeared in the last 25 years with the advent of computerized temperature measurements. The only valid adjustments are for the Urban Heat Island effect (negative, not positive), relocating stations (both positive and negative), and missing data (both positive and negative). So why do adjustments average out to be always positive for recent data? It would take extraordinary reasoning and evidence to support that, but no reasonable explanation has been made.
“The BIG problem is that there continues to be positive adjustments to recent data when the need for Time of Day and other adjustments disappeared in the last 25 years with the advent of computerized temperature measurements.”
And Tony Heller shows those adjustments are not relevant.
DM I challenge you to try to scratch the surface of the surface temperatures, like you do with the co2 cycle.
What would be the point as most of the denizens here can’t even cope with something as simple as conservation of mass and bluster away from the discussion and then run away?
https://wattsupwiththat.com/2021/06/13/betrayers-of-the-truth/#comment-3268805
I actually have studied it a bit, which is how I know that Prof Curry’s blog post that has been raised is not objecting to adjustments to the data, but to a subsequent attribution exercise performed using the data. Look at all those downvotes got those that have pointed that out.
As a second example, several people have pointed out that Prof Curry’s blog post is not criticizing the homogenisation adjustments to the BEST dataset, as claimed, but a subsequent attribution exercise using that dataset.
Has anyone admitted that error? No, just a lot of downvotes for the posts pointing it out.
Judith Curry approved Berkeley Earth’s methods. In fact, she helped develop them.
http://berkeleyearth.org/static/papers/Methods-GIGS-1-103.pdf
That’s why her pointing out BE’s issues was so damaging.
https://judithcurry.com/2012/07/30/observation-based-attribution/
Isn’t that a different topic (attribution)?
Please read her blog post.
I did, AFAICS it is about a study on attribution by the Berkeley Earth group, not about the adjustments to their instrumental dataset. BE have done more than just the temperature datasets.
Can you give a quote from the article, in case I have missed something?
Her first paragraph:
Muller bases his ‘conversion’ on the results of their recent paper. So, how convincing is the analysis in Rohde et al.’s new paper A new estimate of the average surface land temperature spanning 1753-2011? Their analysis is based upon curve fits to volcanic forcing and the logarithm of the CO2 forcing (addition of solar forcing did not improve the curve fit.)
‘Their analysis is based on curve fits to volcanic forcing…”
as I said the blog post is disagreeing with an attribution exercised based on the BEST dataset, not the dataset itself, the adjustments to the data do not involve curve fits to volcanic forcing in any way.
So, can you quote a section from the blog post that is actually about the homogenisation adjustments in BEST?
That is JC lamenting about her collogues position on attribution. She developed, approved, and signed her name to the official methods paper which appeared 1 year after that blog post.
Judith says nothing about BE’s data processing in that post. There is nothing about adjustments. She takes issue with Muller’s statements about attribution.
JC on adjustments to Oz “data”:
https://twitter.com/curryja/status/1232368269207560193
From last year.
Do you admit that the blog post that you raised does not in fact question the homogenisation adjustments to the BEST dataset?
Did you look at the reply from Zeke Hausfauther that points out that she is factually incorrect (and the thread below it pointing out that BEST uses the raw data, not the adjusted data)
Somewhat ironic, on a thread called “betrayers of the truth” that you raised one blog post that wasn’t actually critisising homogenisation adjustments and then when your error was pointed out, rather than admit it you just go to google again to find a tweet that does criticise homogenisation, but which was directly refuted by replies from Hausfather and Rhode (of Berkeley Earth).
This tweet was quite funny,gently ribbing Prof. Curry that she should have known the algorithm used the raw data as she helped design the procedure ;o)
https://twitter.com/hausfath/status/1232370067360190464
What was Berkeley Earths method for cooling the Early Twentieth Century. Why would they show the 1930’s as being insignificant, when all the regional surface temperature charts show just the opposite?
They should justify disappearing the hot 1930’s. They can’t do it. The only actual temperature records don’t agree with Berkeley Earth’s interpretation.
BE’s time series for the early 20th century isn’t significantly different than that provided by other groups. I’m curious though…can you provide us a global mean near surface temperature dataset which you feel is the gold standard for truth that all others should be judged? I’d like to review it and see just how much BE’s dataset is different.
Here’s the U.S. surface temperature chart, Hansen 1999:
It’s temperature profile doesn’t look anything like the bogus, instrument-era Hockey Stick charts. It shows the 1930’s to be just as warm as today (1998 being equal in temperature to 2016). Hansen said 1934 was 0.5C warmer than 1998. I don’t see that reflected in the bogus Hockey Stick chart profile.
All the other regional temperature charts from around the world have temperature profiles that resemble the U.S. chart. None of them resemble the bogus Hockey Stick chart profile.
Can you explain the reason why that is?
Can you post a global mean temperature chart from a dataset you trust?
Lol -5 eh? Isn’t Berkeley Earth popular here anymore? I can’t imagine why…
Up to minus 18. You’re going for the record!
Yes -18 for mentioning a dataset and being in favour of independent replication of results when people have doubts. Doesn’t say much for the denizens of this blog!
Plenty of upvotes though for posting an article by Prof Curry that doesn’t actually criticize homogenisation adjustments, as you calimed. Plenty of upvotes as well for posting a tweet by prof Curry that does criticise homogenisation adjustments, but which was followed by a thread of tweets from Berkely Earth team showing that the criticism was factually incorrect.
Have you considered that your obnoxious attitude may be responsible for some of your downvotes?
Have you considered that the response to the reasonable points I have made may contribute to my progressively more combative than usual attitude?
I rest my case.
Let me tell you about BE’s work. As you may know Mr Mosher was involved in their analysis and when challenged on specific Stations that were obviously wrong he said and I copied it for posterity
“Steven Mosher | July 2, 2014 at 11:59 am |
“However, after adjustments done by BEST Amundsen shows a rising trend of 0.1C/decade.
Amundsen is a smoking gun as far as I’m concerned. Follow the satellite data and eschew the non-satellite instrument record before 1979.”
BEST does no ADJUSTMENT to the data.
All the data is used to create an ESTIMATE, a PREDICTION
“At the end of the analysis process, the “adjusted” data is created as an estimate of what the weather at this location might have looked like after removing apparent biases.
This “adjusted” data will generally to be free from quality control issues and be regionally homogeneous. Some users may find this “adjusted” data that attempts to remove apparent biases more suitable for their needs, while other users may prefer to work with raw values.”
With Amundsen if your interest is looking at the exact conditions recorded, USE THE RAW DATA.
If your interest is creating the best PREDICTION for that site given ALL the data and the given model of climate, then use “adjusted” data.
See the scare quotes?
The approach is fundamentally different that adjusting series and then calculating an average of adjusted series.
in stead we use all raw data. And then we we build a model to predict
the temperature.
At the local level this PREDICTION will deviate from the local raw values.
it has to.
“
“Yes -18 for mentioning a dataset and being in favour of independent replication”
I would describe it as independent bastardization of the historic temperature record.
Birds of a feather.
DM,
Sorry, but you lack the skill to comment this way.
Try this. In Australia, the authorities encourage use of their adjusted temperature data set ACORN-SAT based on about 120 weather stations going back 50 to 111 years or so. It is easily possible to select a different batch of 120 stations to be processed in similar ways to show no overall warming since the chosen start date of 1910. Berkeley Earth makes its own selection of weather stations. There is no God to decide if they selected wisely. The whole global effort is a muddy mix of poor signal to noise ratios, cherry picking, peer pressure, commentary by inexpert people, and possibly worst of all, a determination by many authorities to ignore critics who question their motivation, which is more politico/economic than scientific.
You are welcomed to use one hand to clap your appreciation of this horribly performed excuse for science. Why do you do it? Geoff S
As well they should be. However, they provide wider and denser coverage. On the other hand, they are measuring different layers of the troposphere.
As you are here, on the other thread, I supplied the uncertainties for dC are Ea and confirmed that they are way too small to affect the outcome. I would appreciate your reply on that thread.
Here is the link to the relevant comment
https://wattsupwiththat.com/2021/06/11/contribution-of-anthropogenic-co2-emissions-to-changes-in-atmospheric-concentrations/#comment-3268033
As a matter of fact, I have decided to do a deep dive into your claims, so I have saved your pertinent comments as well as those by Anders. I will be examining other’s estimates and uncertainties to see how they compare to yours.
I have not previously looked at mass balance with respect to CO2, and I didn’t have time to reply to comments (168 from you alone!) and set off on another research project at the same time. However, since it seems that it is all you had in your hand-basket, and actually didn’t have much to criticize about what I had actually done, I think it warrants looking into. Don’t expect an immediate reply, however. I’ve gotten a little behind on other things and need to get caught up on them.
A couple of my favorite sayings are, “Be careful what you wish for. You may get your wish!” and “When the gods wish to punish us, they grant us our wishes.”
Most of us have lives to lead.
168 posts from one commenter suggests a paid position spewing propaganda.
It isn’t worth the time invested to respond to the baby pea gallery regarding their repetitive faux claims and twisted logic.
Which works well with the “do not feed the trolls” as that is what they desperately desire.
Let them have endless negative votes and no other recognition of their comments.
Ignoring mass balance, is like focussing only on big cash flows when your company is steadily going bankrupt. “But, but look at my cash flow, my company must be healthy!”
You don’t need a deep dive. I gave a link to the paper. Mass balance completely refutes both of your articles and is very straight forward. You are just running away from having to admit that you are wrong. Go ahead, it is your loss.
“I have not previously looked at mass balance with respect to CO2”
So you have published two blog posts suggesting the worlds carbon cycle researcher are completely wrong on the most basic of issues, *without* looking at a simple but fundamental concept such as conservation of mass?
monumental hubris.
I wouldn’t have needed to make so many posts had you been more willing to engage with what is a very straightforward question.
By the second “they” I meant the satellites. The third “they” I was comparing surface stations and satellites.
Am I seeing in the presented graph purported average temperatures variations constructs down to 1/100th, even down to 1/1,000th of a degree?
Do they sell these thermometers on Amazon, perchance?
No, statistics – look at the formula for the standard error of the mean.
“No, statistics – look at the formula for the standard error of the mean.”
Not a popular subject with Clyde. In fact, most inconvenient…..
Which is just the old-fashioned name for the preferred term—standard deviation.
No, the standard error of the mean is the standard deviation divided by the square root of the number of observations. It gives the spread of independent sample means, whereas the standard deviation is a measure of the spread of the population itself.
The division by root-n is the reason you can quote a mean with greater precision than that of the individual observations. This is one of the things that make averages useful – the noise in the observations averages out towards zero as the sample size increases.
Read the GUM.
Dividing by the square root of n is only valid for an average of n repeated measurements of the same quantity.
Completely contrary to averaging global temperature that change continuously.
You cannot reduce uncertainty by averaging.
DM,
Your use of the term “accuracy” implies that there are existing, adequate methods to calculate accuracy, not to be confused with precision.
There are no conclusive ways to determine accuracy of past temperatures because their time has passed and cannot be created again for deeper examination.
The current problem is caused by people who adjust data without adequate explanation. Both the RSS and UAH people have made adjustments. Some appear more justified than others in the eyes of people with preferences.
Sad to say, such people backing one horse or the other are almost always less qualified to comment than the data managers and they should put up or shut up because they do harm, not good, with ignorant comments. Geoff S
Good to see the Marsupial commenting here. He may not take the balanced view but that’s not his job. His challenges are precise and demand a precise answer.
I have long seen the comments on both sides of this become an echo chamber in each backyard. It would be good to get rid of the interminable fluffy stuff and have a real debate. I’m not on your side, Dikran, but thanks for coming.
Thank you.
I’m off now, I only really popped in to address the carbon cycle issues. Sadly I didn’t get answers. The mass balance analysis (along with a number of other lines of evidence) rule out the rise being natural, and nobody could identify a flaw in the analysis, nor could they acknowledge their inability to do so. If anyone wants to discuss that topic via email, feel free. The address is on the pre-print of the paper
http://citeseerx.ist.psu.edu/viewdoc/download?doi=10.1.1.713.6770&rep=rep1&type=pdf
But it’s easy to manipulate the data before satellites, as the graph shows.
Yup. If you’re limited in ability to warm the present, cool the past.
Yes, the graph shows the data manipulation fraud.
The Data Manipulators ought to be criminally prosecuted for the damge their lies have done.
It’s also easy to manipulate the temperature record in the satellite era, too, as demonstrated by the criminal Data Manipulators downgranding 1998, so they could have a “hottest year evah!” talking point going forward.
We all saw what they did, but the Lie still officially stands even though the satellite chart shows it is a lie.
They are lying in plain sight and expecting us to accept their lies as facts.
It all goes back to the hockey stick (even if they try to distance themselves from it)—you can’t have a curve in the handle.
G’Day Kpar,
Didn’t I read in the past few weeks that researchers are saying that the satellite readings are ‘too low’ and should be adjusted? (To match computer model figures.)
(Can’t find it here on WUWT, could have been Climate Dispatch or Physorg.)
None of the above:
https://scitechdaily.com/satellites-may-have-underestimated-global-warming-in-the-lower-atmosphere-over-the-last-40-years/
None of the above – it’s at:
https://scitechdaily.com/satellites-may-have-underestimated-global-warming-in-the-lower-atmosphere-over-the-last-40-years/
And here are the “warranted” adjustments?
JUDITH CURRY, 2015
“The bottom line with regards to the hiatus is all of the data sets except for the new NOAA/NCDC data set show a hiatus (with NASA LOTI being the other data set coming closest to not showing a hiatus).” ~ Judith Curry,
Data Adjustment Timeline (as it appears in the mainstream media):
DATA ADJUSTMENT #1 (Land Temperatures – 2015 (this was the new dataset Curry mentions above))
Global warming ‘pause’ caused by glitch in data
h**ps://www.irishtimes.com/news/world/global-warming-pause-caused-by-glitch-in-data-1.2239199
DATA ADJUSTMENT #2 (Troposphere RSS Temperatures – 2017)
Major correction to satellite data shows 140% faster warming since 1998
h**ps://www.carbonbrief.org/major-correction-to-satellite-data-shows-140-faster-warming-since-1998
DATA ADJUSTMENT #3 (Ocean Temperatures – 2019)
Ocean temperature data shows warming is accelerating faster than we thought
“In the past when [the models and records] didn’t agree so well, part of that was a problem with the observations, not the models,” he said.*
h**ps://www.abc.net.au/news/science/2019-01-11/ocean-warming-accelerating-faster-than-thought-science/10693080
DATA ADJUSTMENT #4&5 (Australian Land Temperatures – 2019)
Heat on Bureau of Meteorology over data records rewrite
The Bureau of Meteorology has rewritten Australia’s temperature records for the second time in six years, greatly increasing the rate of warming.
h**ps://www.theaustralian.com.au/nation/climate/heat-on-bureau-of-meteorology-over-data-records-rewrite/news-story/30c0bc68e582feb2828915e172702bd1
DATA ADJUSTMENT #6 (UK Land Temperatures – 2020)
HadCRUT5 shows 14% more global warming since 1850 than HadCRUT4
https://wattsupwiththat.com/2021/02/21/hadcrut5-shows-14-more-global-warming-since-1850-than-hadcrut4/
ADJUSTMENT #7 (Failed – paper was retracted: Nic Lewis vs Resplandy)
The Oceans Are Heating Up Faster Than Expected
BTW: Scientific American still has this up, with no mention of Lewis or that the paper was retracted. I suppose they were too busy attacking Steve Koonin to have time to correct the record.
https://www.scientificamerican.com/article/the-oceans-are-heating-up-faster-than-expected/
And “POOF !!” Judith Curry’s observation from 2015 is no longer valid.
I probably missed a bunch of other adjustments, but I eventually stopped keeping track of them as what I was seeing made me physically ill. Anyway, I would wager that there is not a RAW DATASET out there that shows any significant warming. So, what kind of science is this, where ALL of your raw data tells you global warming isn’t occurring, but your adjusted data does??? (Minimally, it shows that climate scientists can’t conduct a single real word experiment without finding some huge problem that requires them to go back and adjust their data, to produce exactly the result they expected.)
Death Valley Weather Station has got a ”warmer”. About 30 meters is a large Solar Panel Installation. And it is tilted towards the Weather Station. I bet that Satellites and Station will break records. See the satellite picture.
Never underestimate the ability of some people to “fudge” the data.
Indeed – which is why 42 years of satellite observations showing the decline of arctic sea ice are important evidence
The satellites don’t show the decline or arctic sea ice, they show the variability of arctic sea ice.
Your statement implies that arctic sea ice is in a continuous decline, but that’s not the case. Some years there is more, and some years there is less.
Fauci owns a piece of the Moderna patent and a gets a cut of the government subsidy every time a needle enters an arm.
FauXi’s National Institute of Allergy and Infectious Diseases owns part of the Moderna vaccine patent, thanks to providng the spike protein.
He is rumoured to own Gilead stock or patents for Remdesivir. I don’t know if either be true. Fact checkers have denied that he’ll profit from it, but who checks the self-appointed fact checkers?
It’s turtles all the way down
“Fact checkers” also claimed that Trump would profit from HCQ sales – I suppose that’s technically true, but a couple hundred dollars to Trump is like pennies for most people.
The “fact checkers” fact check themselves. It’s a circular fact check. (or something else)
Could you please provide proof of that claim of Fauci owning parts of Moderna. I have been collecting a lot of links from reputable sources related to this COVID-19 situation. I would like to add this bit of information to my collection. And I always make sure my links are from reputable sources.
While I am at it, the one thing I haven’t heard in the past year and a half is: “You have changed my mind with your verifiable information from reputable sources that I trust.”
As so often, the real crime is what is legal. Some federal employees are able to get patents on products when the government for which they work gets patents. I don’t know if that’s the case with FauXi and Moderna, but is something which Congress should investigate.
Many departments and agencies of the government do not officially seek patents.
Some will allow employees, provided they justify the expenditure and their boss(es) sign off on the funding documents; to write; have legal counsel review/advise; and apply for patents for Unique solutions both physical and process.
When a corporation or business seeks to benefit from a patented item, it only takes a letter from the department/agency to frighten the patent users into some sort of payment/permission reconciliation.
Given Fauci’s domineering, egotism and involvement; any unique research by Fauci employees likely got patent rights under Fauci’s control. To which Fauci might well receive benefits like funds/stock rights. i.e., Rights to purchase stocks or buy into funds at set prices.
Unless one knows the exact process patented, it isn’t the easiest thing to discover via patent search as the applicant is likely to be an unknown researcher.
Unfortunately I did not save it, sorry.
What a surprise.
“You have changed my mind with your verifiable information from reputable sources that I trust.”
Biggest problem with that is that the usual response to information contrary to one’s belief is to claim the source is unreliable. Therefore, no need to change your mind.
Thanks to Yeonmi Park and Jordan Peterson for telling her courageous story. None of this is surprising to me, because of my strong education and my life experiences on six continents.
Most people do not yet realize that the North Korean model or the Chinese Communist Party (CCP) model is what western elitists like Trudeau and Biden etc want for Canada, the USA and the rest of the Western democracies – the end of freedom and the adoption of the brutal, corrupt CCP model – a few princes at the top, looking down on all the poor peasants.
Climate science is a fascinating subject, but we are wasting our time analyzing and refuting papers by the global warming cult. Based on their 48 failed predictions of climate disaster to end 2020, you can confidently assume that everything the climate doomsters write is alarmist nonsense – false scares fabricated by wolves to stampede the sheep.
MY SITUATION ASSESSMENT – published circa November 2020
It’s ALL a leftist scam – false enviro-hysteria including the Climate and Green-Energy frauds, the full lockdown for Covid-19, the illogical linking of these frauds (“to solve Covid we have to solve Climate Change”), paid-and-planned terrorism by Antifa and BLM, and the mail-in ballot USA election scam – it’s all false and fraudulent.
The Climate-and-Covid scares are false crises, concocted by wolves to stampede the sheep.
The tactics used by the global warming propagandists are straight out of Lenin’s playbook. The Climategate emails provided further evidence of the warmists’ deceit – they don’t debate, they shout down dissent and seek to harm those who disagree with them – straight out of Lenin.
The purported “science” of global warming catastrophism has been disproved numerous ways over the decades. Every one of the warmists’ very-scary predictions, some 80 or so since 1970, have failed to happen. The most objective measure of scientific competence is the ability to correctly predict – and the climate fraudsters have been 100% wrong to date.
There is a powerful logic that says that no rational person can be this wrong, this deliberately obtuse, for this long – that they must have a covert agenda. I made this point circa 2009, and that agenda is now fully exposed – it is the Marxist totalitarian “Great Reset” – “You will own nothing, and you’ll be happy!”
The wolves, proponents of both the very-scary Global Warming / Climate Change scam and the Covid-19 Lockdown scam, know they are lying. Note also how many global “leaders” quickly linked the two scams, stating ”to solve Covid we have to solve Climate Change” – utter nonsense, not even plausible enough to be specious.
Regarding the sheep, especially those who inhabit our universities and governments:
The sheep are well-described by Nassim Nicholas Taleb, author of the landmark text “The Black Swan”, as “Intellectual-Yet-Idiot” or IYI – IYI’s hold the warmist views as absolute truths, without ever having spent sufficient effort to investigate them. The false warmist narrative fitted their negative worldview, and they never seriously questioned it by examining the contrary evidence.
More, for those who can and do read and think:
CLIMATE CHANGE, COVID-19, AND THE GREAT RESET
A Climate, Energy and Covid Primer for Politicians and Media
By Allan M.R. MacRae, Published May 8, 2021 UPDATE 1e
Download the WORD file
https://thsresearch.files.wordpress.com/2021/05/climate-change-covid-19-and-the-great-reset-update-1e-readonly.docx
The wonders of modern science. The “maximum adjusted Death Valley temperature” in 1932 decreased by 2.5 degrees F between 2012 and 2015. We are looking at a sliding past.
I wonder how much of it is “adjusted” and how much is “temperature”.
So far CA’s record heat in Death Valley in 1913 hasnt been consigned to the memory hole. But NOAA set up a second recording station there in front of a south-facing cliff. It still hasn’t beaten the old record.
I think I can help answer that. The raw or unadjusted data shows a warming trend of +0.16C/decade vs the adjusted data which shows only +0.08C/decade at the Death Valley station. So the PHA adjustments reduce the overall warming trend by 0.08C/decade in this case. My source is GHCN-M.
We are talking 2012 adjustments versus 2015 adjustments.
Oh, 8/100ths of one degree over ten years.
Man, what kind of precision thermometer do you use to get that impressive construct?
I bet you can boil your eggs to absolute perfection using that kind of thermometer.
The standard error of mean is the mathematical concept most relevant to the error for a mean temperature. Generally this is on the order of +/- 0.05 for monthly global means. The standard error of the slope of the linear regression trend is typically far lower than that.
What happens to the temperature measurement uncertainties. Swept under the bed?
They are in the published uncertainty. For example, in Berkeley Earth’s dataset here it is the second column. The value for 2021/04 is +/- 0.037 (2σ).
Absolute pie-eyed nonsense, a whitewash over the true uncertainties of temperature measurements, which are on the order of DEGREES, not hundredths of a degree.
Bingo, bdgwx. The fall back position of “Bbbbuutt, wudabout the uncertainty of the individual measurements?” not only falls apart with the proper statistical aggregation of them in their monthly spatial interpolations, but the durability of the resulting trends, over physically/statistically significant time periods, w.r.t. those individual “uncertainties” is undeniable, in the superterranean sunlight.
You have no clue what uncertainty is.
I think this is actually the minimal concept. It might be interesting to look at what an error budget for the instrument and process might show, or a thorough propagation of uncertainty. I say the concept is minimal because people so frequently use a formula appropriate to IID measurements, and justify using it by assuming the data are IID.
It’s definitely a minimal concept. The uncertainty analysis performed by the various datasets are far more rigorous and complex than simply deploying the S/sqrt(N) formula. But the standard error of the mean concept at least provides the basic concept and mathematical framework for explaining how the error of the mean of a population is far lower than the error of any one individual sample.
Utter, total, and complete bullschist—this is only true for multiple independent measurements of the same quantity, like the length of a bar of steel. Time-dependent series like temperature are constantly changing and do NOT qualify (not to mention averaging multiple locations).
The variance of EACH individual temperature measurement increases the variance of the overall average.
It’s true for any population with random error. The concept is used ubiquitously in all disciplines of science. It is not controversial in the slightest.
The standard error of the mean and the standard deviation are related. But they aren’t the same thing. Specifically SEM = SD/sqrt(N). As you can see they would only be the same thing if N = 1. SEM is definitely NOT a deprecated label for SD.
Go read the GUM and educate yourself, it is obvious that cannot break through the crust.
The GUM i think is a must read for anyone who wishes to discuss uncertainty in measurements credibly. And you are exactly right in identifying time series in particular as being an issue with standard error of the mean sorts of uncertainty estimates because now replacing IID is the concept of stationarity plus independence, and things get even worse as the measuring instrument drifts in space and calibration. Think ARGO.
“SEM”
You have no clue. Where do you think SEM derives from? Let’s go thru the steps.
1) You can’t check each and every member of a population so you decide to take samples instead.
2) You decide to take sample of a given size. THIS IS “N” THAT YOU REFERENCE.
3) You take numerous random samples of size N from the population. Let’s say you take 1000 samples.
4) You find the mean of each sample. If everything falls correctly that gives you 1000 ‘sample means”.
4) You develop the distribution of the “sample means”. Again, if everything falls correctly, you end up with a basic normal (Gaussian) distribution.
5) You find the mean of the “sample means”.
6) You compute the SEM, this is really the standard deviation of distribution of the “sample means”. This is where you DIVIDE BY “N”.
7) The mean of the “sample means” should be close to the mean of the entire population if the “sample means” distribution is normal.
8) You compute the population standard deviation by multiplying the SEM by “N”.
If you define all the temperatures you have as a sample of the total global temperature YOU HAVE MADE AN ERROR. That means you have ONLY ONE SAMPLE from which to calculate a mean.
ERROR: How do you calculate SEM from a distribution with only one entry?
If you define each station as a sample, you no longer have random sample from the entire population. This is paramount to achieving an accurate normal distribution from the sample means.
None of this addresses uncertainty in measurements. Here is an example of why it matters. It illustrates the difference between a mathematician and an engineer.
I am creating a product where one part can be life threating. I need the part to be within a millimeter +/- 0.1 millimeter. My creation will need 1000 of these a day.
As the quality person you tell me no problem, we can do that. So you begin measuring each part with a caliper accurate to +/- 1.0 millimeter. You find the mean of the 1000 parts and then calculate the SEM by dividing by N = 1000. You tell the customer you guarantee the parts to 0.001 millimeter. He says great.
Suddenly you are part of a lawsuit for creating a negligent part contributing to the loss of life. Do you know why?
These guys are hung up on this “standard error of the mean” term, which is nothing but the old-fashioned (and deprecated) label for standard deviation.
I stand by what I said. I repeat SEM is not the same thing as SD.
SD: σ = sqrt(sum((xi – u)^2)/N)
SEM: σ^ = σ/sqrt(N)
For example consider the population 2, 4, 4, 4, 5, 5, 7, 9.
u = 5.0
σ = 2.00
σ^ = 0.71
Or consider 2, 4, 4, 4, 4, 5, 5, 7, 8, 9 instead.
u = 5.2
σ = 2.03
σ^ = 0.64
Notice that the standard deviation (σ) and standard error of the mean (σ^) do not compute to the same value. Also notice that σ^ is lower for N=10 than for N=8 even though σ is higher.
The SEM is the broad concept that best embodies the reason why the mean of a population is far lower than the error in the individual samples. Don’t hear what I didn’t say. I didn’t say that the uncertainty values you see published are trivially calculated via the SEM formula. They aren’t. These uncertainty values use far more complex and rigorous uncertainty analysis. I also didn’t say that the SEM address systematic bias in the population. It doesn’t. What I am saying and what no one seriously challenges is that the larger the population to draw from the smaller the error of the mean of that population is all other things being equal.
BTW…a little self criticism is in order here. I noticed that I used the term population when I should have used the term sample in my previous post. I apologize for not being more careful.
SEM has nothing to do with uncertainty in the measurements. First it is done from a sample of the population. It is useful for ESTIMATING mean when the whole population is not known. The SEM is used to evaluate how close the mean is to the true mean. It is a statistical parameter used to gauge closeness, nothing more. It has nothing to do with either accuracy or precision of the measurements used nor the significant digits that should be used to for the measurements. The use of SEM as uncertainty in the measurements belies your knowledge of how measurements should be treated.
Temperature measurements are never of he same thing since they are separate measures of conditions at different times. Therefore they can not be used to assume random errors are eliminated.
You know nothing of data handling with real physical data, only how to manipulate numbers like a mathematician.
Jim, this thread is on the topic of why a global mean temperature can be estimated with far lower uncertainty than the measurement uncertainty of any one specific measurement in the sample. In other words, why is the uncertainty on a monthly global mean temperature on the order of +/- 0.05C when the measurement uncertainty of any one particular measurement is on the order of +/- 1C and possibly higher? That is the question being asked by Mr. above. What I’m saying is that the larger the sample the more representative the mean of that sample is to the true mean of the population. In other words, the larger the sample size the better the estimate of the mean.
The issue you raise about the measurements being for different locations at different times is a separate topic. The uncertainty analysis provided by datasets will refer to this as sampling uncertainty, or spatial and temporal uncertainty. It is this kind of uncertainty that actually dominates the total uncertainty in global mean temperature datasets. It is a big reason why adding more stations will not necessarily drive the final uncertainty down further and why it is higher than the SEM by itself would imply. All I’m saying is that the concept embodied by the SEM (bigger sample size yields lower standard error of the mean) is what best explains why the final uncertainty is as low as it is in the first place.
See my above post. You are not using random samples to create this. You have one sample that is the size of the number of stations. You can not create a sample distribution from one sample.
If you claim each station is a sample you are using non-random sampling which doesn’t fall under what you are doing.
I don’t know how to emphasize to you that measurements with a precision of +/- 1.0 degrees simply can not have their precision increased by this method. You can not even claim that you are measuring the same thing with the same device to eliminate random errors. This is one of the Ten Commandments in metrology.
I can even show references if you like. John Hopkins includes the proper use of significant digits in the lab procedures in order to meet certification requirements. Perhaps it would avail you to study some of the requirements for a certified lab when it comes to precision. Study the GUM and learn.
I’m not saying that the precision of the individual measurements increases. They stay at +/- 1.0C no matter how many there are. I’m saying that the standard error of the mean decreases as you add more measurements to your sample pool in proportion to sqrt(N).
In your scenario the requirement was that each life saving device must be manufactured within +/- 0.1 mm. But your caliper is only precise to +/- 1.0 mm. 92% (using PDF math) of the time your caliber deviated from true by more than 0.1 mm. Let’s say 2% of the devices are manufactured out of spec. That means out of 1000 devices you send 0.02 * 0.92 * 1000 = 18 units out the door. The problem was the misuse of the concept of the SEM. Specifically, it’s not the mean of several devices in aggregate that matters here yet that is the standard error claimed and reported to customers. Customers don’t care about the mean of multiple devices in aggregate. They only care about their device. What matters here is the mean of each device separately. By taking only one sample the SEM is SD/sqrt(1) = SD = +/- 1.0 mm which is the same as uncertainty of the one and only measurement. What should have happened is that each device was measured multiple times preferably by different instruments. If you had measured each device 10 times then the mean of those measurements would have a standard error of 1/sqrt(10) = 0.3 mm. Now it is 74% (using PDF math) of time that the value deviates from true by more than 0.1 mm. You have reduced the number of defective devices down to 0.02 * 0.74 * 1000 = 15 units. It turns out that because your caliper is inferior for the task you’d need to measure each device 400 times to reduce your defect shipped rate to 1-in-1000. Please check my math.
I like your scenario. It illustrates a lot of interesting concepts and was fun to work with. However, understand that as part of computing the global mean temperature and determining the uncertainty the SEM is not misused because unlike the scenario above we really are interested in the standard error of the mean of multiple entities in aggregate. These entities include stations as they are meaned in aggregate into a grid cell and the grid cells themselves as they are meaned in aggregate to complete the mean of the global mesh.
Read what you just wrote. Do you think temperature measurements are any different?
If you claim to know an average is 100 or 1000 times more precise, which is what you are doing, than the original measurement then you are violating every rule of signifcant digits.
I’ll post this again from Washington Univ. at St. Louis:
By using significant figures, we can show how precise a number is. If we express a number beyond the place to which we have actually measured (and are therefore certain of), we compromise the integrity of what this number is representing. It is important after learning and understanding significant figures to use them properly throughout your scientific career.
Precision: A measure of how closely individual measurements agree with one another.
Accuracy: Refers to how closely individual measurements agree with the correct or true value. (Bold by me.)
Read this and say what you think it means.
Individual stations are not “samples”. They are not random selections from a total population. This is required to get a normal distribution of sample means. You can’t even claim they are groups or clusters since each individual station is not representative of the entire globe. If they were, you would only need one station to prove global warming. SEM has no meaning in this case.
Tmin/Tmax are samples within the domain of a station. They have an uncertainty associated with them. The station mean temperature also has an uncertainty associated with it that is lower than the individual measurement uncertainty. Tmin/Tmax are random samples since they are evenly distributed in the temporal dimension.
Station mean temperatures are samples within the domain of a grid cell. They have an uncertainty associated with them. The grid cell mean temperature also has an uncertainty associated with it that is lower than the individual station mean temperature uncertainty. Station mean temperatures are random samples since they randomly exist with in a grid cell (caveat noted here).
Grid cell mean temperatures are samples within the domain of the global mesh. They have an uncertainty associated with them. The global mesh mean temperature also has an uncertainty associated with it that is lower than the individual grid cell mean temperature uncertainty. Grid cell mean temperatures are random samples since they are even distributed in the spatial dimensions.
A global mean temperature is a mean of the sample of grid cell temperatures. The grid cell temperature is a mean of the sample of station temperatures. A station temperature is a mean of the sample of Tmin/Tmax temperatures. The GMT is a mean of a sample of means in which each member is itself a mean of a sample of means.
Individual Tmin/Tmax measurements ARE members of a sample. The sample IS randomly selected.
Individual station mean temperatures ARE members of a sample.The sample IS randomly selected (caveat noted here).
Individual grid cell mean temperatures ARE members of a sample..The sample IS randomly selected.
And yes, I am claiming that the average of a sample has less uncertainty than its constituent members in proportion to sqrt(N). And its not just me that is claiming this. It is everyone. It is an undisputed fact. That is exactly what the central limit theorem and SEM say.
The sample doesn’t even have to be normally distributed. It just has to be randomly distributed. The only difference is the formula used to calculate the uncertainty of the mean of the sample.
None of this has anything to do with significant digits. And it certainty does violate any rule thereof.
George,
As I noted here, you can get fully detailed metadata for Death Valley. The adjustments are almost all due to TOBS – recorded change in observing time. There was also a station shift in 1960. The TOBS adjustment is absolutely required. It would be malpractice not to do it. The change is known, its effect is known.
Why is the TOBS adjustment for 1932 different in 2012 and 2015?
It isn’t clear to me that the 2012 does represent adjusted data.
Nullius in verba, you know. Where does the graph come from?
The graphs were generated by the data downloaded from the USHCN website. It was the official data, before they adjusted its status too
Which data? Raw, tobs, FL? Which versions?
Can you be more specific on how you created the graph? I’m having a hard time replicating what you’ve done exactly. I posted my own graph with the raw, tob, and fls files. Hopefully that post will get approved shortly.
The graph was made ~5 years ago from data downloaded from the USHCN official site. No link kept by me, as I assumed then that the USHCN website would always remain available. If you are having trouble replicating the graphs, it can only be due to more “adjustments” for the files you now have access to.
Here is all I have in my files: Source: MJ Menne CN Williams Jr. RS Vose NOAA National Climatic Data Center Asheville NC
State_id ‘042319’
Thanks. I believe I found the 2012 version you used. I can confirm that the adjustments actually reduce the warming trend a bit vs the raw data for this version. That might be something you could mention in the OP.
I trust Jim Steele. I agree with you that a link would be nice.
You have it in a nutshell: are they admitting their adjustments in 2012 were all wrong and thus they had to make yet more adjustments?
When are they going to get their adjustment methods correct? Who was sacked for messing up the 2012 adjustments?
It’s a scam. Plain and simple.
Exactly how would you decide on “adjustments” when temperatures vary this much at the same time? Better yet, these are integer numbers. Just how does one average them out to the 1/1000 of precision?
Temperatures don’t vary that much on a monthly basis. Adjustments are applied to monthly means. Correlations with neighboring stations at p >= 0.8 occurs 90% of the time for the 100 closest neighbors. See Menne 2009.
Temperatures sure do vary that much in a monthly averages by station. Look at the variance between stations. Why or how could anyone prove that variance doesn’t repeat every day for a month. I’ve looked at this by the way, stations over this area DO vary in average considerably.
It goes back to metrology which I sincerely doubt that you have spent even a moment learning. There are textbooks on uncertainty in measurements for metrology if that means anything to you. It is not a “soft” science by any means.
Variance exists in real physical things. You wave it away be taking averages of different measuring devices and then never looking at what the combined variance is. Google combined variance sometime and see how you calculate it. The bottom line, VARIANCE ALLWAYS INCREASES when you combine populations.
90% of a station’s closest 100 neighbors correlate with p >= 0.8 at the monthly level. See Menne 2009.
Tony Heller says the TOBS adjustment is *not* required.
I’m still looking for Heller’s post on TOBS, in the meantime you can digest this post of his on adjusted temperatures.
Alarmist Data Manipulators are creating a False Reality of the Earth’s climate with their computers. Nick is defending this False Reality.
https://realclimatescience.com/alterations-to-the-us-temperature-record/
Well, I found it. What do you know about that. It was the first thing on the search list.
Here’s an excerpt about your all-important TOBs adjustments:
“But what about hot days? Did afternoon TOBS cause double counting of hot days in 1936? The evidence shows that there was little if any such effect. The trend is almost identical between the two data sets.”
https://realclimatescience.com/2015/07/what-is-the-real-value-of-tobs/
TOBs just give the Data Manipulators an excuse to change the temperature profile. TOBs ought to be spelled “Fraud”.
I would say if you have to adjust for TOBS the site has to be largely unchanged because you need to be able to look at the daily data as a whole and look at trends. If you can’t meet that requirement then the site should be tossed.
Among the strong evidence for the lab-directed evolution of the WuWHOFlu virus by gain of function “research” in vitro and in mice with human lung cells is the furin cleavage site, where the spike splits in order to break into the cell. A small peptide is involved, consisting of just four aminno acids. The middle two are arginine, which is genetically coded by six codons of three nucleotide “letters” each. Only a single amino acid has just one codon, while six is the most. There are 64 possible such three-letter codons for just 20 coded amino acids. Three are stop and start codons, leaving 61 available.
In bats, only 5% of arginine codons are the same as the one dominant in humans. But the oligopeptide at the furin cleavage site uses the human-favored codon for both arginines. Thus the odds are only 0.25% of that combo having evolved naturally in bats. Nor is there any sign of the coronavirus’ having evolved over time in humans.
Maybe not a smoking gun, but a warm one. And that’s just one bit of evidence for the lab leak hypothesis.
Alleged footage of live bats in a WIV lab:
Whether genuine or not, Sky News’ presenter is worth watching. Her new book condemns EcoHealth’s director, used by FauXi as a cutout in funding the WIV’s bat CoV “research”. He should not have been allowed to join WHO’s sham “investigation”, nor write in the Lancet without revealing his extreme conflict of interest. He also briefed the CIA on the lab, telling lies to help bolster the wet market story.
What she doesn’t say is that Shi “Bat Woman” Zhengli worked in the BSL-2 lab, not the new BSL-4. Biosafety Level 2 protocols are comparable to “a dentist’s office”, as Wade put it.
John – doesn’t natural gene duplication mean that two identical neighbouring codons are less improbable than by pure statistical chance? In virus evolution there are billions of rolls of the dice.
Two neighboring codons, each of which has a five percent chance of occuring in that group of mammals, happening next to each other has, as I pointed out, a 0.25% chance of occurring.
Different mammals use predominently one or another of the six arginine codons preferentially. This is normal and to be expected when an amino acid is coded by so many different codons (4x4x4)=64.
Thank you John Tillman for your informative post.
The gross mismanagement of the false Covid-19 pandemic since January 2020 cannot be simply ascribed to gross incompetence by government and health authorities.
I knew about the Dr Fauci involvement about one year ago – he originated the gain-of-function virus research and offshored it to Wuhan when it was declared illegal in the USA. But the lockdown scam is global-scale – much bigger than just Dr Fauci.
A year ago I concluded that the Covid-19 virus originated from the Wuhan lab and not at the wet market. The only question then was “did the virus jump from the Wuhan lab, or was it pushed?”
Based on all the dystopian events since then, the rational conclusion is that the virus did not escape, but was pushed out of the lab – deliberately released for political and financial gain.
There was never any justification for the lockdown of under-65’s – all we needed to do was over-protect the very elderly and infirm. I published that conclusion with confidence on 21March2020 and that was correct.
There was no increase in total deaths in the USA, Canada or Alberta to 30June2020 – no increase in total deaths means no deadly pandemic. Repeating, the lockdowns etc were never justified – so who pulled the strings?
The lockdowns have cost society ~100 times more harm than the Covid-19 illness – it was never a close call.
A criminal case is being prepared in Canada to pursue our government leaders for criminal negligence.
The lockdowns and “NPIs” will kill more people than the virus.
When you go to a researcher or lab webpage and you see the main contributions are PR and media articles, run.
Also, most of the science journalists and journalists scientists are the scum of the scum, run
Not Nicholas Wade.
“Unlike Darwin or Galileo, modern careerist scientists are pressured to produce certain results to ensure their income and status.”
Perhaps Jim needs to read a biography of Galileo.
GG was indeed pressured by the Roman Inquisition in 1615 not to advocate heliocentrism or the movement of the Earth. But when his friend Cardinal Barberini was elected pope in 1623, he felt safe to publish Dialogue Concerning the Two Chief World Systems in 1632. He made the mistake however of puting the pope’s arguments in the mouth of his character Simplicio. No surprise, this ticked off his ex-friend the pope, who sicced the Inquisition on him again. GG was summoned to Rome, and in 1633 was found “vehemently suspect of heresy” and sentenced to house arrest. The sentence for outright conviction would have been beating and worse.
They had burnt Bruno in 1600, but he was guilty of both scientific and religious crimes.
Russia colluuuusion perhaps Izaak. 😉
Roman Collusion! That’s the ticket.
Jim, great article. Much more general than just the Wuhan Lab.
I have my own example to relate, not drawn from academic misconduct but rather from a 5 decade series of plausible and well intentioned but ultimately wrong physics papers.
The issue was the energy storage mechanism in electrochemical double layer capacitors, now well over a $1 billion per year business. The basic physics was explained by Helmholtz in 1888, and Is the mechanism by which thunderstorms generate lightening.
Starting with a paper in 1948, the EDLC device idea was that the charged ions were stored in the etched pores of activated carbons. The problem was, nobody could credibly relate supposed charge storage to supposed activated carbon surface area, despite 60 years of experimental attempts.
Then, in 1954? a theoretical paper appeared showing that if pore storage was the mechanism, then actual device discharge followed mathematically an AC ladder discharge scheme. This despite the fact that EDLC are DC devices.
Decades of papers based on these basics followed.
I got involved quite by accident, but after two years of studying the literature as a neophyte realized none of it made sense. Went back to what had been shown experimentally on metals (not porous activated carbons), realized the correct storage mechanism, was able to derive a mathematical expression (the intrinsic capacitance equation) for same based on the diameter of the charged electrolyte ion, and then show all the previous literature (on metals) fit the prediction almost exactly. That said pores do not matter. There are just three things you can do to increase EDLC capacitance, all related to more exterior surface and well represented in then recent literature: longer and skinnier (carbon nanotubes), flatter (graphenes), or smaller (carbide derived carbons). The problem with the first is a very stiff modulus of elasticity, so they cannot be dense. The problem with the second is the clump from VanDerWaal force, so in the end no better than but much more expensive than activated charcoal. The problem with the third is super expensive.
I invented, experimentally proved, then patented a simple, cheap solution that improved energy density by 1.4x and power density by 2x, doe I started both by the inherent physics and experimentally.
Sometimes, the science just goes inadvertently awry.
For climate science, I think it is 2/3 your observations and 1/3 mine.
It is my experience that it is often an advantage to study a problem without the bias of already knowing the ‘answers.’
Yup. Been there and done that, in some esoteric physics.
Was the blip in the 19 fourties as indicated in the post or in the thirties?
It appears that the higher one is from 1934, the hottest year in US records.
Yes, Hansen said the 1930’s were the hottest decade in the United States and 1934 was the hottest year in that decade, and 1934 was estimated to be 0.5C warmer than 1998, or 2016.
40’s was collapsing temps and bad weather
Think German soldiers in russia, hammered by two of the worst winters in decades, 41-43
Taking it further, climate cooling may have prevented the scenario in PKD’s Man in the High Castle where The CCCP collapsed and the Nazis won, great book and surprisingly good series on Amazon.
It’s probably on the left wing eco fascist fantasy reading list as the Nazis then obliterated the population of Africa and elsewhere
Think of all those pesky emissions obliterated?
The ’20s and ’30s were a natural warming cycle, like the ’80s and ’90s. During the ’40s, there were bad winters because the previous early 20th century warming cycle was breaking down. By 1945, end of WW\ii, the natural oceanic cycles were switching to cold mode, in which they stayed until the PDO shift of 1977.
All that’s needed is a complicit media, and the world’s their ever-performing carnival.
Now what puzzles t6he hell out of me is why after a year of reviling any person who followed Ockham’s razor to say that most likely it’s a leak from the lab, as a conspiracy nutcase, suddenly it became OK to consider the obvious and say well yeah -sounds plausible to me.
Was it DJT shuffling off the stage so we could admit the obvious without giving oxygen to the antichrist
Was it a belated recognition of the right of free speech
Was it fear that the truth will out in the end and we could chuck a few goats to the lions and protect others further up the chain
Was it score settling on the part of others within the COID Illuminati
What would it take for the Guardian and BBC to suddenly announce. “The game is up! AGW was the biggest Scam in History and our reporters reveal how the world was conned ”
One possible explanation is that news of the DIA’s defector, kept hidden from the CIA and FBI, infiltrated by ChiCom spies, had leaked (!) out. Also, Wade’s article is unassailable, though critics have tried, to include character assassination and ad hom attacks.
“Now what puzzles t6he hell out of me is why after a year of reviling any person who followed Ockham’s razor to say that most likely it’s a leak from the lab, as a conspiracy nutcase, suddenly it became OK to consider the obvious and say well yeah -sounds plausible to me.”
Yes, that is a little bit strange considering the cast of characters. It really doesn’t help Biden and the socialist agenda, instead it sets up a confrontation with the Chicoms, although Biden doesn’t look like he wants to be confrontational with them, but this new narrative may put pressure on him, which I assume the Leftwing Media does not want to do, so it’s a little strange they are going down this road.
FOIA requests for Fauci’s emails were due out.
I think John Tillman, above, hit on the possible reason: A very high-ranking Chinese intelligence official has come in from the cold and turned himself over to U.S. authorities. I believe he is the head of the Chicom counter-intelligence division in the U.S.
A Big catch, and it will probably do a lot of damage to Chicom spying here in the U.S and he knows all about the Wuhan virus and how it came about.
I think Biden is pretty much totally insulated from any external pressure at this point.
Yes, from the Leftwing Press he is insulated. They only have good things to say about Biden. Or they say nothing at all.
“…round and round she goes…/
Where to nobody knows…/
Here we go again….
Round and round she goes…” Lennon sang that…
..and while everybody runs around the table to catch the vilain, we forget this “virus” exists nowhere outside a computer model. If it does, and somebody actually holds an isolated sample, why is it not being freely distributed for the worlds’ labs to analyse and develop medicine?
There can be only two answers: This “virus” does not exist, or, alternatively, it does exist, but it is patented, and nobody is allowed to breed it without express written permission from….whom exactly?
The first scenario requires a cohort of propagandists and social engineers to create an illusion, the second requires every single medical service person to be corrupted and enrolled in a conspiricy against Man.
Scenario two is belied by the many medical professionals joining in the chorus against Baal Gates. The first scenario would require most, if not all, “covid protocol” to be written by professional bullshitters. Like psychiatrists and gender scientists and, say, oncologists.
Now go see the list of main authors for NIH’s “Covid19 Vaccination* Communication”
1 Oncologist and four shrinks… and PR and politicians and billionaire businessmen doing the enforcement… That smells like a cohort of professional bullshiters to me…
I vote Scenario One.
As for the commenter saying Frauci gets a cut of every injection? Dude, the only way to explain the participation of the health workers, means EVERYBODY is getting a cut.
How much are we paying them?
Death Valley temps in Fahrenheit?….at 6 am? They wanted to cool the 1930’s….which Tony Heller has pointed out produced the most days over 90….over 95….over 100 ….over 105…the 1930’s were hot hot hot in the USA not just Death Valley.
It was hot all over the world in the 1930’s.
No it wasn’t Tom.
https://en.wikipedia.org/wiki/Climate_change#/media/File:Global_Temperature_And_Forces.svg
Wikipedia, Simon? Read Heller’s website if you want to learn about the history of the Earth’s weather.
You should read some of the temperature and weather headlines coming out during that period of time. If those things were happening today, we would all think the end of the world was near.
Compared to the 1930’s, today’s weather is a “walk in the park”.
Heller documents all that stuff on his website.
Yeah, I know, you won’t bother. But maybe someone else not as set in their ways will take a look and learn something.
Can you post a link to Tony Heller’s global mean temperature dataset? I’d like to review it.
I downloaded the Death Valley data from the GHCN-M repository. The unadjusted data shows a warming trend of +0.16C/decade. The adjusted data shows +0.08C/decade. Note that per the documentation USHCN is produced by GHCN and is thus a subset. And when I download the PHA source code I don’t see anything in there that would remove the “warm blip” from the Death Valley record or does any kind of inappropriate adjustment to any station for that matter nevermind that the PHA procedure actually resulted in less warming at Death Valley; not more. Can you provide more commentary on what you see, where you got your data, and why the adjustments reduce the overall warming relative to the unadjusted data?
Blanding Municipal Airport (BDG)?
I’m not sure what relevance Blanding Municipal Airport has to this post. I downloaded data for the station Death Valley USC00042319. Did I miss something?
Your moniker is bdgwx. Does that mean weather at BDG?
Those are my initials. My name is Brian Gideon. I don’t live anywhere near Blanding.
Thanks for clearing that up. Why not use your real name, as do so many commenters here?
Using your real name can be risky:
A warmist nutter on a comment thread once looked up my real name and tried to get me sacked from my job.
The tolerant “liberal” left….
Less risky if like BDG you’re in the consensus camp.
Is the station you are referring to this one? Or some other?
https://wattsupwiththat.com/2018/08/02/death-valleys-hottest-month-ever-was-likely-a-product-of-nearby-solar-panels-and-rvs/
Yes. That is the one.
These “cooling” treats are for the gullible linear thinking minions. Steven Mosher of BEST uses this misdirection all the time at this exact same section in the time series. I say shame on him because he is an exceptionally intelligent guy and knows he is fooling the minions.
So here goes and I hope you get it. Yes, they knocked 20th century highs which occurred late 30s to Mid 40s down ~0.5C because it wouldn’t do to have all the warming occurring before CO2 levels were significant. Also, before adjustments, a 35yr cooling period (“Ice Age Cometh”) which had climate scientists worried about severe cooling caused by mankind of course (similarly, this was an embarrassment with burgeoning CO2 occurring). Together this changed the seesaw to a straight rising one that fit the CO2 narrative.
The little adjustment upwards at the present end of the graph goes unnoticed by you. It’s small, but an algorithm keeps adding tiny amounts ad infinitum. Here, there is a worry that we are going into another cooling period (already 6 years in). They want to cook up the heating to conceal this and keep CO2 in the game.
Understand here that this same thing is going on with each and every USHCN station.
Are you saying that the USHCN algorithm keeps adding tiny amounts of warming ad infinitum? Maybe you can help me out here. If the algorithm adds tiny amounts then why did the warming rate get reduced in this case? Which line or section of the code is doing this? Note you can download the USHCN source code here.
Reduced the 30s 40s century high by 0 .5C which in the same punchdown, erased the pesky 35yr cooling period to 1979 thereby replacing a dogleg with a CO2 ‘compliant’ rising trend. I’m going to trust you wont have a problem visualizing the geometry created. Re continuing little add-ons of T to the right hand end of the graph, come back each year.
Mark Steyns comment on this at Senate hearing on climate data couldn’t be more clear. He enquired, how can we be so certain what the temperature will be in 2100 and not know what the temperature ‘will be’ in 1950?
We must be looking at different things. I’m looking at data for USC00042319. I’m not seeing that GHCN-M adjustments reduced the 30s and 40s temperatures. In fact, I see the opposite. They were actually adjusted upward. I’m also still not seeing the malicious bit in the PHA code that is “adding tiny amounts ad infinitum”. My question is…where is that malicious code located?
Got it! I always try, assuming goodwill and sincerity about wanting to know. All I’ve got left is that I grossly underestimated the diabolical intelligence of Steven Mosher (my apologies Steven) and grossly overestimated your geometry skills (for which I also apologize).
This is what I’m looking at. The yellow time series is unadjusted data. The purple time series is adj data. The adj data is always higher than unadjusted data through the 30’s and 40’s sometimes considerably higher.

And here is a plot of the tmax at the same station with the raw, PHA-52, and PHA-52j time series. Again, most of the time the adj data is higher than the unadjusted data.

What are you trying to do bdg??? Seems like more obfuscation!
None of what you are posting explains why 2012 adjusted data differs from 2015, and why they removed the warm blip, just as they had conspired to do.
I’m responding to the claims that 1) there is code that “keeps adding tiny amounts ad infinitum” and 2) this code also “Reduced the 30s 40s century high by 0.5C”. The PHA code regardless of version did not do either. I discuss why PHA would yield a different result depending on the version, data included, and current state of the GHCN repository at the time of analysis here.
And don’t forget Dr Peter Ridd and his current crusade against bad, poorly peer-reviewed “science” for the Great Barrier Reef in Australia.
What Is Enlightenment?
‘Enlightenment is man’s emergence from his self-imposed nonage.
Nonage is the inability to use one’s own understanding without another’s guidance.
This nonage is self-imposed if its cause lies not in lack of understanding but in indecision and lack of courage to use one’s own mind without another’s guidance.
Dare to know! (Sapere aude.) “Have the courage to use your own understanding,” is therefore the motto of the enlightenment’.
(Immanuel Kant 1784).
This should be adopted as a mantra for meditation sessions.
“Virtually everything he warned about, can be seen regards the COVID deceit.”
Confused about comma usage…
Apostrophes’ we’re invented to be abused. Commas to be, misused.
“Accordingly the motto of the oldest scientific institution is Nullius En Verba: Take no one’s word!”
Seems we ought to thank them for pointing out (perhaps inadvertently) that it applies even to the likes of Royal Societies
Errr . . . what faith can we have in the Royal Society’s motto?
AI,
Should be “… ones word.” No apostrophe. Geoff S
Ummm, no. “No one’s word” is correct.
Possessive case, descended from the Germanic genitive:
https://www.grammar-monster.com/glossary/possessive_case.htm
I could be wrong, but I think it is a possessive apostrophe to denote the word is owned by one.
“that it applies even to the likes of Royal Societies”
Definitely!
“as exemplified in the Death Valley temperature trends from the US Historical Climate Network.”
USHCN became obsolete in 2014, which is where this plot ends.
But anyway, you can look up the metadata for Death Valley here. If you click on station level data, it tells you that there was a station move in 1960, which lowered the elevation from -168 to -194 feet. If you click on element level data, there are major changes in observing time recorded (TOBS).
Initially (1911) they reset the thermometer at 5 pm, occasionally varying to 4pm. But there were two spells in the 1950’s when they switched to 8 am for a year or two. In 1981 a long-term switch to 8 am was made. In 2015 they switched to midnight.
Now, as spelt out here, if there are known changes in TOBS, you have to adjust the monthly average for them. Scientifically, there isn’t a choice. It’s like adjusting an instrument for known temperature effects. You have to do it. It can easily make a 1 C difference.
All you are really saying is that the historical record is not fit for purpose.
We are not going to get a new one. But in fact this is a good record. The times of observation are recorded, along with station movements (only one significant one). The adjustment for time of observation is now easy to calculate, with modern MMTS data. And it would be malpractice not to adjust for it.
Okay I will bite how do you know how much to adjust it by?
You can’t use current data because it’s a different site and the local patterns would be very different and it would be malpractice to do that.
The only answer I can think of is called wing and a prayer guess.
I would say you were up a creek without a paddle and throw the site you can’t use it.
As much as they like to get it to match the CO2 trend.
“Okay I will bite how do you know how much to adjust it by?”
Described in link above, and also here. With modern auto data, you know the temperature pattern, which tells you how often to expect maxima or minima which would carry over to next day. That pattern doesn’t change much with small site shifts.
You can’t do that … only a non scientist would think that is okay.
I have experienced plenty of days where the 8am temperature was higher than the 2pm or 5pm temperature, due to various weather patterns moving through the area.
So there is one problem I have with TOBS adjustments: how do you know how to adjust the 8am temperature, unless you know what the 5pm temperature was for the same day? And if you know that, why adjust anything at all?
It seems that with the lack of more data, any such adjustment is only an assumption.
“how do you know how to adjust the 8am temperature, unless you know what the 5pm temperature was for the same day?”
You don’t. It is a process for adjusting monthly averages, not daily data. You calculate and correct the bias.
Correct according to who? No actual scientist would say that is correct and if you can’t see the problem then you shouldn’t be commenting on it.
“You calculate and correct the bias.”
How do you correct *your* bias?
There is a bigger problem give the example to a mathematician and ask him to evaluate it.
“It seems that with the lack of more data, any such adjustment is only an assumption.”
The adjustments are *all* assumptions.
And their adjustment assumptions always seem to cool the past, which warms the present. It’s almost like they had an agenda in mind.
I was being nice, Tom 🙂
No, Nick. If your data set comes from a new set of parameters, you terminate that old set, and start a new one. Adjusting data to suit your purpose is fraud. In this particular case, moving the station proves something: Weather is personally local, and changes noticeably over short distances. On the other hand, climate is geographically local, you have to go all the way to different “country” to see other climate. Measuring the weather in one place, and then “adjusting” it to fit another place would sound like bull to any honest fourth-grader.
But in the end, we are still stuck with that “average climate” nonsense, foxes howling into the distance, but always around their own hole…in and out, in and out the same old hole.
But, it seems like they adjust the entire record, not just for the times where TOBS was relevant.
Why did they switch to midnight in 2015? Couldn’t stand the heat?
The convention for adjustment is that present time is not adjusted. Then, going back, if there is a change in TOB, the adjustment applies to prior data (until there is another change).
The switch to midnight would have followed automation – a switch to MMTS. Then you have effectively continuous observations. Midnight is a convention. TOBS makes a difference because
Yes Nick. That is the justification for the fudging. And from that humble beginning a motivated adjuster can make any adjustment that suits their motivations and bury it under all sorts of statistical sophistry. Not only that but any inconvenient data can be deemed unreliable and ignored.
An honest scientist would analyse data as far back as the current collection method has been used and then be exceptionally careful going any further.
It is the cavalier approach to comparing proverbial apples and oranges to three decimal places that causes a lack of confidence. The accompanying motivated reasoning causes a lack of trust.
The fact is that the adjustment is required. You may insist that it is done by rogues and liars, and people may or may not believe you. But what is certainly true is that an unadjusted average is wrong, and by a predictable amount.
No official data should ever be “adjusted”. That is data fraud by the legal code.
One can show the actual data and then show the suggested adjustments; with each and every adjustment fully documented, plus who explicitly authorized the suggested adjustments.
By the way, TOBS and station comparisons are NOT considered valid reasons!
Not unless the detailed reason a specific TOBS was measured or recorded incorrectly. A generic claim is insufficient.
“One can show the actual data and then show the suggested adjustments”
They show the monthly averages based on simple averages of raw data, and then the adjusted average. USHCN used to show adjusted for TOBS only as a separate file.
But in fact the adjustment applies, not to the data, but to the subsequently calculated average. No-one has the final word on how that should be done.
There is absolutely no justification to adjust every single data reading because one or two of them “may” not have given the correct result.Nobody can actually prove that an incorrect value was actually given.
It is an excuse, not a reason for adjusting the data downwards.
“There is absolutely no justification to adjust every single data reading…”
They don’t, AFAIK, adjust the daily readings. They adjust the monthly averages,
No Nick. The average of raw data is by definition correct unless of course it is calculated incorrectly.
And if only your “predictable amount” remained constant people might be a bit more inclined to believe that those you place so much faith in are acting in good faith.
So when are they going to stop making adjustments? Surely they’ve got it all sorted out by now?
What’s the betting they find yet another dodgy excuse for yet more adjustments?
I for one hope they never stop digitizing/incorporating records into the GHCN repository and fixing issues or otherwise improving the procedure for forming the data files. That goes for any dataset really.
You mean torturing the data to fit the warmist agenda.
Give it up, we’re not believing in the scam.
The unadjusted average might be wrong, but by a completely unknown amount. Problems caused by TOBS mean the margin of error needs to be increased and the claimed precision needs to decrease. The data proves that weather isn’t constant over time, so there is no way to tell how many observations were affected by TOBS- any adjustment to the averages are merely a guess based on the current weather pattern. With the current climate being different than that of the 30’s, such guesses are completely invalid.
“Yes Nick. That is the justification for the fudging. And from that humble beginning a motivated adjuster can make any adjustment that suits their motivations and bury it under all sorts of statistical sophistry.”
Which is what Nick is doing here.
Nick, as usual you are only here to obfuscate but your assertion about “have to adjust” is just plain overblown. What you need to do is to tread with great caution whenever you want to adjust anything. Certainly don’t mix your adjusted figures with actual data.
If you want to use old data and pretend you know what it really should have been that is up to you. But don’t pretend that your adjustments produce data. The adjustments only produce calculated numbers. And the calculations are at best unreliable. In the wrong hands the adjustments are fraudulent.
“The adjustments only produce calculated numbers.”
The question here is a monthly average of Tmax. That is inevitably a calculated number. No instrument will give it to you.
The issue is that calculating that average using raw data can give a bias, depending on TOBS. Warm days can be counted twice, or with 8am reading, cold mornings. That is a bias which can and must be corrected.
The predictability of this bias is described here.
Nick, do you comprehend the difference between a calculation based on data and a calculation based on a calculation?
You are lost. Quit pretending that fudged figures can ever be validly compared to data by performing additional fudging by pretending that you can prove there is no bias.
“Nick, do you comprehend the difference between a calculation based on data and a calculation based on a calculation?”
They are all calculations based on data. The task is to get the calculation right.
No Nick. There is a fundamental loss of information. That is why honest scientists use error bars and do propagation of errors analysis.
Your approach couldn’t be more different. You pretend that all that matters is that you can use statistical sophistry to prove your fudging makes no difference.
And at that point you are lost.
Forrest, you have no clue about statistics. There is no issue here about propagation of errors, or even error bars. There is a predictable bias created by time of observation, and it must be adjusted for.
What about the errors in the “predictable bias”? How do you control them?
Nick, be a bit careful when you declare what others do and don’t have a clue about.
First you say that there is no difference between a calculation based on raw data and one based on a calculation based on a calculation. Next you say that there is no issue here with propagation of errors.
Think a bit harder. From here it is you who looks clueless.
How can you get the calculation right when you start from a position of bias?
Scientists routinely correct bias. If your ruler has expanded from warmth, you calculate the thermal expansion and correct. The imperfect resolution of the ruler doesn’t excuse the need for a correction.
Oh dear. Expansion of a ruler? What “scientists” routinely do. You are really heading off into the weeds now!
Try sticking to the actual subject for once Nick. This is about calculations which start with a TOBS fudge and then go in whatever the fudgers want.
Or as wise people say, when you find yourself in a hole, stop digging.
Very poor analogy. I don’t know of any practical context, say buildings or manufacturing, where the builder or inspector makes adjustments.
Nick,
And your routine daily temperatures are affected by rain. Locigally, they should be adjusted also. But they are not in usual practice.
I cannot see the difference between correcting for heat affecting a ruler measurement and rain affecting a temperature measurement.
With temperature, I am trying to compose an argument about whether physics equations like Stefan Boltzmann are more correct when run with rain-corrected T rather than rain-uncorrected.Ny comments? Geoff S
“ Locigally, they should be adjusted also”
Why? The logic of measurement is that you should do it in a standard way, and if there is a deviation from standard, calculate a correction. That is because of something you were doing.
But rain is not what you were doing. It is just something that happens. Someone, for some reason, might want to estimate what the temperature might have been if no rain. But the observer should report what actually happened.
“The task is to get the calculations right”
Well, they’ve made so many adjustments it suggests they’ve yet to get it right. These “scientists” aren’t very good at their job, are they?
“The task is to get the calculation right.”
And without actual data to compare the calculation to (i.e. the ACTUAL temperature for the time “adjusted” to) there is no way to know if the calculation is right.
Those experiments are on-going. For example, USCRN can be compared against USHCN-raw and USHCN-adj. See Hausfather 2016 for details.
First, although Haufather references Gallo (2005) he fails to mention their finding that even paired USCRN stations differed widely despite not being affected by Time of Observation or Instrumentation changes. Gallo concluded “The microclimatic factors and land surface influences can, as demonstrated, appear to dominate the factors that can influence temperatures observed at nearby stations.”
Second Hausfather’s study shows the adjusted data has defintie biases relative to USCRN as shown in the minimum temperature warming bias
Below is a graph (from Hausfather, Menne et al 2016 Evaluating the impact of U.S. Historical Climatology Network homogenization using the U.S. Climate Reference Network) of the minimum temperature trend for USCRN (green) and neighboring stations on the left. On right is USHCN raw (blue) and adjusted (red) minus USCRN. The neighboring stations used are within 100 miles of a USCRN station. The micro-climate changes of a span of 100 miles suggest such comparison are not trustworthy. They also analyzed stations within 50 miles, which still allows for different micro climate variations, but the graphs are only from those within 100 miles. Hmmm.
What effect do these adjustments have on the uncertainty of the final result?
Part of the problem is that you are trying to obtain two points on a time based continuous wave. The best you will get from averaging those two numbers is a midrange. It is not an average of the heat involved. If you have a sine wave with a peak of Tmax, what is the “average”? The same applies to Tmin. TOBS may introduce a bias but you are dealing with hosed numbers to begin with.
As to TOBS, start a new station record. The only reason to make adjustments is to create, thru calculations, a long term record. By your own admission, you have lost the true long term record the moment the change was made. So why bother? To make statistical parameters look better!
Publish the raw data with errata so that researchers can do what they will with the data. Doing what is going on now is basically saying that central planning bureaus can do a better job. We all know how that works out!
The raw data is published. For the GHCN-M repository it is in the qcu file. The PHA data is in the qcf file. The data is open and free to access here. Datasets can use the provided qcf file or they can choose to use the qcu file as-is or provide their own non-climatic bias handling routines. For example, GISS uses the qcf file by default, but you can run their code with the qcu file as well. It turns out the results are not that different. In fact, I think Nick processes the qcu file and gets about +0.18C/decade from 1979-present (correct me if I’m wrong Nick) vs GISS which yields +0.19C/decade with the qcf file.
“The raw data is published. For the GHCN-M repository it is in the qcu file”
Not only is it published, but I use it every month to calculate the global temperature, and compare with GISS and others. I do the same calculation with the adjusted data. It makes very little difference.
Thanks Nick. Yeah, I remember you saying you use the unadjusted data.
Little difference? Then explain why the 2012 adjusted max data differs from the 2015 adjusted data, and why the “warm blip” was removed just as they had conspired tp do.
It appears you and bdg are trying to change the issue
USHCN is a subset of GHCN. Remember that v4 of GHCN incorporated a huge number of historical records that had been digitized that were not included in v3. If you look at the neighbor list for Death Valley in v3 you’ll see that it is dramatically different than v4. v4 contains several more close neighbors than does v3. The closest neighbor in v3 is Mercury at 78 km away. But with v4 there are 12 neighbors closer than Mercury with the closest being Greenland Ranch at 1 km. PHA is very much affected by the number and distance of the neighboring stations. There is no conspiracy here. You can download, examine, and run the PHA code yourself.
v3: https://data.giss.nasa.gov/cgi-bin/gistemp/stdata_find_v3.cgi?lat=36.46&lon=-116.87&ds=7&dt=1
v4: https://data.giss.nasa.gov/cgi-bin/gistemp/stdata_find_v4.cgi?lat=36.4622&lon=-116.8669&ds=15&dt=1
Closer neighbors do not justify different adjustments. As I said each location is affected by many varying microclimates. Drive around and temperatures vary within a half mile.
And why would new neighbors be better and allow adjustments to pre-196 data.
You are obviously invested in the adjusted data and are here to obfuscate the observed bad climate science. Your narratives dont change the fact that “elites like Phil Jones, Thomas Wigley and Ben Santer discussed how to “adjust” observed temperature trends to better support their CO2 theory. Warming in the 1930s and 40s similar to today, suggested a naturally oscillating climate. So in 2009 they wrote, “It would be good to remove at least part of the 1940s blip, but we are still left with why the blip”.
They were not discussing valid details and dynamics that may affect temperatures and misrepresent the global average. They clearly just wanted a different result, one that fit their theory, and you seem purposely blind to their bad intentions for some reason.
PHA yields a different output when the inputs are different. That is the main point. And the inputs used in 2012 were different than 2015 and 2021. In fact, GHCN is continuously incorporating stations and observations that are months, years, and even decades old so the PHA output will literally change on a daily basis though typically observation/station uploads into the repository are usually only incremental. The GHCN inventory continues to grow as various record digitization projects are on-going.
Also consider that temperature time series correlations are inversely proportional to the distance between stations. Correlations are higher/lower for stations in which the distance is lower/higher. I think even you would agree that Greenland Ranch at 1 km will be a more effective pairwise partner than Mercury at 78 km. And GHCNv4 has other long term partner candidates at 8 km, 51 km, and 75 km that GHCNv3 did not include. Keep in mind that PHA considers several neighbors; not just the closest one.
I definitely advocate for adjustments because it would be unscientific, and quite frankly unethical, to not quantify and correct for known non-climatic biases. But I’m also hyper focused on the global mean temperature where numerous measurements (both land and sea) are spatial averaged and which these biases tend to cancel in a testament to the fact that they are at least close to being normally distributed. In the end it has been shown that there isn’t much difference in the unadjusted vs adjusted in the domain of the global mean temperature.
You parade the same worthless trope “I definitely advocate for adjustments because it would be unscientific, and quite frankly unethical”
But it is very unscientific and unethical to continuously adjust data based on additions from uncritically evaluated stations
Those neighboring stations have been critically evaluated. That’s what PHA does. And those neighboring stations themselves have been compared against their neighbors which in turn have been critically evaluated. This procedure is predictable, objective, and deterministic. And it has itself been critically evaluated and has been shown to produce a result that is less wrong than doing nothing. I gave you links documenting how PHA works, the PHA source code itself, and critical evaluations of it. It couldn’t be more clear from the abundance of evidence that adjustments must be made to correct known biases. Ignoring the biases won’t make them go away.
Now if you or anyone can identify a specific issue with PHA and describe how it can be corrected or if a better option exists for making these adjustments or if an as-yet unknown dataset exists for which these kinds of issues are not a problem for years prior to 2000 then by all means present your findings.
I call BS!
You claim “Those neighboring stations have been critically evaluated. “
36% of all US stations with at least 70 years data show COOLING trends.
A statistical average is useless unless it is averaging the same populations. Cooling temperature trends will have a different cause than warming trends and thus those temperatures should not be adjusted or averaged into some global average. They need to be examined case by case.
Adjustments are based on change points and you are a liar if you claim that the cause of each change point has been “critically evaluated.”
It doesn’t matter which stations show warming or cooling. PHA analyzes them all the same. In fact, each combination of pairs of neighbor stations is analyzed. It’s not on a case-by-case basis; it’s literally all of them. And the adjustments are only applied after a rigorous significance test passes at the 2σ confidence level. And the PHA software itself and its overall results has been critically evaluated by multiple parties which I’ve cited. Again, don’t hear what I’m not saying. I’m not saying that PHA adjustments are perfect. They aren’t. But overall it has been shown to yield beneficial results and improve the accuracy of the climatic trends. And it is certainty better than doing nothing and ignoring the problems.
You claim “It doesn’t matter which stations show warming or cooling”
You are obfuscating again!
But it most certainly does. There is still the need for a decision to increase or decrease or accept the observed data. It is adjusted upwards because, let’s say for example, that 64% say warming and that over rides the cooling trends. Unless the cause of micro climate changes are rigorously evaluated for each station, there is honest reason to adjust any data. Indeed instrumental and location changes require attention, but the great majority of change points have nothing to do with such documented changes.
You say “overall it has been shown to yield beneficial results and improve the accuracy of the climatic trends.”
LOL
Based on what? Its absolutely ridiculous to claim improved “accuracy” when you are changing what was actually measured!
I call BS again!
You keep ranting, “And the PHA software itself and its overall results has been critically evaluated by multiple parties which I’ve cited. Again, don’t hear what I’m not saying.”
But the pairs are not “critically evaluated” !!!!
Show me the data from those comparison’s that have analyzed changes in soil moisture that can cause several degree change, AND lost vegetation and its warming effect on transpiration AND the effects of structures and vegetation on surface turbulence that disrupts inversions and warms temperatures AND compares causes of changes in both maximum and minimum temperatures AND how shifts in natural oscillations alter atmospheric circulation AND ……..
You are talking out your butt to keep dishonestly claiming the data is all “critically evaluated”
The problem is that those files are never seen by politicians and researchers that only see the “official” releases. Do you think everyone is a climate scientist. A lot of researchers use the recommended data set and accept it as gospel. How many papers come out referencing the GAT when they are really needing a 10 sq mi temp scheme for snail darter’s. That is up to the central planners to provide proper data. But that would ruin consensus, right? Can’t have that! In the name of science, right?
Those files are the “official” release. Anyone including politicians are welcome is download the data and analyze at that person’s discretion. Many people/groups like Nick and GISS do just that.
Believe in the science! Right?
Of course Nick has not shown that the change on TOBS causes a significant difference, he just says it can make a 1 C difference. Tony Heller has gone and done the comparisons showing that the difference in temperatures is insignificant.
Of course I have. See here for example.
Tony Heller has not shown anything.
Your “here” is not explained. Show us where the 1 deg C diff is.
Here are Tony Heller’s charts which are easier to understand:
https://realclimatescience.com/2017/05/the-wildly-fraudulent-tobs-temperature-adjustment/
https://realclimatescience.com/2016/05/tobs-adjustment-is-garbage/
Thanks for the links, Gerald.
I notice Nick has no comment about them.
TOBs is just an excuse for the Data Manipulators to manipulate the data.
Nick says that is not so, but Tony Heller shows it is so. As above.
Manipulating the data the way it was done creates a false picture of the world’s climate.
Actual temperature readings show no unprecedented warming due to CO2. Only the manipulated global temperature profile shows warming and that’s all due to adjustmenst to the original data.
The origial data shows Earth is not in danger from CO2. But that’s not what the Data Manipulators want you to think, so they bastardized the temperature records in order to scare people.
TOBs is climate change fraud all the way down.
Aside from the fact that I frequently cannot replicate his graphs and work I don’t think I’ve ever seen a global mean temperature dataset ever published by Tony Heller that actually quantifies the differences he claims. He often claims this and that make a difference on the spatial and temporal averaging of global mean temperatures, but he never actually presents the numbers.
Have another look.
Stop LYING about USHCN, it is still being updated EVERY DAY!
I showed this to you about 2-3 years ago, you suddenly ran off when I posted FTP files link.
Better check those links again, Sunsettommy. They seem to be dead.
But I remember that exchange, which is here. It was weird. I kept producing statement after statement, posted prominently by NOAA, stating explicitly that USHCN had been replaced by nClimDiv in 2014. And you ignored all that and insisted I was lying, even though you could not produce a calculated (by NOAA) USHCN average since that date. There is none.
Just one of their explicit statements is at the head of the commonly linked graph of the three US indices here. Here is what it says

Perhaps you also have an excuse for the “adjustments” made to the RAW data between versions 2.5, 3.0 and 4.0 of GISTEMP Surface Temperatures for the same stations.
As well as the overall adjustment amounts between those versions.
A simple example compare
https://data.giss.nasa.gov/cgi-bin/gistemp/stdata_show_v3.cgi?id=406783250000&ds=7
with
https://data.giss.nasa.gov/cgi-bin/gistemp/stdata_show_v4.cgi?id=CUM00078325&dt=1&ds=15
Which one represents the truth?
What discrepancy do you see? Obviously the V4 data goes to more recent.
There you go again Nick. Pretending not to know is one of your more predictable tactics when the facts are against you.
Bloody hell if you can’t see what is wrong with the data you are blind.
They have changed the so called “Un-Adjusted” values, both up and down over certain periods.
“They have changed the so called “Un-Adjusted” values, both up and down over certain periods.”
Yes, that’s why you have to be careful when Alarmists tell you they are using unadjusted data. That may not be the case.
As a general rule the latest version is likely to be closer to the truth since it includes fixes for known bugs, errors, biases, etc which the previous version does not yet contain fixes for. In addition GHCNv4 incorporated vastly more data as part of large record digitization efforts. I believe v4 is up to 27,000 stations whereas v3 was I think 7500 or so. If I had to guess on this particular case as to the large change it was probably because of the addition of station CUM00078325 (5 km away) which likely replaced station 425000845700 (170 km away) as the primary reference for PHA’s change point discontinuity identification and correction reference.
Bullsh!t, this is on a one station basis.
Did you even bother to look at the 2 charts?
By the way there are literally hundreds like that where TOBS+Final has dropped temperstures by up to 3C.
Read the papers on the adjustments to see that Nick is telling porkies, becasue it should be no more than 0.6C to 0.8C after ALL adjustments have been made.
Go and read Menne2009.
http://www-personal.umich.edu/~eoswald/Menne2009_USHCN_V2.pdf
Yes. Not only did I look at both plots, but I actually downloaded the data. There is a change point around 1970 in which the unadjusted data is different between the v3 and v4. This may be due to the addition of data that now exists in v4, but was absent in v3. I noticed that the station names and ids are different which is often a clue that we’re dealing with two different time series here. v4 may have merged/split stations from multiple records. But my comment was primarily in regards to the final adj time series which changes significantly from v3 to v4. PHA works by comparing time series of neighboring stations. In v3 we have a different set of neighbors than v4 due to the dramatic increase in station counts incorporated into v4. The nearest site in v3 was Key West, FL. In v4 it is Havana, Cuba. There are other changes to the neighbor lists as well. I believe this is the most likely reason for the PHA adjustment differences. And considering PHA in v4 uses a more compressive and closer set of neighbors then it follows that it is more likely to be true than v3.
Really you are a bad liar, here is the link to the FTP files that are STILL running up today, it updates every day.
ftp://ftp.ncdc.noaa.gov/pub/data/ushcn/v2.5/
I can’t get any response from that link. It may be something in my system, but it sure looks like a dead link. Maybe others can try.
Many web browsers will not load ftp links anymore. You’ll have to use WinSCP or some other ftp client.
You didn’t used to have to, their site did it for you, as it still does for GISS V4.
Thanks. I found that Chrome by default won’t open ftp links any more, but you can enter
chrome://flags
in the address bar and it takes you to a page where you can change this. You have to restart Chrome, but then I think it works in the future.
Then the link did work.
Funny that you should say that because NASA/NOAA are making harder and harder to just view or download data.
Where in the literature Menne et al etc does it say you can get a 1C change?
Menne et al wrote about PHA, not TOBS. But you can work it out easily enough.
Yet another outright lie.
I suggest you go and read before making a complete idiot of yourself
Quote “Fi g. 4. Average annual differences over the CONUS between the TOB-adjusted data and the unadjusted (raw) data.”
You are not doing very well, if I was you I would give up.
Where is the hockey stick?
No data should be adjusted. It is far better to put in error bars if there are doubts about the data with an explanation and no assumptions can be made based on the data.
The adjustment here is not because of doubts about the data. We know what happened. The time of observation was changed. That requires adjustment to the monthly average.
Nick, as I intimated above you do not know what happened at all. You and others like to pretend they know what the measurements should have been but you do not. At best what you have is a guess. At worst you have motivated falsehoods.
And once you pretend you can fudge all the figures and bury your calculations under a pile of statistics you are lost.
It’s in the HOMR metadata record. PHA does utilize documented change points where available but it is not required. See Menne 2009.
However, USHCN did explicitly allow for TOBS, making those adjustments before applying PHA.
It looks like they use the documented change points for all types of changes; not just TOBS. And according to Menne it looks like PHA’s low sensitivity test is applied first, documented change points are layered on top of that, and then, presumably, the high sensitivity tests are applied.
Part of the problem is that you are still making guesses as to what the old station would have read in the future. Without adequate change methodology such as identifying systematic uncertainty in the old and new stations, accurate checks of the calibration of the old station and recognizing the uncertainties in the old and new readings you have basis for making a current adjustment without a large uncertainty.
I get what you’re saying. PHA isn’t going to produce a perfect result. The final result will always have some level of wrongness and uncertainty. But PHA does produce a deterministic result that has been shown to be less wrong than doing nothing. In that regard “guesses” probably isn’t the best way to describe this process especially since documented change points are used and are the exact opposite of guessing. It is unfortunate that observing practices, station moves, instrument changes, etc. result in non-climatic biases. In an ideal world we would have addressed these issues prior to making the observations. We didn’t so now we have to work with what we have. No rationally thinking person would protest if GHCN replaced PHA with something better. But we will protest if they replace it with it nothing at all and ignore the problem.
“Nick, as I intimated above you do not know what happened at all. You and others like to pretend they know what the measurements should have been but you do not. At best what you have is a guess. At worst you have motivated falsehoods.”
I think that sums it up nicely and correctly.
“know what happened” ? LOL. You know now better than the actual observers back then? You are ridiculous
No, the observer’s readings are the basis of the proper calculation of the monthly averages. The observers didn’t observe those. They recorded the times of observation; those create a calculable bias in the monthly average.
This is standard NOAA practice. There are good reasons for it.
Nick, you wrote “ calculation of the monthly averages. The observers didn’t observe those.” Well, they seem to have observed those before anyone else, like their boss, saw them.
At Melbourne Regional station run by the forefathers of the BOM, the observers actually did calculate average weekly and monthly values for their daily observations. Here is a photo of the original data sheet of March, 1960.
http://www.geoffstuff.com/melbregt1860.jpg
Can I presume that you will argue that writing down an observation is not the same as taking the mean of a month of such observations. I cannot agree, because I do not know what went on in the mind of the observer. Did the observer say to self “Hmmm, that looks like 66.1F, but it is like 66.0F with maybe a little showing above the peg, not enough to be 66.2 or 66.3, but on average I shall opt for 66.1”. One has to define “average”. Geoff S
Geoff,
They observed instrument readings. And they may have calculated averages. That is a calculation which anyone can emulate. There is nothing special about their calculation (or anyone else’s). People can improve them.
Yes. We know what happened because the observers documented it back then.
Did they also document the uncertainty in their readings? Are those uncertainties being used to propagate to an uncertainty range of any averages used?
The documentation we are talking about here is station moves, observing practices (TOB), instrument changes, etc. Obviously the instruments themselves have documented uncertainty, but that wasn’t really what we were discussing.
Very little adjustment required.
The data is what it is!
That is false!
A) the adjustment is opinion! Not reality! Any adjustments are unmeasured guesswork.
B) You do not know what happened! You were not there at the already recorded time or the time the edict wanted the data to represent. At most, the temperature data should show a step function in data charts from the old measurement process to the new process.
Incompetent and fraudulent fools abuse approval to adjust in trying to foist a false data chart upon people.
Changes in time of observation, instrument changes, and station sighting changes are not opinion. They are documented by or on behalf of the observers. Adjustments made with the purpose of addressing these issues and are based on analysis of how each creates a non-climatic bias in the time series. Ignoring these issues is unethical at best and could rise to fraud if you were aware of them, made no attempt to address them, and did not disclose this information upon publication.
Normally, when any change is mad0, a dual data collection is made, when possible, for as long as possible in order to establish what bias exists when compared to the old station. I suspect this has seldom been done. One also needs to check calibration on the old station at the time, or systematic bias is propagated through incorrect measurements of the old station.
Any estimates of what changes may make without actual, detailed measurements of what occurred introduces uncertainty. You can not eliminate much of this uncertainty by simply comparing old data to new data. You have no way to ascertain what the old station would have provided at any future date to compare with the new reading.
Yeah. That’s actually what the pairwise homogenization algorithm (PHA) does. The rub is that PHA is less effective for stations that have minimal or distant neighbor lists.
its all subjective! Pairwise homogenization algorithms need to decide to raise the temps from a cooler neighbor or lower the temps from the warmer neighbor, or make partial adjustments. That decision has been biased by belief in CO2 warming, or the intention to support that theory. There is NO analysis of how the landscapes and micro-climates of each neighboring station has changed over the years. Changes in hydrology, heat absorbing surfaces, wind patterns and turbulence have huge effects that need to be analyzed station by station
It is most definitely not subjective. It is both objective and deterministic. Different people/groups running the same code will get the same results as everyone else. Also, there is no assumption in the logic that warming should be preferred. The Death Valley station is a good illustration of this seeing as PHA actually reduced the warming trend relative to the unadjusted data.
I do agree with you though that there are plenty of opportunities for improvement here. The issues you mention are all very reasonable. I’m sure there are many more too. I will say that one could argue that reanalysis datasets represent the pinnacle of data assimilation, modeling, and global mean temperature measurement. If we start adding more complex models components to the traditional surface station datasets they may become just as complex as reanalysis. I think the idea is to keep these traditional datasets as simple as reasonably possible while still keeping the biggest source of contamination at a minimum.
Of course you claim “It is most definitely not subjective” but that is just your narrative.
Better if you explain precisely how it is decided whether to raise the temps from a cooler neighbor or lower the temps from the warmer neighbor, or make partial adjustments. If it is simply done by majority rules it will be wrong.
With the ability for cars to measure temperature, one simply needs to ride around and see within a 2 mile radius temperatures can vary by 2-3C
I recommend reading Menne 2009, Venema 2012, Williams 2012, Hausfather 2016, and Menne 2018 at a minimum to familiarize yourself with the method and its effectiveness at a high level. If possible review all publications here. Then download the source code here. Note that there are other methods that can and have been used to address non-climatic biases. GHCN and thus USHCN uses PHA introduced in the Menne 2009 publication.
You are dodging my question. Odd for someone who is posting prolifically.
I have read many of the papers you reference but again “Better if YOU explain precisely how it is decided whether to raise the temps from a cooler neighbor or lower the temps from the warmer neighbor, or make partial adjustments”
Here is how it works per Menne 2009.
The pairwise algorithm is executed according to the following six steps:
The publication then goes into detail regarding each step. This is in section 3 with each step described in a-f subsections. I’ll try to summarize this as succinctly as possible.
a. Selection of neighbors and formulation of difference series
The 100 closest neighbors are identified. They are ranked by their correlation with the target. The 40 highest neighbors are preferred, but starting with the 41st an assessment is made regarding whether it will add data for periods in which there are fewer than 7 neighbors. Next a difference series is formed following the Lund method.
b. Identification of undocumented changepoints
The standard normal homogeneity test (SNHT) is applied to identify change points.
c. Classification of breakpoints identified by the SNHT test
5 different models are then applied to the change points in step b. The models are ranked by Bayesian Information Criteria (BIC) in descending order for each change point in b. Some of the change points identified in b may be eliminated during this step if it is determined the shift climatic and should be retained.
d. Attribution of shifts in the difference series
This step identifies the culprit or perpetrator for each discontinuity associated with the change points in step c.
e. Assignment of undocumented changepoint dates
This step assigns the date of the shift to the culprit or perpetrator identified in step d. The 5 model results computed in step c are used to assist the assignment of dates which may not be known for certain (they are undocumented).
f. Calculation of adjustments
This step computes an adjustment for each documented and undocumented change point using data both from the targets neighbors and from the 5 models computed in step c. At least 3 adjustment estimates must be available to proceed. As many as 40 estimates can be available. The median value is used as the final adjustment, but the adjustment can only be applied if a significance test is satisfied at 2 sigma. Shifts up/down wrt to the neighbors and 5 models are adjusted down/up in proportion to the magnitude of the shift represented by the median of the 3-40 estimates.
I glossed over a LOT of details. It really is best if you just read the Menne 2009 publication. If you notice any discrepancies between my summary and the Menne 2009 publication please let me know.
All the above is statistical fluff used to justify changing the data. The problem remains! They unscientifically use a “homogeneity test” that assumes different stations with different micro climate variations due to different landscape changes from varied populations growth effects to identify “change points”. Then they assume change points are climate related. It would be more scientific to present data only from stations that have not experienced landscape/microclimate changes.
A better alternative is to use the stations the USCRN has created that are more reliably free from landscape caused microclimate changes. Then limit pairwise comparisons to USCRN data. Unfortunately the data only begins n 2005.
Nonetheless the USCRN certainly does not suggest the “hockey stick climate crisis” the alarmist elites portray with their manipulated data. So the elites hire tools like you, to obscure the issue with references to mind numbing useless statistics that alarmist elites push to support their bogus methodology
The data has to be corrected because as-is it has a level of wrongness to it. That is the justification for the adjustments. Correcting for known biases that make the data less wrong is not unscientific. On the flip side I’m having hard time understanding why you think the “homogeneity test”, which I assume you mean SNHT, is unscientific. It is used in many applications and scientific disciplines. Menne didn’t invent it. You can download statistical packages for Excel that will perform the SNHT on any data series. It’s not just for a temperature time series.
Yes. USCRN would be a better option had it existed in the 1900’s. But it didn’t begin operation until the 2000’s. So that’s not an option.
But we can use the overlap period between USCRN and USHCN as a critical evaluation of PHA. It turns out that PHA adjusted USHCN data is a better match to USCRN than the raw unadjusted USHCN data. And if anything USCRN tells us that USHCN-adj trend is underestimating the warming. See Hausfather 2016.
PHA isn’t perfect. But it is better than do nothing.
LOL you say “The data has to be corrected because as-is it has a level of wrongness to it”
Yeah, your belief it is all driven by CO2, then sees any disagreement with your theory as “wrongness” LOL
Thats why Jones and Santer wanted remove the warm blips without ever “critically evaluating” a single station.
Again 36% of US stations with 70+ years of data show cooling trends.
The only wrongness is the adjustments.
Garbage in- Garbage out! no matter what statistical methods you apply. And your arguments are garbage!
No. I do not believe that a station’s temperature series wrongness is driven by CO2. I’ve never said it. I’ve never implied. And I don’t want other people to think it. What I have said is that the data has an element of wrongness driven by station moves, time of observation changes, instrument changes, and other undocumented effects that create non-climatic biases including many of the concerns with microclimate elements like changes in vegetation, developments, etc.
If you believe adjustments make the time series more wrong than they already are then present evidence to back up your claim. Show what the true time series should look like, provide evidence of why you think it best represents truth, and plot the difference between unadjusted-true and adjusted-true. I will say that this has already been done so you might want to review the body evidence (which I have already cited) before responding.
Of course you say “I do not believe that a station’s temperature series wrongness is driven by CO2. I’ve never said it”
And I never said you said it. But I can infer from your comments that you do.
For example, you continue to avoid answering why Jones and Santer, by their own words, undeniably conspired to adjust data by removing the 40s “warm blip” that contradicts their CO2 theory…and then coincidentally it happens. Instead you keep insisting its all just “good science”, yet there is no way tp prove that, but there is ample evidence that landscape changes alter microclimates that alarmist elites then use to justifying manipulating data. So you try to snow everyone with useless statistics that fail to account for landscape changes.
For example, the alarmist elite have insisted that urban heat effects have not effect the trend. Their methodology simply categorize a region as urban or not, by population size of by night liigts. What ever the metric, they are all meaningless. A rural station can be classified as rural, yet have undergone significant changes to its landscape even with small population changes.But such worthless published claims are used to NOT adjust for UHI type effects.
And then you push the big lie that ““Those neighboring stations have been critically evaluated. “
What I want to know is how anyone can know that the adjustments make the data MORE correct? Without having ACTUAL data to compare with, how can we possibly determine if the assumptions and calculations that went into the adjustment resulted in the correct value?
And if we have that actual data, then why are we making adjustments?
Exactly Tony!
We do have actual data. USCRN is widely accepted as a gold standard for climate analysis which requires no adjustments to correct for non-climate biases since the system designed and deployed with this goal in mind. The overlap period between USHCN and USCRN can be used to calibrate and assess the USHCN dataset. It turns out that USHCN-adj is matches USCRN better than USHCN-raw.
bdg you are really just dishonestly trolling.
The published science shows USCRN data varies due to microclimates.
That’s right. Stations that are close to one another have different microclimates that cause them to record different tmin and tmax values. That’s been known since like at least the 1800’s. That means stations are not perfectly correlated at p = 1.0 which everybody already understands. Note what the Gallo 2005 publication did not in any way suggest. It did not suggest that the microclimate around a station changes with time (though it might) or that these microclimate differences introduce a bias into the time series of a station. In fact, this is one design goal of USCRN. The stations are deployed in rural areas with rigorous sighting requirements specifically to reduce microclimate bias contamination like would occur if trees got cut down, roads built nearby, residential/commercial developments, etc.
If there is one nugget of undestanding that might be ranked higher than the others it is this. The biases that are of the most concern in the context of trend analysis are time varying biases like station moves, time of observation changes, or instrument changes. Two stations having different microclimates (like what is discussed in Gallo 2005) does not introduce a time varying bias into those station’s time series. Now if the microclimate changed due to non-climatic factor like a nearby residential/commercial development then that would introduce a time varying bias. But USCRN is designed to minimize non-climatic microclimate changes like these.
No I don’t. Like…not even close. I can’t even conjure up a wildly absurd speculative mechanism by which changes in CO2 could possibly alter an instruments ability to record a temperature or otherwise contaminate a time series with a bias.
bdg says “I can’t even conjure up a wildly absurd speculative mechanism by which changes in CO2 could possibly alter an instruments ability to record a temperature “
what a ridiculous statement . It is increasingly clear that you are a dishonest Bullsh***er. Just like you have spammed this thread with obfuscations and dishonest deflections you do it again now
No one is saying CO2 alters an instruments ability. LOL
It is elite scientists who want control and maintain their theory of CO2 warming that alter the data.
Just so we’re on the same page I’m responding to this. I’m responding to your statement that you think I believe [it] (the wrongness) is driven by CO2.
And of course my last response is ridiculous. I shouldn’t have to make it because the whole idea of CO2 driving the “wrongness” is absurd. I don’t know what else to tell you other than I don’t think CO2 drives the “wrongness”. Nor have I ever implied it. And I certainty don’t want other people to think it either.
I don’t even think CO2 is the sole driver of the long term secular warming trend of the global mean temperature in the contemporary era.
The Hausfather study is worthless!
First, although Haufather references Gallo (2005) methodology, he fails to mention Gallo’s finding that even paired USCRN stations differed widely despite NOT being affected by Time of Observation or Instrumentation changes.
Below is a graph (from Hausfather, Menne et al 2016 Evaluating the impact of U.S. Historical Climatology Network homogenization using the U.S. Climate Reference Network) of the minimum temperature trend for USCRN (green) and neighboring stations on the left. On right is USHCN raw (blue) and adjusted (red) minus USCRN. The neighboring stations used are within 100 miles of a USCRN station. The micro-climate changes of a span of 100 miles suggest such comparison are not trustworthy. They also analyzed stations within 50 miles, which still allows for different micro climate variations, but the graphs are only from those within 100 miles. Hmmm.
Clearly, they show that there is a warming bias in both the raw and adjusted minimum temperature data. This is to be expected from any urbanization type effects mentioned in earlier posts that have been shonw to create warming. . They also found there was more cooling for adjusted maximum temperatures compared to USCRN data. The cooling bias is more difficult to explain without a regional analysis, as 36% of the long term weather stations do show cooling over the past 70 years.
What is remarkable is Hausfather’s claims that bdg rants about is
“we find that adjustments make both trends and monthly anomalies from USHCN stations much more similar to those of neighboring USCRN stations for the period from 2004 to 2015 when the networks overlap”. Really? more similar? There is quite a bit of bias that the adjustments totally fail to address and no mention of “critically evaluating” each station pair as bdg falsely insists.
Nonetheless Hausfather concludes ““the effectiveness of adjustments during this period is at least suggestive that the PHA will perform well in periods prior to the introduction of the USCRN”
Yet they do admit, “this conclusion is somewhat tempered by the potential changing nature of inhomogeneities over time.”
And the biggest adjustments to average temperatures happened to data over 80 years old while populations have nearly tripled.
Yep. That’s what Hausfather says. USHCN-adj isn’t perfect but it does match USCRN better than USHCN-raw although the USHCN-raw wasn’t that far off to begin with. His finding was consistent with analysis performed by those before and after him.
Nick,
Do you have evidence like metadata or planned studies that show observers always taking their observations and resetting the thermometer pegs exactly on the designated hour? Should you not have a distribution of times around the designated time for each observer? If we accept that observers were not always on the button, do you ignore the time axis and do your TOBs adjustment on knowlingly incorrect data, risking compounding of errors? Or is it better, as some here claim, to report only the raw observations with a note that known effects were at work to produce an estimate of the error, thus shown attached?
Why institutionalise the error calculation when smart scientists examine the data before they proceed and make their own caveats? Geoff S
Geoff,

Yes, there is evidence. Observers, when resetting the minmax thermometers, noted the temperature. DeGaetano back-calculated using the diurnal cycle to infer the time of obs, relative to what it was supposed to be. It came out well
This procedure merely gave a 90% accurate estimate of morning vs. afternoon, but does not address the question about any inconsistency in observation times.
In addition, DeGaetano found that “the procedure’s ability to estimate observation time decreases considerably at stations where the average annual interdiurnal temperature range is less than 1.7°C”, which includes Death Valley -so the study shows that the TOBS change doesn’t have a detectable effect at this site, much less a change whose magnitude could be accurately predicted.
“the procedure’s ability to estimate observation time decreases considerably at stations where the average annual interdiurnal temperature range is less than 1.7°C”, which includes Death Valley”
Did you mean this?
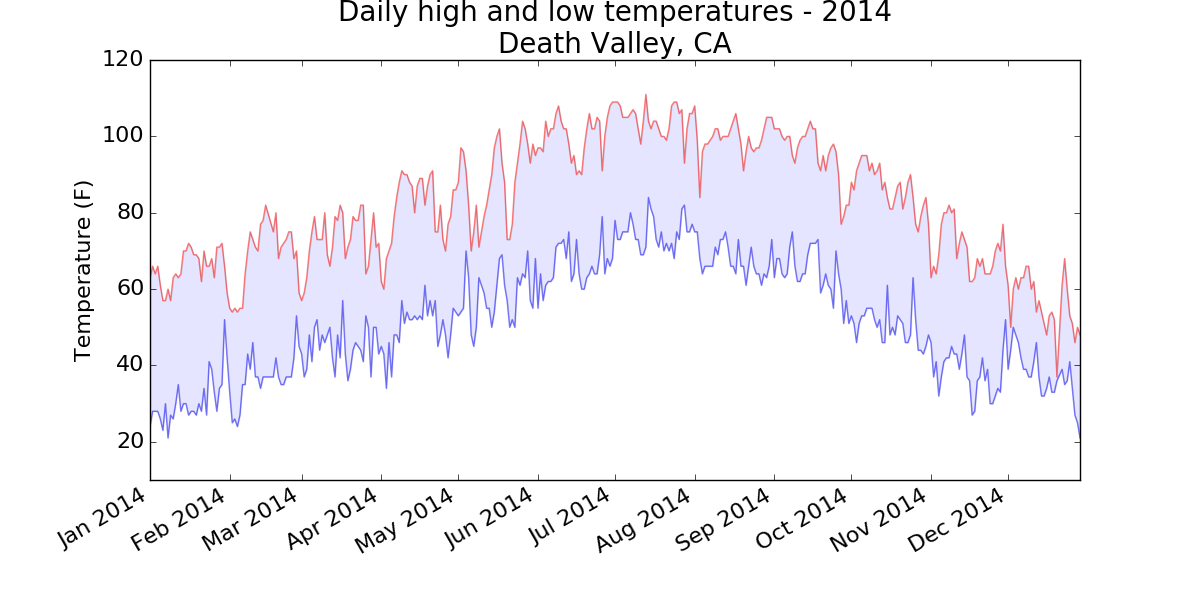
Because it would be a very rare station whose diurnal temp variation is less than 1.7C.
And it certainly does not apply to Death Valley, as that is the very reason why it gets so hot!
https://www.wunderground.com/cat6/Death-Valley-Sets-US-Record-Hottest-Month-1080F-Average-Temperature
Anthony, I believe you misread the quote from the study. The interdiurnal temperature variation is the difference between high temps from one day to the next, not the difference between high and low during any one day, so it refers to the following data from your link:
DATE MAX
7/24 127°F
7/25 127°F
7/26 127°F
7/27 127°F
7/28 124°F
7/29 124°F
7/30 123°F
The sum of interdiurnal changes was 4 degrees F over the six days from the start of the heat wave, giving an average of 0.67 F, which is only 0.37 C.
That is just six days; they talk about the annual interdiurnal temperature.
The six days is enough to explain the concept and show that Death Valley can fall well within the parameters, which were the points Anthony Banton had incorrect. The annual average falls in line as well.
It is still complete guesswork, A few clouds come along after the obs were taken, no increase in temperature, a few clouds before the reading was taken and the reading would be low.
I do not believe that every single record sheet was analysed for all characteristics that could negate the guesswork.
The presence or absence of clouds does not effect a min/max instrument’s ability to record tmin/tmax. Don’t hear what I didn’t say. I didn’t say that clouds have no effect on tmin/tmax. They obviously do just like a hundred other things. What they don’t do is effect the instrument ability to record the tmin/tmax whatever they happen to be. The TOB bias is not caused by any element that makes the tmin/tmax what they are. It is caused by the way the observer uses the instrument and specifically when they reset it.
Given that authorities round the world have been unable to satisfy FOI requests to provide proof of isolation of SARS CoV-2, it’s not clear what virus Wade is talking about. In any case, if this is the best Wuhan can do in terms of creating a bioweapon, we can all relax. https://www.fluoridefreepeel.ca/68-health-science-institutions-globally-all-failed-to-cite-even-1-record-of-sars-cov-2-purification-by-anyone-anywhere-ever/
The email leaks and the rush to speculate on a doctored virus is just a strategy to reinforce the essential story of a lethal virus (the one that kills people over the age of life expectancy).
Sorry, that is not correct, those FOI requests were sent to the wrong places.
If they have no “isolation” of the actual virus as you and they say perhaps you can suggest how they can recognise a new strain?
Or do you think they are lying about them as well?
How do you think that they identified the modifications that were made in the laboratory and described so clearly in the Scientific papers published by the Scientists working in the Wuhan lab?
Thanks for the post. Please fix the TYPO “En” to “in” per the Royal Society’s motto.
“The Royal Society’s motto ‘Nullius in verba’ is taken to mean ‘take nobody’s word for it’. It is an expression of the determination of Fellows to withstand the domination of authority and to verify all statements by an appeal to facts determined by experiment.”
History of the Royal Society | Royal Society
True. It’s Latin, not Spanish.
I’m amused that Death Valley apparently now has a mild climate not unlike our own here in Newcastle, Australia.
Surely the place is misnamed since it’s clearly a veritable garden of delights.
According to Stokes, they take the temp readings at midnight now. I’ve been to Death Valley at night in August, pretty darn cold.
No, they take readings continuously. Tmax is now the max over a calendar day.
Why not continue taking it at one point in the day, at exactly the same time as they did before?
The fiddling about is just there to hide the fraud.
Well, 5pm is biased warm. 8am is biased cold. Each is because of the risk of double-counting an extreme. Midnight has little risk of that kind, so is as near as possible unbiased.
Times have changed anyway in the past. There is no point in preserving forever the last bias that was present.
So essentially, you’re admitting the data from back in the day can’t be compared to modern data. i.e. claims of thermageddon-style temp trends are rather, um, pants.
TOB was changed primarily to address issues with precipitation observations. PM obs were more contaminated with evaporation effects than AM obs. Note that precipitation, tmin, and tmax were all recorded at the same time.
Not at all Bruce but there are those who like to pretend that prior to the automobile Death Valley was a veritable garden of Eden.
Hmmm. I wonder what tripped the wire and sent this message into “waiting for approval”.
I’ve had a couple of those. It may be D_e_a_t_h
“Surely [Death Valley] is misnamed since it’s clearly a veritable garden of delights.”
I think you may be confusing it with its neighbor, Near-Death Valley…
If the November 2009 release of all those emails gave us a peek through the keyhole at what was going on in a room on the 3rd floor of the hotel “Climate Change” i.e., lewd and lascivious debauchery, what do you suppose was going on in all the other rooms?
When the first apple out of the barrel is rotten . . . .
As expected
Take no one’s word.
Odd reference from someone who still has couple tablespoons of the climate Kool Aid in his veins.
Ah, let he who is without sin cast the first stone.
Or as some say you are only as good as your last gig.