Surprising glacial and nearly ice-free periods in last 66 million years
Rutgers University

New research by Rutgers scientists reaffirms that modern sea-level rise is linked to human activities and not to changes in Earth’s orbit.
Surprisingly, the Earth had nearly ice-free conditions with carbon dioxide levels not much higher than today and had glacial periods in times previously believed to be ice-free over the last 66 million years, according to a paper published in the journal Science Advances.
“Our team showed that the Earth’s history of glaciation was more complex than previously thought,” said lead author Kenneth G. Miller, a Distinguished Professor in the Department of Earth and Planetary Sciences in the School of Arts and Sciences at Rutgers University-New Brunswick. “Although carbon dioxide levels had an important influence on ice-free periods, minor variations in the Earth’s orbit were the dominant factor in terms of ice volume and sea-level changes – until modern times.”
Sea-level rise, which has accelerated in recent decades, threatens to permanently inundate densely populated coastal cities and communities, other low-lying lands and costly infrastructure by 2100. It also poses a grave threat to many ecosystems and economies.
The paper reconstructed the history of sea levels and glaciation since the age of the dinosaurs ended. Scientists compared estimates of the global average sea level, based on deep-sea geochemistry data, with continental margin records. Continental margins, which include the relatively shallow ocean waters over a continental shelf, can extend hundreds of miles from the coast.
The study showed that periods of nearly ice-free conditions, such as 17 million to 13 million years ago, occurred when the concentration of atmospheric carbon dioxide – a key greenhouse gas driving climate change – was not much higher than today. However, glacial periods occurred when the Earth was previously thought to be ice-free, such as from 48 million to 34 million years ago.
“We demonstrate that although atmospheric carbon dioxide had an important influence on ice-free periods on Earth, ice volume and sea-level changes prior to human influences were linked primarily to minor variations in the Earth’s orbit and distance from the sun,” Miller said.
The largest sea-level decline took place during the last glacial period about 20,000 years ago, when the water level dropped by about 400 feet. That was followed by a foot per decade rise in sea level – a rapid pace that slowed from 10,000 to 2,000 years ago. Sea-level rise was then at a standstill until around 1900, when rates began rising as human activities began influencing the climate.
Future work reconstructing the history of sea-level changes before 48 million years ago is needed to determine the times when the Earth was entirely ice-free, the role of atmospheric carbon dioxide in glaciation and the cause of the natural fall in atmospheric carbon dioxide before humans.
Rutgers coauthors include Professor James V. Browning, doctoral student W. John Schmelz and professors Robert E. Kopp, Gregory S. Mountain and James D. Wright, the senior author of the study.
###
So orbital changes were the primary driver for sea level changes for the entire history of the earth but now humans are the primary driver of SL change. Ok, that makes total sense.
Clown 🌍.
Clowns are better at what they do than these charlatans.
Quite. Today we are held responsible for a 6 to 8cm rise in global sea levels while nature was responsible for a 12,000 cm sea level at the end of the last Glacial Maximum (or whatever its called). I need to look at those numbers again.
12,000 cm – Nature doing its thing
00,008 cm – Human’s ‘fault’
You just have to be in another intergalactic planetary orbit to see it clearly earthling. You could use the bong instead of handballing it on you know.
You have to understand that they assume that not only are we responsible for any changes of any kind, they also think that we can control these changes with out actions or, rather, non-actions (getting rid of modern society and humanity in general. Great hubris.
It makes sense to the Children of the CO2RN Cult.
wRutgers = wRong!
I would really like Andy May to respond to this piece of ‘research’. My own reaction is somewhat blunt and Anglo-Saxon in its character – but I’m sure Andy’s would be erudite and put the whole thing in some kind of context.
Orbital changes would currently have us cooling.
“Finally, Earth is currently in an interglacial period (a period of milder climate between Ice Ages). If there were no human influences on climate, scientists say Earth’s current orbital positions within the Milankovitch cycles predict our planet should be cooling, not warming, continuing a long-term cooling trend that began 6,000 years ago.”
https://climate.nasa.gov/blog/2949/why-milankovitch-orbital-cycles-cant-explain-earths-current-warming/
If true, then what we are contributing is life saving.
That’s fracking hilarious!
Science News March 1, 1975
According to modern climate “science,” without CO2, it would now be colder than it was when “The Ice Age Cometh”…
To the extent AGW exists, it has contributed to Earth being slightly warmer than the coldest climate of the Holocene, the Little Ice Age.
Science was 6:1 warming:cooling in the 1970’s.
https://journals.ametsoc.org/doi/abs/10.1175/2008BAMS2370.1
The MSM got it really wrong.
https://www.insidescience.org/news/my-1975-cooling-world-story-doesnt-make-todays-climate-scientists-wrong
It was cooling from ~1944 to 1978. That’s a simple fact.
https://woodfortrees.org/plot/hadcrut4gl/mean:12/from:1944/to:1978/plot/hadcrut4gl/from:1944/to:1978/trend
The cooling was so pronounced, that atmospheric CO2 stopped rising for at least a decade, despite increasing emissions.
MacFarling-Meure, C., D. Etheridge, C. Trudinger, P. Steele, R. Langenfelds, T. van Ommen, A. Smith, and J. Elkins (2006). “Law Dome CO2, CH4 and N2O ice core records extended to 2000 years BP“. Geophys. Res. Lett., 33, L14810, doi:10.1029/2006GL026152.
I know it was cooling. That cooling was attributed to increased industrial aerosols from the war and post-war boom by Schneider and Rasool (1971). The Clean Air Acts. designed to reduce smog, reduced those aerosols.
“Effects on the global temperature of large increases in carbon dioxide and aerosol densities in the atmosphere of Earth have been computed. It is found that, although the addition of carbon dioxide in the atmosphere does increase the surface temperature, the rate of temperature increase diminishes with increasing carbon dioxide in the atmosphere. For aerosols, however, the net effect of increase in density is to reduce the surface temperature of Earth. Because of the exponential dependence of the backscattering, the rate of temperature decrease is augmented with increasing aerosol content. An increase by only a factor of 4 in global aerosol background concentration may be sufficient to reduce the surface temperature by as much as 3.5 ° K. If sustained over a period of several years, such a temperature decrease over the whole globe is believed to be sufficient to trigger an ice age.”
https://science.sciencemag.org/content/173/3992/138
That cooling has been attributed to many causes.
But… The fact is that the climate models indicate that it would be cooler now than it was in 1975-1978, That 70’s Climate Crisis Show, without AGW.
You are forgetting that Schneider and Rasool was predicated on continued industrial aerosols emissions. That would have been anthropogenic cooling. Humans can affect climate.
You are forgetting that science was 6:1 warming:cooling. https://journals.ametsoc.org/doi/abs/10.1175/2008BAMS2370.1
You are forgetting Climatic Change: Are We on the Brink of a Pronounced Global Warming?
Wallace S. Broecker
Neither the Clean Air Act nor the reduction in aerosol emissions caused the Pacific Climate Shift of 1976 and the reversal from a La Niña to El Niño dominated ENSO.
Neither revisionist history nor Wally Broecker alters the fact that the climate models indicate that the cooling would have continued without AGW, irrespective of the Clean Air Act and reduction in aerosol pollution and that global cooling was the crisis du jour in the 1970’s.
Try to follow along.
According to modern climate “science,” without CO2, it would now be colder than it was when “The Ice Age Cometh”…
To the extent AGW exists, it has contributed to Earth being slightly warmer than the coldest climate of the Holocene, the Little Ice Age.
The model is from IPCC AR4.
The mid-20th Century cooling is totally explained by natural forcing and the reduction in aerosol emissions would not have reversed the cooling… If the climate models are right.
So what role did industrial aerosols play? Volcanic aerosols have the same effect, only shorter.
We don’t know exactly how industrial areosol emissions affect the climate. Certain types of volanc eruptions inject massive volumes of sulfate aerosols into the stratosphere. These clearly do cause transient episodes of cooling.
The primary global cooling concern of the 1970’s was that aerosol emissions, dust, etc. were causing the cooling and would make it worse.
And as Schneider and Rasool point out. CO2 is inducting warming, aerosols are inducing cooling.
“It is found that, although the addition of carbon dioxide in the atmosphere does increase the surface temperature, the rate of temperature increase diminishes with increasing carbon dioxide in the atmosphere. For aerosols, however, the net effect of increase in density is to reduce the surface temperature of Earth. Because of the exponential dependence of the backscattering, the rate of temperature decrease is augmented with increasing aerosol content. ”
Reducing the aerosols reduces the cooling effect, and warming resumes.
Aerosols have to be injected into the stratosphere to cause significant cooling.
Nope
https://earthobservatory.nasa.gov/features/Aerosols/page4.php
Show me data where aerosol-seeded clouds caused significant cooling… Data, not narratives.
El Chichón and Pinatubo clearly caused sharp, brief transient cooling episodes because they injected a massive volume of sulfate aerosols into the stratosphere.
The notion that aerosol-seeded cloud formation drives climate change is interesting, might even be real (Svenmark), but not clearly supported by data.
You guys are hilarious. There was time when Schneider and Rasool was cited as evidence that science claimed a cooling period. Now that the paper has been fact-checked, you deny its existence.
Here is the paper it has data. Read it.
http://pdfs.semanticscholar.org/4db2/1045b17ebcdd6a8c6adeb1f42eb5c2c39270.pdf
Models aren’t data. A 1971 model that was wrong isn’t data either
So what is your null hypothesis and what data supports it?
Null hypothesis to what?
To AGW
https://wattsupwiththat.com/2017/04/17/the-good-the-bad-and-the-null-hypothesis/
I will use you line og f thinking when someone who is dismissive of cliamte science askes me the sme question.
Lots there:
Christy’s graph debunked. http://www.realclimate.org/index.php/archives/2016/05/comparing-models-to-the-satellite-datasets/
Projections assessed
https://www.carbonbrief.org/analysis-how-well-have-climate-models-projected-global-warming
Roger Olsen tracks climate projections:
https://www.quora.com/How-accurate-have-climate-change-predictions-been-in-the-past/answers/152375325?ch=10&share=d62a71ba&srid=u61p
WTF does this gibberish have to do with defining a null hypothesis?
Clumsy fingers
I will use your line of thinking when someone who is dismissive of climate science asks me the same question.
WTF does this gibberish have to do with defining a null hypothesis
The gibberish had nothing to do with the typos.
This is a strawman:
From the first sentence.
“When debating the merits of the CAGW (catastrophic anthropogenic global warming) hypothesis, “
How? You quoted a phrase, not an argument or even a full sentence.
Duh CAGW. Why would I bother to read further?
Because you don’t even remotely comprehend what a hypothesis is, much less a null hypothesis.
This is not a scientific hypothesis:
More CO2 will cause some warming.
It is arm waving.
This is a scientific hypothesis:
A doubling of atmospheric CO2 will cause the lower troposphere to warm by ___ °C.
Thirty-plus years of failed climate models have never been able to fill in the blank.
They have presented a range.
If you want precise prediction try augury.
WTF does this have to do with a hypothesis, much less testing it?
@Jack Dale
Sulfate aerosols cool climate less than assumed
And what’s now ?
They did attribute the cooling to aerosols, unfortunately for them, they never demonstrated that the cooling was due to aerosols.
Climate science have a long history of making claims and skipping the proof part.
Regardless, the biggest problem with attributing the cooling to aerosols was the fact that the cooling was world wide, yet aerosols were almost completely a northern hemisphere phenomena.
Volcanic eruptions result in global cooling.
So Jack, you are admitting that much of the warming during the 80’s and 90’s was due to the elimination of aerosols?
With the additional CO2.
“It is found that, although the addition of carbon dioxide in the atmosphere does increase the surface temperature,”
How much does CO2 increase the surface temperature? The truth is the author doesn’t know the answer to this, yet makes out like the answer is known. That’s deception, or ignorance. I suppose it could also be both.
The current IPCC guess about CO2 warmth is between 1.5C per doubling to 4.5C per doubling. So how much does CO2 increase the surface temperature? See the wide range of guesses, kids? And the author implies he knows what the number is. 1.5C? 4.5C? He doesn’t know, regardless of what he claims, and noone else knows either. That’s why there is such a wide range.
Claims about CO2 and atmospheric warming are all pure speculation. Human-Caused Climate Change is all pure speculation. There is not one bit of evidence establishing that CO2 controls the Earth’s climate in any way. Not one bit. Anyone who says there is, doesn’t know what they are talking about.
It is known. Read this and you will know.
http://acmg.seas.harvard.edu/people/faculty/djj/book/bookchap7.html
“They did attribute the cooling to aerosols, unfortunately for them, they never demonstrated that the cooling was due to aerosols. Climate science have a long history of making claims and skipping the proof part.”
Exactly right!
I recall when they first started making claims about Human-Caused Global Cooling and I did not reject the concept out of hand, I thought it might be plausible and was eager to see what evidence they had to back up these claims.
But it turns out that Human-Caused Global Cooling is just like Human-Caused Global Warming: All speculation and no evidence to back up the speculation. The Human-Caused Global Cooling speculation set me up perfectly to be a big skeptic of Human-Caused Global Warming. I had seen this type of clown show before.
Those who claim that human-derived aerosols cause a noticable cooling of the Earth are basing their claims on what a few volcanoes have done in the past. We *do* have evidence that a large volcanic eruption can cool the Earth’s atmosphere by a degree or two for a year or two, so the promoters of Human-Caused Global Cooling point to the volcanoes and say see, the atmosphere can be cooled. What they don’t tell you is that human-derived aerosols amount to a tiny fraction of a volcanic eruption.
Like there is no evidence for Human-Caused Global Warming, there is also no evidence for Human-Caused Global Cooling.
Not enough aerosols and not high enough in the atmosphere.
I thought we had put Human-Caused Global Cooling to bed, but I guess not, at least for some.
The current scare is nothing more than propaganda as well.
The science is only over whelmingly in favor of CO2 causing warming if you declare that anything you disagree with, isn’t science.
@ur momisugly Jack Dale “You are forgetting that Schneider and Rasool was predicated on continued industrial aerosols emissions.”
Since there is steep cooling since 2000, just like from the 30s to the 70s, what is the cause of that, since you/they can’t blame aerosols from WW2 and Keeling says CO2 still shooting up?
Really, Jack, this is grasping at fog. So lame.
This steep cooling?
2000 4 0.05
2020 4 0.38
https://www.nsstc.uah.edu/data/msu/v6.0/tlt/uahncdc_lt_6.0.txt
Dale, you just go around and around. Is that your deal? Thick headed denial? You just ignore all the times your little claims and posts have been completely trashed here, and just repost them?
NOAA says the globe is cooling, part of the natural organic sine wave currently on the down … it will bottom out … it will rise again … it will cool again … it will rise again, but not quite as high … until …………………… glaciation.
I’m not going to post anything in support. I’ve already smashed the ball to you many times. You are impervious to reality.
Jack quoted in part: “[…] scientists say Earth’s current orbital positions within the Milankovitch cycles predict our planet should be cooling, […]”
Our planet is cooling. Each succeeding optimum has been cooler and each subsequent cold period has been colder than the prior optimums and cold periods of this interglacial.
The Rutgers team is looking at glacials and interglacials over millions of years, but when they get to the present interglacial they seem to be only looking at the last 30-40 years.
According to the various reconstructions I’ve seen, temperatures have been stair stepping down from the maximum we hit coming out of the most recent glaciation.
Am I missing something? Did I miss a graph showing the opposite over the last 10-12,000 years?
Milankovitch Cycles are a proposed mechanism, but how much evidence is really there? Presumably, minor changes in orbit means minor changes in solar insolation. So it IS the Sun after all.
Insolation is not the same as solar output, which varies about 0.1%
If you stand closer to a fire you will feel warmer, the fire did not increase in intensity.
The Warmistas are only proposing minor changes in the thermal budget as well.
Yes, you missed a graph
You missed a retraction.
http://www.bishop-hill.net/blog/2013/6/14/met-office-withdraws-article-about-marcotts-hockey-stick.html
and another:
https://climateaudit.org/2015/01/08/ground-truthing-marcott/
and another:
https://climateaudit.org/2013/03/31/the-marcott-filibuster/
Marcott was not retracted. A Met blog post about Marcott was retracted according to Bishops Hill. The My Climate and Me website does not include the Bishops Hill quote.
You omitted this part of the paragraph from RealClimate:
“Although not part of our study, high-resolution paleoclimate data from the past ~130 years have been compiled from various geological archives, and confirm the general features of warming trend over this time interval (Anderson, D.M. et al., 2013, Geophysical Research Letters, v. 40, p. 189-193; http://www.agu.org/journals/pip/gl/2012GL054271-pip.pdf).”
You really should use original sources and all of the material. Otherwise you could be accused of contextomizing.
http://www.realclimate.org/index.php/archives/2013/03/response-by-marcott-et-al/
Jack, that graph looks suspiciously like Mann’s hockey stick? in 2006, the National Academy of Science NAS reviewed Mann’s paper about that graph, and drew the following conclusions:
– the Mann method tended to bias his results
– Mann’s reconstruction failed statistical significance tests
– in general across the fields uncertainties of these reconstructions are being underestimated
– the bristlecones shouldn’t be used for these reconstructions [and McKittrick says without the bristlecones you can’t even get the hockey stick shape]
There is a great interview with Prof. Steve McKittrick here (September 17, 2019):
https://soundcloud.com/user-694711047/finding-fault-in-the-hockey-stick-guest-dr-ross-mckittrick
In that 2019 interview, Dr. McKittrick says “One thing I found that’s been disappointing is that those conclusions from the National Academy Panel have largely been ignored. So, like I say they still use the bristlecones, they still systematically underestimate the uncertainties in their reconstructions and make very strong bold claims based on small noisy datasets that they’re using. I think that there’s still work to be done in that field to really improve their methodology.”
http://environmentalforest.blogspot.com/2013/10/enough-hockey-sticks-for-team.html
I omitted a reference to Lucia’s Blackboard which gives the recipe for creating the hockey stick. http://rankexploits.com/musings/2009/tricking-yourself-into-cherry-picking/
Over 3 dozen hockey sticks from different researchers using different methodologies and different data sets.
http://environmentalforest.blogspot.com/2013/10/enough-hockey-sticks-for-team.html
Curious set of links of supposed “independent” methodologies and data sets. Just looking at the first 3 after the Mann debacle paper results in:
1) A 404 error.
2) A simulation of forcings so no actual data to speak of.
3) One set of bore hole data.
I guess you can consider batting 33% to be good if you’re in baseball.
A handful acoloytes using the same bad data and the same bad methods get the same bad results.
And some alarmists think this is a big deal.
Cooling since 2000 years
Source
Marcott shows 6000 years of cooling. So cooling over the past 2000 years is not surprising. The instrumental record shows long term warming.
From one of the authors of the Esper paper, Robert Wilson:
“Our paper is for northern Scandinavian summer temperatures so extrapolating to large scale annual temperatures is not really correct. However, previous regional tree-ring series have been used in large scale compilations and if there are low frequency biases in ring-width series, then it is likely that previous attempts may underestimate temperatures in previous warm periods such as the RWP [Roman Warm Period] and MCA [Medieval Climatic Anomaly]. More density series need to be developed from other regions to test this however.””
Jack Dale May 16, 2020 at 9:00 am
Yes, you missed a graph
No, I didn’t miss that graph. As tsk tsk points out, you missed a retraction and Marcotts disavowal of the robustness of the spike.
https://wattsupwiththat.com/2020/05/16/modern-sea-level-rise-linked-to-human-activities-rutgers-research-reaffirms/#comment-2995836
There are some good things to say about the Marcott reconstruction, but the spike isn’t one of them. There was some good discussion here at WUWT and on Climate for a couple of years after its publication. It’s good reading if you haven’t already done so.
Marcott was not retracted. A Met blog post about Marcott was retracted according to Bishops Hill. The My Climate and Me website does not include the Bishops Hill quote.
You omitted this part of the paragraph from RealClimate:
“Although not part of our study, high-resolution paleoclimate data from the past ~130 years have been compiled from various geological archives, and confirm the general features of warming trend over this time interval (Anderson, D.M. et al., 2013, Geophysical Research Letters, v. 40, p. 189-193; http://www.agu.org/journals/pip/gl/2012GL054271-pip.pdf).”
You really should use original sources and all of the material. Otherwise you could be accused of contextomizing.
http://www.realclimate.org/index.php/archives/2013/03/response-by-marcott-et-al/
The alarmists assure us that looking at any climate data older than 1979 is un-scientific.
Only total fools and paid charlatans believe that there are only two things that impact climate.
Some of the sea level “rise” is due to the solar wind.
We’ll run out of Oxygen long before the CO2 rises high enough to cause actual problems.
And we are cooler. The Sahara returned to desert about 6,000/5,000 years ago. Many Neolthic settlements in northern UK were abandoned 4,500 years ago as the climate cooled and worked it’s way south when Stone Henge was abandoned a 1,000 years later. Trees used to grow all the way to the top of Pen-y -Fan in Brecon (886 metres). The tree line is now 600 metres. The Little Ice Age was the coldest it’s been since temperatures came up out of the last glacial maximum, 11,000 years ago and the fact we have warmed up since is no indication that the overall trend is not down. There are no straight lines in nature especially temperature trends down into glaciation. All previous glacials show very unstable climates for millenia.
I love how doomsday scenarios love even dates, 2100 in this scenario. The world was supposed to end every 100 years for the past 2000 years.
The sea levels have been rising since the end of the Little Ice Age.
Modern rates are no higher than they have been since the end of the Little Ice Age.
Even the warmunists admit that nobody knows what cause the Little Ice Age, nor what caused it to end.
But rest assured, that whatever caused the end of the Little Ice Age stopped having any influence once man started burning fossil fuels.
The models have spoken.
https://m.youtube.com/watch?v=4FHhsWUgN-k
MarkW:
The people who wrote the models have spoken.
Didn’t need to open the posting to know it comes from EurekAlert!
Near the statue of liberty, shown just under the article title, is the Manhattan Battery Park tide gauge, showing no acceleration of sea level rise in the past 150 years.
Looks to me like a lot of assumed CO2 cause-and-effect.
Sure is. But they have it bass ackwards. Temperature is the cause, carbon dioxide is the effect. Not the other way around.
Study says: Co2 drive the climate and please send more money.
On one hand they declare that there is no need to debate since the science is settled.
On the other hand they tell us to send them lots of money because there is still so much to research.
Logic workshop for beginners
The study showed that periods of nearly ice-free conditions, such as 17 million to 13 million years ago, occurred when the concentration of atmospheric carbon dioxide – a key greenhouse gas driving climate change – was not much higher than today.
Discuss. Limit 128 words.
I don’t need 128 words Vuk. 1 will do.
BS.
That’s two words.
It’s one word. Unless you’re the type of chap that spells word like: mis hap.
So why have Al Gore, Bill Gates and Barmy Obama all bought sea front mansions for millions? They all say they believe this BS. Why is Harlech castle sea gate 3-4 metres, 10-15 feet, ABOVE
present high tide, built only 1000 years ago and geologically stable? Volcanoes under the unstable WAIS?
Isostatic rebound. See Map
Isostatic rebound. Uh huh. I live 20 miles south of Lake Michigan. We had over a mile of ice here a couple of millennia ago. You know how much the shore has rebounded in the past 500 years or so? Inches. In fact we are seeing near record highs for the lake level.
To anybody, I mean anybody who believes that Obama Gore, Gates and their ilk give a damn about climate (except in their bank vaults) is a complete and utter Fool.
The fact that these lies and hypocrisy have had such staying power speaks volumes to how corrupt the media is and are scientists in the pay of big government- something that has been warned of before!
Gore’s California home is 500 feet above sea level.
Gates’ home is on a lake.
Obama’ home is on a pond.
None are ocean front.
Obama’s is on Edgartown Great Pond. Except for a sand bar at South Beach, that IS the Atlantic Ocean. You can see the lame “protection” of it in the image at this link.
https://vineyardgazette.com/news/2019/12/04/president-obama-buys-home-edgartown-great-pond
The various sand bars of South Beach get annihilated now and then simply from big storms. When the IceMeltApocalypse promised by the Warming Community comes along, South Beach will be a joke – it will stop nothing.
Obama’s property will be one of the first to drown.
Sea level has a funny way of ignoring sand bars… 😎
Gates’ Del Mar estate and Obama’s Martha’s Vineyard mansion are less than 20′ above sea level. Gates’ estate is just above the high tide line.
https://wattsupwiththat.com/2019/08/28/sea-level-rise-dooms-obamas-new-martha-vineyard-mansion/
https://wattsupwiththat.com/2020/04/24/bill-gates-43m-beachfront-estate-proof-hes-a-wuwt-fan/
Jon Landau’s….Avatar, Titanic, etc….place is even lower
Maybe Jack was referring to sea level from the last glacial maximum. I’m sure he wouldn’t just make it up. Oh wait, 500 feet is 152m but sea level was only 120m lower at glacial max. I guess Jack is just a dull boy.
sea levels were up to 3m higher 5 – 7ky ago. sea level is falling just as temperatures are falling from the last optimum.
Yup.
Ask the authors for a list of Tide Gauges (>100 years Record length) anywhere on this planet that shows ANY acceleration outside of the 95 percent prediction zone!!!
Expect their reply to become “lost in the mail” – it will never arrive!
tomwys May 16, 2020 at 2:34 am
Here’s your list from the Permanent Service for Mean Sea Level
https://www.psmsl.org/data/obtaining/
Astoria, Balboa, Baltimore, Boston, Brest, Charelston I, Fernandia, Fremantle, Galveston, Galveston, Helsinki, Honolulu, Ketchikan, Key West, Kobenhavn, Los Angeles, Marseille, New York, Newlyn, Oslo, Pensacola, Philadelphia, Portland ME, San Diego, SanFrancisco, Seattle, Sewells Pt, Stockholm, Sydney, Trieste and Victoria.
There is some acceleration in most of them, seven are negative, the average is 0.0074 mm/yr² and extrapolated out to 2100 the average rise is 0.23 meters (9 inches).
They say:
Sea-level rise, which has accelerated in recent decades…
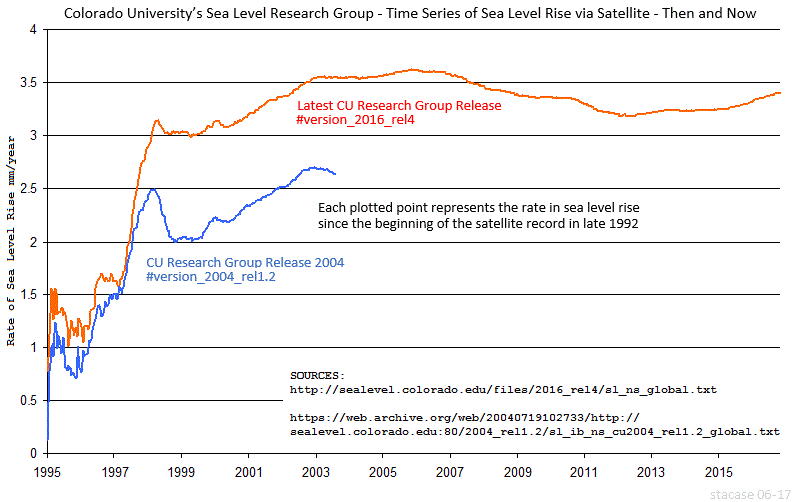
Recent [undefined] no doubt does not go back to 1950 when the rate of sea level rise was about the same as it is today. They have probably decided to use the satellite data which only goes back to 1992, and is problematical as the data has been extensively tampered with over the last two decades.
“Discuss. Limit 128 words.”
CO2 17MYA “…was not much higher than today.”
Proud pronouncements about CO2 levels derived from proxy methods have been shown to be ridiculous. Such as this:
https://theearthintime.com/stomata-vs-ice.pdf
(fluxing a mere 20 ppm over 2200 years including Younger Dryas and last melt) And that’s for the famous ice core method.
This piece mentions it’s method only in passing. First, prove your proxy measurement has credibility before you conclude the sky is falling.
“Surprisingly, the Earth had nearly ice-free conditions with carbon dioxide levels not much higher than today”
Isn’t this absolute proof that carbon dioxide doesn’t drive temperature? And it is in fact the other way around?
We’ve got similar levels of carbon dioxide, however, surprise surprise, we still have ice at the poles.
And yet, the rate of sea level rise has barely changed from 100 years ago.
“Sea-level rise was then at a standstill until around 1900, when rates began rising as human activities began influencing the climate.”
Do they truly believe that?
What’s the point of science or research anymore when you can just make up your own facts to suit your story?
The latest NASA ICESAT data covers 16 years, during which time the ice melt at the poles has led to 14mm of sea level rise.
There are 80 years left, until the end of this century, which happens to be 5 periods of 16 years. Thus on the basis of the latest and up to date Satellite data, we can expect to see just 70 mm (14 mm x 5) of sea level rise, or about 2.75 inches, by 2100.
So unless sea level rise begins to accelerate quickly, in the coming years, there is nothing to worry about.
No wonder that there is still high demand for sea front properties.
The sea level in 1900 was only a few millimeters higher than it was in 1899.
(Of course sea levels have only been rising by an average of a couple of millimeters per year since the end of the little ice age. But that doesn’t count. Everyone knows that all other climate influencers stopped working the instant man started burning fossil fuels.)
It’s theology. The development of doctrine. Start from the certain dogma and apply logic (poorly) to infer new insights.
“Sea-level rise was then at a standstill until around 1900, when rates began rising as human activities began influencing the climate”
But no evidence is presented to relate SLR to fossil fuel emissions such that climate action can be expected to halt or moderate the rate of sea level rise.
Pls see
https://tambonthongchai.com/2018/12/05/attenuate-slr/
https://tambonthongchai.com/2019/02/20/csiroslr/
The question is “Will sea level rise faster than the regular maintenance required for sea defences?”
If not then the costs of adaptation are vanishingly small.
Anyone predicting a foot rise in the next forty years?
If not, the cause of sea level rise is purely academic.
If those buildings closest to the sea are going to wear out and have to be replaced long before the sea reaches them, then the cost of adaptation is also vanishingly small.
In good old blighty we lose building (well doccumented in the media) close to the sea almost very year due to sea level.
That sea level is some 20 foot below the level of the buildings and continually erodes the edge of the land is just not important !
Geology question.
AFAIK
1. The India plate joined with Asia about 35 mya
2. Panama formed about 2-3 mya.
3. Plains such a Mongolia have being rising for several million years.
4. Orbital motions control climate.
5. But so does insulation and ocean currents
Q. Why is discussing ice free earth and ancient CO2 34 mya even relevant to the “current” earths climate?
My thoughts are- the earth was a different place 35mya, we only need to look at the last 3 at most.
Thanks David
The chart is very informative
So the Rutgers report is the usual mixture of actual facts and interpretations (spin, in their case). For instance, Rutgers says the sea level was rising, then paused, then began rising again due to human activities. The pause was the Little Ice Age, and I am happy the earth recovered from that. All of the detailed studies we have witnessed presented here at WATTS shows CO2 change lagging temperature change, ie, it’s ocean outgassing or uptake that is involved. This is politically correct clap-trap, and the students at Rutgers need to go back to their usual synchronized farting contests and leave the science to actual scientists. Stay sane and safe.
I’m just glad that Charles beat me to posting this. It saved me writing a 6,000 word post, mostly by cutting and pasting from my previous posts on Cenozoic CO2 and temperature.
“Sea-level rise, which has accelerated in recent decades”…
…which is total BS
What they meant to say was: ““Alarm about Sea-level rise, which has accelerated in recent decades”…
Science Advances is where science collapses.
When all you have is a hammer, every problem is a nail. All they have is CO2.
Junk science supported by new public access to weed and our tax monies. You only need to go back 120,000 years to see Greenland temperatures were up to 8 C degrees higher and oceans were up to 8 meters higher than today. The question is … how much coal were the Neanderthals burning back then?
https://www.nbi.ku.dk/english/news/news13/greenland-ice-cores-reveal-warm-climate-of-the-past
Even the period through the first 7000-8000 years of the Holocene had far less sea ice (often near zero sea ice), and higher sea levels than now.
These jackasses seem to disregard science. !
Basically they seem to have done zero literature review.
Those other guys weren’t “climate scientists”, therefore there work doesn’t count.
Of course had their work supported the “climate scientists”, then they would be promoted as saints who mustn’t be questioned.
climatology….a field of study only slightly less reputable than scientology.
The kind of things that happen when one watches Waterworld in a loop while smocking regulated substances.
“smocking regulated substances.”
Are you smocking something?
No Jeff, as it would impair my cognitive contextual interpretation of incoming information.
AKA common sense that could have allowed you to signal the typo without demonstrating your limitations.
This is unmitigated horst schist…
The sea-level decline of the last Pleistocene glacial stage didn’t take place about 20 kya. It started about 130 kya and ended about 20 kya… And it was unremarkable in the context of the Late Pleistocene.
It abruptly slowed about 9 kya, reaching its Holocene maximum between 7 and 3 kya.
Siddall et al., 2003 is a reconstruction of global sea level over the past 470,000 years constructed from Red Sea sediment cores. Here is the reconstruction since the last glacial maximum.
Older is toward the right. Note the error bar is ±12 meters.
Compared to the 20th and 21st centuries, sea level was oscillating wildly from 2 kya to 1900 AD.
Brock et al., 2008 featured the Holocene portion of Siddall’s reconstruction, clearly demonstrating that sea level was significantly higher than today for most of the past 3,000 years.
Sea level was falling from about 1 kya to 1850 AD due to neoglaciation. It’s been rising at a wholly unremarkable rate of about 1-3 mm/yr since the mid-19th century.
Sea level reconstruction from tide gauge data (Jevrejeva et al., 2014). Note rock pick added for scale. Older is toward the left.
Sea level reconstructions are terribly imprecise. Oxygen isotope chronologies can have error bars as large as 30 meters (Siddall et al., 2003). Dating error bars are also generally fairly large. Fossil terraced beaches provide some of the best evidence for past higher sea levels, but they aren’t particularly easy to put into an Excel spreadsheet. Uplift and subsidence of the land can have a large impact on local sea level changes. Woodroffe & Horton, 2005 (linked) provide an excellent summary of the methods and challenges in reconstructing paleo-sea level changes.
Evidence for the Mid- to Late-Holocene highstand(s) is not present everywhere. Evidence is lacking on the Mississippi delta (Törnqvist et al, 2004), probably due to rapid subsidence. While it may not have been universal or synchronous, there does appear to be strong evidence that Holocene sea levels were significantly higher than today over much of the world and that past natural oscillations were of much higher magnitude than observed sea level changes over the past ~200 years.
This is would be fraud in the private sector…
What’s the relevance of this bogus image to the subject of sea level rise? Unless it’s purely intended as satire, the only purpose it could serve is to feed alarmism.
Earth hasn’t been an ice-free world in nearly 40 million years. It’s as irrelevant to the science as an image of what a water-free world would look like.
This is how actual sea level rise relates to the Statue of Liberty.
Lady Liberty has nothing to fear from the Adjustocene Sea. What’s that? You can’t see the sea level trend? It’s right down there at sea level… between the water and the base of Liberty Island.
Thanks for this – enlightening. Bookmarked.
How on earth did the Rutger’s paper pass peer review?
Siddall’s figure 8 reconstruction seems to account rather nicely for the 1000 year old Harlech castle sea gates now being 3-5m above sea level, as someone remarked earlier.
CO2 Bad + Capitalism Bad = Pass Peer Review
Also… The actual peer reviewed paper bears little resemblance to the Eureka Alert (You Reek Alert) article.
Sad thing is that this paper is apparently from a PhD dissertation research
Many PhD theses are better than most peer reviewed papers written by tenured PhD’s.
I wouldn’t dismiss the precautionary principle so lightly. We could put a windmill on the torch and stick some solar panels on her to ward off evil spirits. Give her a Greta scowl perhaps?
If it keeps getting warmer, they’ll have to put Lady Liberty in a bikini.
Rutgers School of Arts and Sciences……..seems to me some of the staff ended up in the wrong department and decided to take artistic licence with the facts. As posited by others, these people seem just to make stuff up to fit their preferred narrative.
They aren’t sure if they will open this fall, but if they do, according to the picture in the following, Rutgers will require headscarves but not face masks.
https://coronavirus.rutgers.edu/
I will contribute to this claim: if you notice, someone took great pains to render a transition stripe around Lady Liberty at the “waterline,” and a tiny turbulence behind her right shoulder. The stripe looks like a tideline stain. This lends verisimilitude to the image.
It fooled me. I actually really for certain believed it was a photograph from the archives of the New York Times.
I suspect this contribution came from the Arts person on the project. She probably received an “A” that semester.
Dear colleagues,
Please, could somebody help me with a link to an original article with the manipulated picture (for example from the New York Times)? Of course a copy of the the article would also be great. I would be very thankful for such a piece of information.
Thank you in advance.
Hari, I hope you realize I was being ironic/satirical about seeing that image in the New York Times.
There is only a thin veil, however, between my joke and the reality – posting that image with a propaganda article would not be very far-fetched for that mighty organ of journalism.
More unmitigated horst schist…
17 to 13 Mya was not “nearly ice-free”.
Zachos et al., 2001 (older is toward the bottom).
And atmospheric CO2 could have been anywhere from 200 to 500 ppm during the Mid-Miocene Climatic Optimum (MMCO).
Neogene-Quaternary temperature and carbon dioxide (older is toward the left).
We can see that the range of estimates for MMCO range from 200 to 500 ppm, rendering any efforts to draw conclusions about CO2 and the MMCO totally pointless. According to Pagani et al, 1999:
Pagani et al., suggest that changes in oceanic circulation driven by plate tectonics (opening of the Drake Passage) and the presence (or lack thereof) of a large polar ice sheet were the primary drivers of Miocene climate change.
https://wattsupwiththat.com/2019/06/03/miocene-volcanism-carbon-dioxide-and-climate/
“Glacial periods” have occurred throughout the Cenozoic. This is why the sedimentary record demonstrates cyclical sea level changes. While the frequency of these cycles was lower during the Paleogene, they still occurred.
Global cycles of sea level change over Cenozoic Era, Vail et al., 1977.
https://wattsupwiththat.com/2018/08/01/the-guardian-climate-change-denial-wont-even-benefit-oil-companies-soon-is-it-even-grammatically-possible-to-deny-climate-change/
Any “glacial periods” from 48 to 34 Mya occurred when the Earth was cooling (but much warmer than today) and atmospheric CO2 was anywhere from 400 to 2500 ppm.
https://wattsupwiththat.com/2019/09/30/eocene-climatic-optima-another-clean-kill-of-carbon-dioxide-driven-climate-change-hypothesis/
These people have simply demonstrated what geologists knew before Al Gore invented Gorebal warming: There is no evidence that CO2 was a primary driver of climate change over the past 66 million years.
When all you have is a hammer…
We’re all goin to drown. Quick run around like our hair is on fire. maybe we can drown the virus at the same time. One positive would be no more government.
I quit reading after this: “Sea-level rise, which has accelerated in recent decades”
The biggest danger is mathematical models causing mass hysteria.
Sea levels were a couple of higher than now only a couple of thousand years ago.
Anyone studying coastal geography knows that.
https://notrickszone.com/2020/05/14/several-new-papers-indicate-sea-levels-were-1-3-meters-higher-than-today-a-few-thousand-years-ago/
Archeological digs show the north shore of the Gulf of Mexico 50 miles north of today’s shoreline circa 4Kya.
The oceans are the biggest and most reliable thermometer proxies for Climate frequency (~30 year) data. In fact they are actual “thermal expansion” thermometers made more accurate by meltwater, runoff, and precipitation adjustments.
Is there a better proxy? Atmospheric temperatures don’t signuficantly drive ocean temperatures (look at the GAT noise against the linear tide gauge trends for 150 years).
The oceans (therefore the earth) has been warming steadily and linearly (with poly-cyclical GAT noise of known and unknown sources) for the last 150 years… after the LIA (LIA temperatures both oceanic and atmospheric were almost certainly driven by solar influences indicated by the application of Occam’s Razor to the near perfect synchronization of the LIA with the Maunder Minimum).
Breaking that SLR trend would be noteworthy but that has not happened. The tide gauge trend indicates a strong NATURAL VARIABILITY trend that NORMALLY would be expected to continue rather than not continue without a strong known cause. The 150 year trend continues. Nothing significant happened in 1950 (when CO2 levels began to rise) nor since from any lags (due to the overwhelming differences in heat capacity and mass between the atmosphere and the oceans).
These crap studies keep on rolling out because the Federal Government continues to fund only these types of studies. How does this funding trend continue during the Trump Administration? Half the population should not be forced to fund the destruction of its nation.