Arctic sea ice helps keep Earth cool, as its bright surface reflects the Sun’s energy back into space. Each year scientists use multiple satellites and data sets to track how much of the Arctic Ocean is covered in sea ice, but its thickness is harder to gauge. Initial results from NASA’s new Ice Cloud and land Elevation Satellite-2 (ICESat-2) suggest that the sea ice has thinned by as much as 20% since the end of the first ICESat mission (2003-2009), contrary to existing studies that find sea ice thickness has remained relatively constant in the last decade.
ICESat-2 has a laser altimeter, which uses pulses of light to precisely measure height down to about an inch. Each second, the instrument sends out 10,000 pulses of light that bounce off the surface of Earth and return to the satellite and records the length of time it takes to make that round trip. The light reflects off the first substance it hits, whether that’s open water, bare sea ice or snow that has accumulated on top of the ice, so scientists use a combination of ICESat-2 measurements and other data to calculate sea ice thickness.
By comparing ICESat-2 data with measurements from another satellite, researchers have also created the first satellite-based maps of the amount of snow that has accumulated on top of Arctic sea ice, tracking this insulating material.
“The Arctic sea ice pack has changed dramatically since monitoring from satellites began more than four decades ago,” said Nathan Kurtz, ICESat-2 deputy project scientist at NASA’s Goddard Space Flight Center in Greenbelt, Maryland. “The extraordinary accuracy and year-round measurement capability of ICESat-2 provides an exciting new tool to allow us to better understand the mechanisms leading to these changes, and what this means for the future.”

Scientists have used NASA’s ICESat-2 to measure the thickness of Arctic sea ice, as well as the depth of snow on the ice. Here, ridges and cracks have formed in sea ice in the Arctic Ocean. Credits: NASA / Jeremy Harbeck
Arctic sea ice thickness dropped drastically in the first decade of the 21st Century, as measured by the first ICESat mission from 2003 to 2009 and other methods. The European Space Agency’s CryoSat-2, launched in 2010, has measured a relatively consistent thickness in Arctic sea ice since then. With the launch of ICESat-2 in 2018, researchers looked to this new way of measuring sea ice thickness to advance the study of this data record.
“We can’t get thickness just from ICESat-2 itself, but we can use other data to derive the measurement,” said Petty. For example, the researchers subtract out the height of snow on top of the sea ice by using computer models that estimate snowfall. “The first results were very encouraging.”
In their study, published recently in the Journal of Geophysical Research: Oceans, Petty and his colleagues generated maps of Arctic sea ice thickness from October 2018 to April 2019 and saw the ice thickening through the winter as expected.
Overall, however, calculations using ICESat-2 found that the ice was thinner during that time period than what researchers have found using CryoSat-2 data. Petty’s group also found that small but significant 20% decline in sea ice thickness by comparing February/March 2019 ICESat-2 measurements with those calculated using ICESat in February/March 2008 – a decline that the CryoSat-2 researchers don’t see in their data.
These are two very different approaches to measuring sea ice, Petty said, each with its own limitations and benefits. CryoSat-2 carries a radar to measure height, as opposed to ICESat-2’s lidar, and radar mostly passes through snow to measure the top of the ice. Radar measurements like the ones from CryoSat-2 could be thrown off by seawater flooding the ice, he noted. In addition, ICESat-2 is still a young mission and the computer algorithms are still being refined, he said, which could ultimately change the thickness findings.
“I think we’re going to learn a lot from having these two approaches to measuring ice thickness. They might be giving us an upper and lower bound on the sea ice thickness, and the right answer is probably somewhere in between,” Petty said. “There are reasons why ICESat-2 estimates could be low, and reasons why CryoSat-2 could be high, and we need to do more work to understand and bring these measurements in line with each other.”
With ICESat-2 and CryoSat-2 using two different methods to measure ice thickness – one measuring the top of the snow, the other the boundary between the bottom of the snow layer and the top of the ice layer – but researchers realized they could combine the two to calculate the snow depth.
“This is the first time ever that we can get snow depth across the entire Arctic Ocean’s sea ice cover,” said Ron Kwok, a sea ice scientist at NASA’s Jet Propulsion Laboratory in Southern California and author of another study in JGR Oceans. “The Arctic region is a desert – but what snow we do get is very important in terms of the climate and insulating sea ice.”
The study found that snow starts building up slowly in October, when newly formed ice has an average of about 2 inches (5 centimeters) of snow on it and multiyear ice has an average of 5.5 inches (14 cm) of snow. Snowfall picks up later in the winter in December and January and reaches its maximum depth in April, when the relatively new ice has an average of 6.7 inches (17 cm) and the older ice has an average of 10.6 inches (27 cm) of snow.
When the snow melts in the spring, it can pool up on the sea ice – those melt ponds absorb heat from the Sun and can warm up the ice faster, just one of the impacts of snow on ice.
For more information on ICESat-2, visit www.nasa.gov/icesat-2 or icesat-2.gsfc.nasa.gov
NASA’s Goddard Space Flight Center, Greenbelt, Maryland Last Updated: May 14, 2020 Editor: Kate Ramsayer
Every summer more icebreakers sail in arctic, but NO, Icebreakers has nothing to do with melting ice.
I don’t think icebreakers have much to do with ice melt, but they could stop and measure the thickness of the ice and snow from time to time and pass the results to NASA so that they could compare the satellite readings to the actual measurments..
Or is that too easy?
Do icebreakers contribute to climate change?
When icebreakers travel through sea ice, they leave trails of open water in their wake. Dark open water does not reflect nearly as much sunlight as ice does, so sometimes people wonder if icebreakers speed up or exacerbate sea ice decline.
In summer, the passages created by icebreakers do increase local summertime melting because the ships cut through the ice and expose new areas of water to warm air. However, the melt caused by an icebreaker is small and localized. Channels created by icebreakers are quite narrow and few in number compared to natural gaps in the ice. In winter, any openings caused by icebreakers will quickly freeze over again. So, scientists do not think that icebreakers play a significant role in accelerating the decline in Arctic sea ice.
http://nsidc.org/arcticseaicenews/faq/#icebreakers
If there was no ice no icebreakers would be needed. ALgore;The Goreacle says there is no ice, so clearly all those icebreakers need to be scrapped!
2 problems with your fantasy.
1) At those latitudes, the difference in reflectivity between ice and open waters is very small.
2) Open water loses heat to the air a lot faster than ice does.
Open water in the arctic results in more heat loss, not less.
The albedo effect of open water is less that that of ice.
https://www.nature.com/articles/s41598-017-08467-z
Not at low angles of incidence.
Dale
Nothing in the Nature article you linked leads me to believe that the authors have any familiarity with Fresnel’s equation for specular reflection. It appears that they are using the albedo of snow/ice as a weighted fraction of the surface area, and ignoring the specular reflection of the water. It appears to be fundamentally flawed research. That is, they are ignoring an easily calculated parameter, perhaps out of ignorance.
Also when the ice melts, you get more clouds, so whilst the ice albedo may decrease, it is off set by an increase in cloud albedo, leading to less sun light making it to the surface.
There are negative feedbacks built into the system, and that is why the climate has remained so remarkably stable.
Dale
You remarked about “Dark open water.” The water looks dark because there are very few suspended solids responsible for diffuse reflectance. All the sunlight is specularly reflected, meaning you can only observe the reflected sunlight if one is observing from the correct direction and the correct angle.
Snow and ice appear much brighter because they are diffuse reflectors that disperse reflected light nearly equally in all directions. That is, no matter where one observes, snow always looks bright.
Calm, flat water can have a reflectance greater than snow if the sunlight is just glancing the surface. However, it will still look dark for observers not looking towards the sun.
On average, snow covered surfaces will usually have greater reflectance, compared to water. However, the ratio is usually overstated for high latitudes.
https://wattsupwiththat.com/2016/09/12/why-albedo-is-the-wrong-measure-of-reflectivity-for-modeling-climate/
“Sea ice has a much higher albedo compared to other Earth surfaces, such as the surrounding ocean. A typical ocean albedo is approximately 0.06, while bare sea ice varies from approximately 0.5 to 0.7. This means that the ocean reflects only 6 percent of the incoming solar radiation and absorbs the rest, while sea ice reflects 50 to 70 percent of the incoming energy. The sea ice absorbs less solar energy and keeps the surface cooler.”
https://nsidc.org/cryosphere/seaice/processes/albedo.html
LOL, below about 10 – 15 degrees incidence, you get nearly 100% reflectivity from water. !
The angle of incidence on the summer solstice.
90N – 23.5
70N 43.5
66.5N 47
Check out the rest here: http://www.physicalgeography.net/fundamentals/6h.html
Jack, the summer solstice happens to be the single day with the most sunshine. The rest of the year the sun is even lower on the horizon, and at times beneath it.
Dale
You keep good company. Neither you, or apparently the authors, really understand the Sun-Earth geometry. At the equinox the angle of incidence at the pole is 90 deg, and the reflectance off water is 100%. At the Summer Solstice, the angle of incidence at the pole is 66.5 (90-23.5) deg for a reflectance of about 10%. However, it seems that you are overlooking the fact that on the other side of the pole, the Arctic ocean is illuminated and reaches 100% at latitude 66.5N. That is, the point of tangency, (100% reflectance) stays within the Arctic Circle through the seasons, moving northward from the Winter Solstice to the North Pole at the Equinox, thence southward to the far side of the Earth during the sunlit Summer, and then reverses its course until there is no sunlight, at which point there is no incoming solar energy. So, at all times while there is sunlight within the Arctic Circle, there is a patch that has reflectance of 100%. That is why I stated that the impact of the ‘evil dark water’ is overstated.
It is often said that black carbon deposits on the ice, causing rapid melting of the surface. It is often claimed that this is a leading cause of melting of glaciers and the Greenland ice sheet.
Well, others beg to differ.
https://www.bbc.com/news/science-environment-40686984
It si typically alarmist with the usual hand-wringing, but it highlights something that is not black carbon and not created by fossil fuels. It is algae! Lots of it, and it grows in the water on the ice definitely increasing the absorption of solar energy.
The useful question is, if all that black is (natural) algae, where is all the human influence from black carbon? We have to subtract the natural from the total to see if there is a remnant human contribution. The jury is still out.
From your link
“One concern now is that rising temperatures will allow algae to flourish not only on the slopes of the narrow margins of the ice-sheet but also on the flat areas in the far larger interior where melting could happen on a much bigger scale.”
Another wonderful computer model to putty over the gaps of missing knowledge.
Correct.
If I am covered in ice, it keeps me bloody cold too.
Never mind radiating anything back into space.
You would be a lot colder if you were covered in ice water.
I wonder how igloos (iglus) work
Snow is an insulator.
As is still air, which is fundamentally what makes snow an insulator.
That is correct. It is also the air in a down jacket that insulates.
Constrained air is an insulator. Air free to circulate, not so much.
In summation, NASA proves Arctic still covered with ice/snow. Imagine that!
Have these guys ever tried calibrating their satellite measurements by comparing them with real-world data gained by actually going to the Arctic and drilling through the ice to measure its thickness?
Real men don’t do calibration!
🙂 🙂 🙂
They don’t have to go, Graeme, they can ask the icebreakers to measure it for them. See above.
Graemethecat
When I was in the Army in 1967, and involved in a NASA overflight with an imaging microwave radiometer at Point Barrow, that is exactly what we did. We gathered ‘ground truth’ by augering holes through the ice to determine thickness. It seems science isn’t what it used to be.
One pertinent question. Did you keep your Mickey Mouse boots?
2hotel9
No, the boots were temporary issue while TDY. However, years later, I found a pair in a war surplus store and bought them. I still have them.
A story perhaps of interest, since you asked. Our weasel driver (tracked vehicle) was a local native who worked for the army base in Barrow as a heavy equipment operator. He related a story to me. He was driving a dozer across a frozen river and it broke through the ice. He was wearing MM boots while driving. However, he took them off and put on a pair of mukluks for the 20 mile hike to get help.
I wore a pair during a five week schools support attachment at Ft Sill, January and February. I was less than impressed. When I was up in AK to work and hunt, is either ever mutually exclusive of the other, I had my own gear. 1/2 was USG issue, the boots weren’t.
2hotel9
Mickey Mouse boots do have their downsides. During the work, the battery died in our weasel. My civilian supervisor instructed me to walk back to the Army base to get help. Despite being young and in reasonably good shape, walking 10 miles in big, heavy boots took a toll on me. I was very sore the next day! Fortunately, I didn’t run across any polar bears on the hike; I was unarmed! I think that the boots are best when you are sitting in a very cold environment. They aren’t good for long-distance walking and inhibit one’s mobility. As our driver knew very well and was why he always took his mukluks with him off base.
Standing still they are warm, even un-inflated. I can’t wear insulated boots, my feet sweat even in house slippers! Winter I wear Carolina Logger boots, unlined and non-steel toe, in the real freezing weather 20 and below I got a pair of thinsulate lined muck boots and have to dry them out every night. And a weasel? Was that a Gamagoat, by chance? Or some older multi-wheeled or tracked vehicle?
Mukluks are made from untanned sealskin and are pretty useless above -20 C. It must have been pretty cold on those long walks. However on the basis of weight alone it would be crazy not to switch when distance was involved. The genius of Arctic traditional wear is astonishing. Each part of each piece of clothing has a preferred animal contributor. For example the fuzzy rim of the hood of a parka – has to be wolverine. Exhaled breath moisture condenses on the hood, but ice doesn’t stick to wolverine fur. Makes a perfect selection.
2hotel9
After all these years I don’t remember much about it. There was room for the three of us and our gear. It was a tracked vehicle. It was only referred to as a “weasel.”
Just curious, I help some friends restore old military vehicles from time to time and always on the prod for people who might have pics of some from late ’50s and through the ’60s. Some oddball stuff in USG inventory through that time.
2hotel9
I might actually have a picture of at least part of it. I don’t remember whether it is on a super8 reel that I have or if it might be 35mm. I think I remember a picture of me in my parka standing alongside of the weasel.
I called my restoring friend and he knew immediately. A tracked cargo hauler from WWII, the first being M28 and called Weasel, the later models kinda got stuck with the name though they were a good bit different, ya know how GIs are. What you were in was most likely M29, had a boat like hull and engine in front, original was pretty much a box with tracks and engine in rear.
Yes, we did it at the Arctic stations. Do they do it now? I do not know. Today if the data does not agree with some model, we change the data like NASA/NOAA do with the temperatures.
You were doing real and honest science. Today’s climate “scientists” have replaced empirical and tangible reality with computer modelling fantasies.
“Have these guys ever tried calibrating their satellite measurements by comparing them with real-world data gained by actually going to the Arctic and drilling through the ice to measure its thickness?”
yes but every time they go to the arctic to do this, skeptics scream it is a stunt
Really? I knew men who did exactly that, both poles, and no one ever questioned their honesty. Oh, yea, they dealt in reality. Not numerical fantasies.
Where are the screams? Or did you just make it up now like the data?
Steven
Got any cites for those “…every time they go to the arctic to do this…” screams?
The quotes must be all over the place if skeptics did this every time.
How hard can it be to drill a couple hundred holes to calibrate satellite data? Geez; I can’t even believe we’re having this conversation.
It amazes me, what with this younger generation being all about going out into nature and whatnot, that 100s of volunteers aren’t screaming to go to the Arctic to prove how evil humans are destroying the climate. Hell, just think of all the selfies they could be posting!
‘ For example, the researchers subtract out the height of snow on top of the sea ice by using computer models that estimate snowfall. “The first results were very encouraging.”
All I need to know. Computer models for predicting future temperatures and deaths from Covid19 and now this. I have no doubt they will find that the ice is thinning and we need urgent action.
Mosher
Just like you ‘always’ exaggerate! 🙂
Just to be clear, LIDAR only measures the height of the snow on top of the ice. It cannot “see” the ice layer below. RADAR can see the ice boundary and sees growth. So the LIDAR folks create a model to estimate how deep the snow “should” be to predict the height of the ice layer it can’t see… and THAT calculation shows a 20% decline in sea ice thickness. Gotcha. Oh, and the 20% loss is by comparison to the original mission which was widely panned as a failure, and wasn’t accurate enough to even estimate growth or decline (but shaded heavily to growth). Feels like hubris. Without a method to calibrate the model… it should produce results in line with the placement of the modelers thumb.
It also seems like more snow accumulation should be good, but all it does is melt in spring and then increase ice melt. Darn.
Heads you win tails I lose
First it insulates, then when it melts it can speed icemelt, so it’s probably a wash.
I’d like to see some data that proves that these melt water pools speed ice melt.
Lidar may be able to calculate the distance between the satellite and the top of the snow to one inch. However, do they know the height of the satellite to one inch?
MarkW
You asked, “… do they know the height of the satellite to one inch?” I sincerely doubt it!
I’m sure there is a computer model which can tell them that.
They use the lid at to calibrste the satellite position and the same reading to calculate the distance between the two. Couldn’t be easier.
Lol
Herein lies the problem:
“For example, the researchers subtract out the height of snow on top of the sea ice by using computer models that estimate snowfall.”
Computer models that guesstimate the height of snow are seemingly what leads to a decline in ice thickness in NASA’s eyes when Cryosat using direct radar measurements shows no real change.
Here we go again another model like the ones created to Reduce early 20th century temperatures and Increase more recent ones in pursuit of political man-made ‘global warming’ – sure seems to be Man Made with those methods.
Oh my, the ice appears to be getting thicker!
No problem. We just adjust the snow model. Deeper snow, thinner ice. Problem solved. Never mind that the model now says that last year there was no ice, just floating snow. We can fix that too. The carburetors on the satellite are wearing out, so there’s a drift we need to adjust for over time. Maybe if we add sharks with frickin laser beams on their heads. Oh sorry, wrong movie.
Perhaps it goes like this: Satellite measures height of top of snow. Computer model estimates thickness of ice. Difference must be thickness of snow. Top of snow is getting higher. Estimated top of ice is getting lower. Therefore snow is getting thicker.
Now comes the clever bit: by subtracting snow thickness from snow top height, they can work out that the ice is getting thinner. QED.
So was the system designed to recalibrate correctly if the thickness and average density of the atmosphere changed since it was launched?
No.
Has the thickness and average density of the atmosphere changed since it was launched?
Yes.
Color me skeptical. Warmunists like Wadhams used to argue losing ice coverage (area). But it has stopped declining, as surmised in 2014 essay Northwest Passage in my ebook Blowing Smoke. So on to declining thickness using a method that sees snow, not ice. Fail.
Unless the satellite measurements and other supporting models are calibrated with a subset of simultaneous real time ‘boots on ice’ measurements of snow and ice thicknesses, this is little better than an effort in (gu)estimation.
But, but, but, its high dollar gu}estimation!
Adjustimation?
That would cost more, part of the Bronze Deluxe Package!
Here are the snow models in case you’re interested
https://www.wmagazine.com/gallery/models-skiing-snowboarding-holiday-vacation/
I always wondered how the snow models kept from freezing off their bunny tails.
Quote #1 from above NASA PR: “The extraordinary accuracy and year-round measurement capability of ICESat-2 provides an exciting new tool to allow us to better understand . . .”
Quote #2 from the above NASA PR: “ ‘We can’t get thickness just from ICESat-2 itself, but we can use other data to derive the measurement,’ said Petty. For example, the researchers subtract out the height of snow on top of the sea ice by using computer models that estimate snowfall.”
Ahhh . . . the ol’ trick of using computer models to produce DATA, leading in turn to specious claims.
In Xuanji etal 2016 we find that relative to iceSat-2, PIOMAS overestimates sea ice thickness by 0.31 meters (a very small and fixed error). If this is true then trends in sea ice volume computed with icesat-2 should not be different from trends in sea ice volume computed with piomas.
Here is my PIOMAS sea ice volume trend analyis
https://tambonthongchai.com/2019/11/07/precipitous-decline-in-arctic-sea-ice-volume/
Here is the abstract from xuanji 2016 published on ResearchGate
In this study, six Arctic sea ice thickness products are compared: the AVHRR Polar Pathfinder-extended (APP-x), ICESat, CryoSat-2, SMOS, NASA IceBridge aircraft flights, and the Pan-Arctic Ice Ocean Modeling and Assimilation System (PIOMAS). The satellite products are based on three different retrieval methods: an energy budget approach, measurements of ice freeboard, and the relationship between passive microwave brightness temperatures and thin ice thickness. Inter-comparisons are done for the periods of overlap from 2003 to 2013. Results show that ICESat sea ice is thicker than APP-x and PIOMAS overall, particularly along the north coast of Greenland and Canadian Archipelago. The relative differences of APP-x and PIOMAS with ICESat are −0.48 m and −0.31 m, respectively. APP-x underestimates thickness relative to CryoSat-2, with a mean difference of −0.19 m. The biases for APP-x, PIOMAS, and CryoSat-2 relative to IceBridge thicknesses are 0.18 m, 0.18 m, and 0.29 m. The mean difference between SMOS and CryoSat-2 for 0~1 m thick ice is 0.13 m in March and −0.24 m in October. All satellite-retrieved ice thickness products and PIOMAS overestimate the thickness of thin ice (1 m or less) compared to IceBridge for which SMOS has the smallest bias (0.26 m). The spatial correlation between the datasets indicates that APP-x and PIOMAS are the most similar, followed by APP-x and CryoSat.
Link to xuanji 2016
https://www.researchgate.net/publication/307429069_Comparison_of_Arctic_Sea_Ice_Thickness_from_Satellites_Aircraft_and_PIOMAS_Data
I was sailing along smoothly….and then this happened:
“For example, the researchers subtract out the height of snow on top of the sea ice by using computer models that estimate snowfall. “The first results were very encouraging.”
Another dreaded “computer model”.
Full Stop.
It’s also another uncalibrated model. Nobody has gone out and measured the actual levels of snow to confirm that the snow model is correct.
Of course the models are correct. We got the correct result of thinning ice didn’t we?
TomBR
The approach has all the character of using a random number generator to multiply reliable measurements.
Adjustimation?
My Climate Scientology word of the day.
Oh!!! Combining climate and scientology!!! You a bad man!!!!!!(does it really need a sarc tag?)
Thought experiment: How many adult polar bears can dance on the head of a pin? ZERO!
NO! You’re WRONG! The correct answer is 50. Oh, wait, did I forget to mention that the pin is a giant 50 dancing polar bear sized pin?
Mickey
First, you have to teach them to dance.
No problem. Just heat up the pin.
otsar
+1
“Arctic sea ice helps keep Earth cool, as its bright surface reflects the Sun’s energy back into space.”
I seriously doubt the effect is very measurable. There have been several times in the last couple decades where much of the northern hemisphere was covered in snow and ice in Winter, yet it didn’t get colder, the snow melted. They started right off poisoning the well.
I agree. The amount of energy from the sun hitting either pole is relatively small when compared to the full energy at the equator upto 80° N or Sth
“Observational determination of albedo decrease caused by vanishing Arctic sea ice”
“Abstract
The decline of Arctic sea ice has been documented in over 30 y of satellite passive microwave observations. The resulting darkening of the Arctic and its amplification of global warming was hypothesized almost 50 y ago but has yet to be verified with direct observations. This study uses satellite radiation budget measurements along with satellite microwave sea ice data to document the Arctic-wide decrease in planetary albedo and its amplifying effect on the warming. The analysis reveals a striking relationship between planetary albedo and sea ice cover, quantities inferred from two independent satellite instruments. We find that the Arctic planetary albedo has decreased from 0.52 to 0.48 between 1979 and 2011, corresponding to an additional 6.4 ± 0.9 W/m2 of solar energy input into the Arctic Ocean region since 1979. Averaged over the globe, this albedo decrease corresponds to a forcing that is 25% as large as that due to the change in CO2 during this period, considerably larger than expectations from models and other less direct recent estimates. Changes in cloudiness appear to play a negligible role in observed Arctic darkening, thus reducing the possibility of Arctic cloud albedo feedbacks mitigating future Arctic warming.”
https://www.pnas.org/content/111/9/3322
“We find that the Arctic planetary albedo has decreased from 0.52 to 0.48 between 1979 and 2011, corresponding to an additional 6.4 ± 0.9 W/m2 of solar energy input into the Arctic Ocean region since 1979. Averaged over the globe…”
Arctic planetary albedo?? Since when does the Arctic cover the planet? And averaging a small albedo change in one area over the globe sounds extremely nonsensical.
“Averaged over the globe, this albedo decrease corresponds to a forcing that is 25% as large as that due to the change in CO2 during this period…”
They don’t know the CO2 forcing, they have a very rough guesstimate. Junk upon junk.
Cute Litte girl focused on a coloring book is seated next to a “climate scientist” on an airplane.
The scientist asks the little girl if she knows she’ll die in a few years, either from heat or drowning.
The little girl looks at the “scientist” and asks: if cows, deer, and horses all eat the same grass, can you explain why horse poop is baseball-size clumps, deer excrete raisin-size pellets, and cows poop is a large, puddle of almost-liquid ooze?
The “scientist”, somewhat taken aback, responds “No, I can’t; why do you ask?”
The little girl looks at the “scientist: an says: You claim to average the temperature all over the world on a daily basis, calculate various global energy budgets, and blame 100% of global warming on a single molecule that represents 0.04% of the atmosphere, but you don’t know shit!”
I have seen much the same piece, only it is a farmer on vacation.
“… and blame 100% of global warming on a single molecule that represents 0.04% of the atmosphere, but you don’t know shit!”
Would that be the same “molecule” that can miraculously “green” the planet?
By increasing by ~40% since preindustrial.
Which also happens to be the major part of the just 1% of the atmosphere that has the property of being able to intercept LWIR.
Seems so, by all observation and theory this last ~150 years.
Despite some science free “sceptical” (LOL) handwaving on this Blog.
Funny that.
“was hypothesized almost 50 y ago but has yet to be verified with direct observations.”
Because it does not exist ?
Read past that sentence.
” This study uses satellite radiation budget measurements along with satellite microwave sea ice data to document the Arctic-wide decrease in planetary albedo and its amplifying effect on the warming. The analysis reveals a striking relationship between planetary albedo and sea ice cover, quantities inferred from two independent satellite instruments. We find that the Arctic planetary albedo has decreased from 0.52 to 0.48 between 1979 and 2011, corresponding to an additional 6.4 ± 0.9 W/m2 of solar energy input into the Arctic Ocean region since 1979. “
Dale
The operative phrase here is “striking relationship.” They need to use the bidirectional reflectance distribution function (BRDF) for snow, calculated in latitudinal bands during the season of daylight, to account for the changing forward scattering lobe, arising from the changing sun angle. (It’s that forward scattering lobe that is usually responsible for Snow Blindness.) They then need to do a similar calculation of narrow latitudinal bands for the open water, using Fresnel’s equation to obtain the light scattered into space, but generally not observed by radiation budget satellites. A little calculus would go a long ways in better characterizing the “striking relationship!”
Considering the geometry and the obvious oversights, I’m certain that the 6.4 W/m2 is an overestimate. However, if they did a rigorous analysis, it might not be newsworthy.
Just because it doesn’t exist it doesn’t mean it can’t be used in models
And yet the Arctic is still covered with ice and snow. Funny how that works.
not on google earth it isnt covered,
not even minimum extent is covered,
no wonder modern `connected` youth think its in a death spiral
I used to copy&paste the Arctic Sea Ice Satellite composite image from NSIDC, then they made it not work anymore, apparently they did not want people to be able to see, year round, how much ice and snow is covering the Arctic. Imagine that,hiding reality.
Dale
One cannot derive the total reflectance of sunlight for a mix of ice and water with a low sun-angle, using an overhead passive microwave imager. The areal percentage of each component can be obtained, but the reflectance of water is much more strongly dependent on the sun angle than is the snow/ice. However, note that snow has a strong forward scattering lobe that is also dependent on sun angle.
I would characterize these studies as being naive, first-order approximations. They could, and should, refine their calculations!
Even if you could, you can’t reasonably extrapolate that to the rest of the globe, like they’re doing. That’s just garbage.
Below about 10-15 degrees incidence, you get near TOTAL external reflection.
Fred250
Actually, it is a little higher than that. For a snow albedo of 50-70%, an angle of incidence >83 deg will give specular reflections equal to or greater than snow albedo. However, any angle of incidence greater than about 60 deg will give a reflectance off water greater than Dale’s assumed 6% albedo. Therefore, all Arctic calculations for water that use 6% ‘albedo’ are unarguably too low.
“Below about 10-15 degrees incidence, you get near TOTAL external reflection.”
Not true, in fact spectacularly untrue ….
https://twin.sci-hub.tw/6109/f0523777214dfc1da225fdd74401afde/chapter-5-reflection-at-the-sea-surface-1976.pdf
“Reflectance of unpolarized radiant energy (sun + sky) from a horizontal water surface”
Solar altitude ( deg ) 90 60 50 40 30 20 10 5
Reflectance( % ). 3 3 3 4 6 12 27 42
So even at 5 deg angle of incidence only 42% of radiation is reflected.
Therefore 58% is absorbed …. and this is for a flat sea-surface – for a rough surface reflectivety is even less.
From: https://www.britannica.com/science/seawater/Optical-properties
“If the ocean is rough with waves, reflectance is increased when the Sun is at high elevation and decreased when it is at low elevation. “
The above in graphical form …..
Thanks. Do you have a link the web page with that graphic?
Anthony
Your ‘albedo’ chart for sea water goes off-scale (0.40) to an angle of incidence of about 82 degrees (sun elevation angle=8 deg). It is between there and 90 degrees angle of incidence that the reflectance (not albedo!) goes to 100%. If there is a diffuse albedo effect from suspended particles that contribute to the actual total outgoing energy, then the 100% could be achieved at less than 90 degrees. However, the more light that is reflected from the surface, the less that penetrates into the water and could then potentially be reflected back out.
Jack:
https://www.pvlighthouse.com.au/
Merci mucho.
By the time you get as far north as the arctic, the angle of the sun is so low that the difference in reflectivity between ice and water is negligible. In some circumstances, snow can easily absorb more solar energy than water does.
“Arctic sea ice helps keep Earth cool, as its bright surface reflects the Sun’s energy back into space”
When the very first line of an article is blatantly incorrect, how much hope can their be for the rest of it?
My first thought too
I am disappointed that they continue to advertise that the satellites can “measure” sea ice thickness. They seldom admit to all of the errors in the sea ice altitude that they do measure along with the errors in the computation to get sea ice thickness. I also think that few of these “scientists” really understand what sea ice really looks like. I have 30+ years running around the Arctic in nuclear submarines and have collected lots of sea ice data over the years for these scientists to improve their ice thickness computation, unfortunately for them it is a very difficult problem. Improving satellite accuracy and computing accurate sea ice thickness is much like nuclear fusion – it’s always 30 years away.
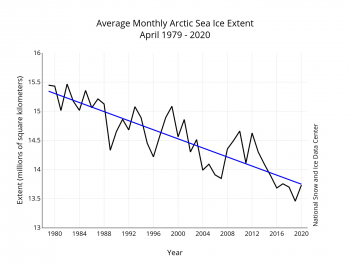
They talk about how much the ice has declined over the past 4 decades. They conveniently ignore the decade previous when they know full well that there was much less ice.
67 years of Arctic sea ice decline.
Yep, comes and goes. Point is it is still there. Nor is it going to disappear any time in the foreseeable future.
If you bothered to look at the graph you will see it mainly goes.
And yet it is still there, and not going away any time soon.
What part of “decline” do you not understand?
What part of climate does what it does in-spite of what humans do or think do you not understand?
What part of natural forcings would produce cooling did you miss? What part of global warming did you miss?
What part of the Arctic, and Antarctic, are still covered in ice&snow do you keep missing? You keep acting as if the climate doing what it has always done, changing constantly, is a bad thing. It is what it is, humans can’t stop it and humans ain’t causing it.
Natural factors would have us cooling. We are warming.
Keep telling yourself that. Don’t forget to click your heels together each time you say it.
Check out
https://climate.nasa.gov/blog/2949/why-milankovitch-orbital-cycles-cant-explain-earths-current-warming/
Milankovitch cycles would have us cooling
https://climate.nasa.gov/faq/14/is-the-sun-causing-global-warming/
Solar cycles would have us cooling. Temperature are increasing
Got to give you this, you are entertaining, in a sad sort of way. Wake up, you are being lied to by people who laugh at you believing their lies. Quite sad.
“Got to give you this, you are entertaining, in a sad sort of way. Wake up, you are being lied to by people who laugh at you believing their lies. Quite sad.”
Are you talking to yourself.
No scientific institution in any country on the entire planet endorses your nonsense. NADA, ZILCH, NONE. They also do not endorse creation science or the flat earth.
You are correct! They all spew the same “humans are destroying the environment” bullsh*t and you gobble it up like pizza. Again, quite sad, I would pity you but you have not earned any.
Call me when ice levels get down to the levels experienced during most of the Holocene Optimum.
@Jack Dale
ASE 1976-2020
Jack, that graph is not accurate. There is a lot better information showing that there was less ice before 1979. Anything from NSIDC is suspicious.
Start here:
https://realclimatescience.com/arctic-sea-ice-unchanged-from-60-years-ago/
Tony Heller – you have got to be joking.
Dale
You said, “… you have got to be joking.” Is that an ad hominem?
Speaks to the credibility of the poster and the link to which he posted.
Chip’n’Dale: What has Tony Heller said which is false?
Take your time, we’ll wait.
Heller’s claims about temperature manipulation have been refuted by none other than Judith Curry who called his analysis both “bogus” and “problematic”. She ran a three-part series on her blog in response.
https://judithcurry.com/2015/02/22/understanding-time-of-observation-bias/
https://judithcurry.com/2015/02/09/berkeley-earth-raw-versus-adjusted-temperature-data/
https://judithcurry.com/2014/07/07/understanding-adjustments-to-temperature-data/
He repeatedly makes the claim and is repeatedly refuted.
CLAIM
“[T]he raw data, the actual thermometer data[…] shows that the US has been cooling for 80 to 90 years. But the graphs they release to the public show warming trend, and it’s all because they’ve altered the data.”
VERDICT
SOURCE: Tony Heller, EXOMATRIXTV, 20 July 2019
DETAILS
Factually Inaccurate: Necessary adjustments to temperature datasets have, in total, reduced the apparent global warming trend since the late 1800s. Many independent datasets support the accuracy of these adjustments.
https://climatefeedback.org/claimreview/hosted-by-former-australian-senator-tony-heller-repeats-false-claim-that-scientists-fake-the-warming-trend/
Chip’n’Dale: Your “adjustments” to historic temperature data are better termed “manipulations”. Many thanks for making Heller’s point.
Did you bother to read the posts on Curry’s blog?
All temperature data sets, including Spencer and Christy, are adjusted.
Perhaps Chip’n’Dale can see some shrinkage of ice extent from 1971 to 2015. I certainly can’t
Try something more scientifically rigourous.
Out of what orifice did you dig those images?
Volume
http://psc.apl.uw.edu/wordpress/wp-content/uploads/schweiger/ice_volume/SPIOMASIceVolumeAnomalyCurrentV2.1.png
Extent
Decline in ice age
And yet the Arctic is still covered with ice and snow and will be for the foreseeable future. Speaking of ice, better go put some on that, its gonna leave a mark.
And the volume, extent and age of the ice is declining. All at a time when natural cycles would have us cooling.
Why is that?
More of the Arctic is ice free each September. It is not covered in ice and snow.
https://climate.nasa.gov/vital-signs/arctic-sea-ice/
Compare the September 2019 ice extent to the 1981-2010 median extent.
Do you consider that “covered”?
Please, keep making my point, I love it. Yes, Arctic is covered with ice and snow, in summer it melts back and in winter it refreezes, just like it has done for millennia and will continue to do for many more. Climate changes, always has and always will, humans are not causing it and can not stop it. The swelling is really showing, perhaps you should open the door all the way before walking through it. Reality is out here, you don’t have to be so terrified of it.
Natural factors would result in cooling. So what is causing the warming? Fairy dust?
In science mechanism + correlation = evidence of a causal relationship.
The mechanism of CO2 as a GHG has been known for 2 centuries.
https://history.aip.org/history/climate/index.htm#contents
250 years of correlation between CO2 and temperature.
http://berkeleyearth.org/summary-of-findings/
The null hypothesis, the warming is natural, fails.
Milankovitch cycles would have us cooling.
https://climate.nasa.gov/blog/2949/why-milankovitch-orbital-cycles-cant-explain-earths-current-warming/
Solar Cycles are declining.
https://climate.nasa.gov/faq/14/is-the-sun-causing-global-warming/
Cosmic rays have little effect on climate.
https://science.sciencemag.org/content/354/6316/1119
Natural cycles would have us cooling. We are warming? Why is that? Fairy dust.
http://images.remss.com/data/msu/graphics/TLT_v40/plots/RSS_TS_channel_TLT_Global_Land_And_Sea_v04_0.png
In science, mechanism + correlation = evidence of a causal relationship.
The mechanism of CO2 as a GHG has been known for 200 years.
https://history.aip.org/history/climate/index.htm#contents
The BEST study established a 250 year correlation between CO2 and temperature.
http://berkeleyearth.org/summary-of-findings/
Carbon isotope analysis attributes the nearly 50% increase in atmospheric CO2 since the mid 18th century to the burning of fossil fuels.
The null hypothesis, that the warming is natural, fails.
Milankovitch cycles would have us cooling.
https://climate.nasa.gov/blog/2949/why-milankovitch-orbital-cycles-cant-explain-earths-current-warming/
Solar cycles would have us cooling.
https://climate.nasa.gov/faq/14/is-the-sun-causing-global-warming/
Cosmic rays have little effect on climate.
https://science.sciencemag.org/content/354/6316/1119
Yes, everyone gets it, the Arctic is covered with ice and snow and there is nothing you can do to change it. Nothing you say matters, the ice and snow are still there and ain’t going away and neither of them care how you feel about it. Your apocalyptic fantasy is funny to watch, though.
So you having nothing to offer but an uninformed response.
In the immortal word of Harlan Ellison:
“You are not entitled to your opinion. You are entitled to your informed opinion. No one is entitled to be ignorant.”
Ah, you gonna stomp away? Don’t worry! The ice and snow will still be covering the Arctic when you get over yourself.
Now I recall our previous encounter. You are the black knight.
Ahh, ain’t you cute?!? Did your kid show you how to do that? Oh, and the ice and snow are still there, just like they are going to be long after you are gone, nothing you can do to change facts.
As there is a lack of options I will reply to myself.
Apart from the positive ENSO’s there has been little warming from 2002 to 2018.
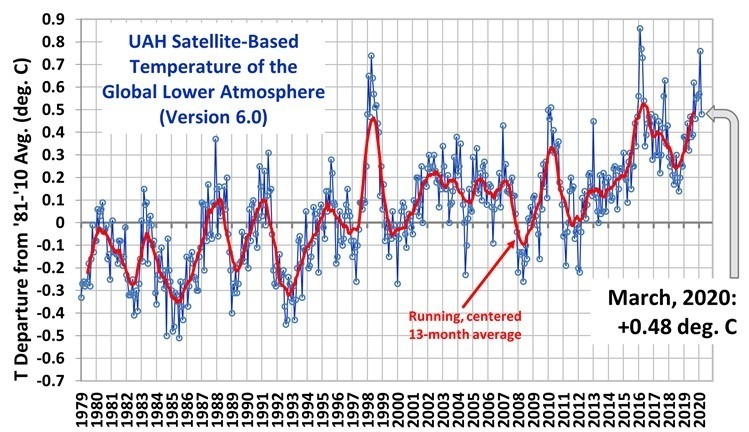
2019 was a warm year for sure but that can in no way be attributed to co2.
In the radiosonde data (which agrees well with the sat data – meaning it is correct) we can see that the temps in the late 50’s and the early 2000’s is the basically the same.
Fig 9 500 hPa…
https://agupubs.onlinelibrary.wiley.com/doi/full/10.1029/2004JD005753
Co2 has next to no effect on temperatures whether you want to believe it or not.
“Co2 has next to no effect on temperatures whether you want to believe it or not.”
Actually it’s the other way around.
Despite you and (some) ‘sceptics’ here say, science has known that CO2 is a GHG since the likes of Tyndall and Arrhenius ~150 ya.
Go tell the US airforce that their radiative algorithms are wrong and that their heat-seeking missiles will miss.
Should frighten them no end (sarc)
Banton: Explain why CO2 always FOLLOWS changes in temperatures in the ice-cores, never the other way round.
Alarmists like you don’t even understand cause and effect.
“Co2 has next to no effect on temperatures whether you want to believe it or not.” What it does effect is plant growth! Yay!
There is an independent source of ice thickness measurement that’s been operating since the late ’50s – U.S. nuclear attack submarines. Every sub that deploys north operates a narrow beam, high frequency acoustic under-ice profiler that constantly records ice depth. The Arctic Submarine Laboratory, San Diego, CA, has been providing those records to scientists since the late 90s (except for classified missions).
OK, here is a government resource that should be widely distributed! Lets us see just what HAS been going on.
“so scientists use a combination of ICESat-2 measurements and other data to calculate sea ice thickness. ”
So measuring to within an inch is kind of irrelevant. The precision is not there to claim a 20% loss (As well as using two different methods).
” “There are reasons why ICESat-2 estimates could be low, and reasons why CryoSat-2 could be high, and we need to do more work to understand and bring these measurements in line with each other.”
you mean they dont measure thickness with a ruler?
who knew that measuring things could result in uncertainty .
“who knew that measuring things could result in uncertainty” Not measuring is what leads to uncertainty.
Mosher
Lots of us knew. But, it seems that few alarmists admit to it.
ICESAT-2 orbits at ~ 308 miles. The laser pulses at 10KHz. It reads around a dozen photons for each pulse return. Arctic ice averages somewhere around 10 feet thick. Measuring changes in inches from 308 miles away with an orbit which is up, then down, then up again, seems like quite the challenge.
The uncertainty of the orbit, tracked by GPS, is larger than the changes in ice thickness as it sees each location every 91 days. They just gloss over this. There is no information about the calibration you mention anywhere on their published data. NASA in general does not talk about calibration, as it leads to ugly questions.
Maybe you could enlighten us. And please do not use GRACE, which was even worse.
Measuring from 308 miles of a surface which is highly irregular and much of which moves up/down and side to side in incalculable cycles? Just how accurate can it be, really?
RE: Steve Mosher, “who knew that measuring things could result in uncertainty .”
Apparently Mosh forgot to add, “That’s why adjustments are so important to raw data.”
“ICESat-2 has a laser altimeter, which uses pulses of light to precisely measure height down to about an inch.”
Is this type of satellite LIDAR used for sea level measurements which are quoted to tenths of a millimeter?
If you want to accurately resolve a distance of +/-1 inch over a distance of 308 miles, you will need an instrument accuracy of +/-1 part in 19.5 million. For repeated measurement, you need the instrument itself to also be stable to at least one order-of-magnitude better than that over the period you will be taking measurements unless you have frequent, on-going calibrations to correct for instrument “drift” that has a variety of causes. Also see discussion of other factors that reduce total ranging system accuracy far below that achievable by just the laser subsystem itself (https://aerialservicesinc.com/just-how-accurate-is-lidar/ ).
One considerable error source: the speed of light thru a physical medium is inversely proportional to the index of refraction of medium. How does a satellite-based LIDAR system accurately correct for the time varying properties of the air column that it passes through twice, considering spatially and temporally varying vertical profiles of pressure, temperature, humidity, atomic/molecular composition, and ionospheric ion and free electron composition? Answer: without very frequent calibration measurements against Earth surface targets having 3D position coordinates known to at least 33% better accuracy than the degree of LIDAR accuracy desired, it doesn’t. (From the above linked document: “ASPRS specifications and NSSDA guidelines state that base mapping accuracy must be assessed using [surface targets at] at least 20 surveyed ground control [points] that are [known to] at least 3 times more accurate than the mapping being tested. This can be quite difficult and expensive.”)
I seriously doubt that absolute accuracies in the range of 1e-7 to 1e-8 are possible in a LEO-satellite-based measurement system. The may claim precision to this degree . . . but accuracy, no.
And I daresay that a achieving a resolution accuracy 25 times better (i.e., to +/- 1 mm over this same distance), while it might be theoretically possible, will never be achieved in practice with a LEO-satellite-based LIDAR system.
Gordon:
Thanks for the discussion and the link.
IIRC after an earthquake in California not long ago some breathless MSM outlet talked about how scientists were using satellites to measure ground displacement to +/- 5cm (not mm).
Bill
NASA headline needs fixing:
Arctic sea ice
helps keepunnecessarily chills Earth off, limiting bio-productively and life in general.There, NASA. BTW, desist with the propaganda.