Guest Post by Willis Eschenbach
Gavin Schmidt is a computer programmer with the Goddard Institute of Space Sciences (GISS) and a noted climate alarmist. He has a Ph.D. in applied mathematics. He’s put together a twitter thread containing what he sees as some important points of the “testable, falsifiable science that supports a human cause of recent trends in global mean temperature”. He says that the slight ongoing rise in temperature is due to the increase in carbon dioxide (CO2) and other so-called “greenhouse gases”. For simplicity, I’ll call this the “CO2 Roolz Temperature” theory of climate. We’ve discussed Dr. Schmidt’s ideas before here on WUWT.
Now, Gavin and I have a bit of history. We first started corresponding by way of a climate mailing list moderated by Timo Hameraanta back around the turn of the century, before Facebook and Twitter.
The interesting part of our interaction was what convinced me that he was a lousy programmer. I asked him about his program, the GISS Global Climate Model. I was interested in how his model made sure that energy was conserved. I asked what happened at the end of each model timestep to verify that energy was neither created nor destroyed.
He said what I knew from my own experience in writing iterative models, that there is always some slight imbalance in energy from the beginning to the end of the timestep. If nothing else, the discrete digital nature of each calculation assures that there with be slight roundoff errors. If these are left uncorrected they can easily accumulate and bring the model down.
He said the way that the GISS model handled that imbalance was to take the excess or the shortage of energy and sprinkle it evenly over the entire planet.
Now, that seemed perfectly reasonable for trivial amounts of imbalance coming from digitization. But what if it were larger, and it arose from some problem with their calculations? What then?
So I asked him how large that energy imbalance typically was … and to my astonishment, he said he didn’t know.
Amazed, I asked if he had some computer version of a “Murphy Gauge” on the excess energy. A “Murphy Gauge” (below) is a gauge that allows for Murphy’s Law by letting you set an alarm if the variable goes outside of the expected range … which of course it will—Murphy says so. On the computer, the equivalent would be something in his model that would warn him if the excess or shortage of energy exceeded some set amount.

Nope. Not only did he have no Murphy Gauge set, but he also had no idea how far the model went off the rails regarding the conservation of energy, either on average or in individual timesteps. He just pushed it back into balance with each timestep, turned his back, and kept rolling.
At that point, I concluded that Gavin was far from suspicious enough of his model. Me, I wrote my first computer program in 1963, about the time that Gavin was born. And I don’t trust computer models one bit. They’ll bite the hand that feeds them at the slightest opportunity even if you fence them in with Murphy Gauges … and Gavin didn’t understand that basic problem.
This is particularly an issue with what are called “iterative” models. These are models that go step by step through time, with the output of each timestep being the input to the next timestep. Errors tend to accumulate in such models, so it’s very easy for them to spiral out of control … and climate models are all iterative models. Here’s a large number of runs from an iterative climate model.

Figure 1. 2,017 climate model runs from climateprediction.net.
Figure 1 (b), the lower of the two graphs, shows the change in temperature. Note how during the “control phase”, when there is no change in the inputs, even a small ongoing drop in temperature can lead to the model spiraling down to the “Snowball Earth” off the bottom of the graph, as shown in the control phase of the modeled temperature in Figure 1 (a).
So I’m suspicious as can be of all of the modern iterative climate models. They are all tuned to hindcast the past … but the climate sensitivities in all of them are different. How can that be? Well … it can’t. It means that they’re just making it up. I discussed this problem here, it’s a big one.
Next, let me make a heel turn to set the stage with an overview of the recent changes in climate. Back in Medieval times, around 1000 or so, the surface temperature was as warm or perhaps even warmer than it is today. But then the earth cooled and went into what is called the “Little Ice Age”. This was a hard time for plants, animals, and us humanoids alike. Shorter growing seasons, frozen rivers and harbors, crop failures. No bueno.

Why were the Medieval times so warm? We don’t know. Why did the temperatures drop down to the cold Little Ice Age? We don’t know. Why did temperatures stop dropping around 1700 and not 1400 or 1800? We don’t know.
After that very cold time, temperatures started rising again. And since about the year 1700 or so, temperatures have been rising, in fits or starts, at about a half a degree per century for the last two-plus centuries.
Why didn’t the temperature continue to cool after the Little Ice Age and put us into a glaciation? We don’t know. Why did it start to warm at the end of the Little Ice Age, rather than simply staying cold? We don’t know. Why did it start to warm around 1700 or so, rather than in 1900? We don’t know. Why have we seen slow warming since the Little Ice Age? We don’t know.
As you can see, although we know a lot about the climate … we also don’t know a lot about the climate.
In any case, with that as prologue, here is Gavin’s “falsifiable science” tweet. Bear in mind that I’m not saying he’s wrong because he is a careless programmer. That’s a separate question. I’m saying he’s wrong because he’s conflating three very different theories and treating them as one. Here’s his tweet.
We develop theories.
1) Radiative-transfer (e.g. Manabe and Wetherald, 1967)
2) Energy-balance models (Budyko 1961 and many subsequent papers)
3) GCMs (Phillips 1956, Hansen et al 1983, CMIP etc.)
We make falsifiable predictions. Here are just a few:
1967: increasing CO2 will cause the stratosphere to cool
1981: increasing CO2 will cause warming at surface to be detectable by 1990s
1988: warming from increasing GHGs will lead to increases in ocean heat content
1991: Eruption of Pinatubo will lead to ~2-3 yrs of cooling
2001: Increases in GHGs will be detectable in space-based spectra
2004: Increases in GHGs will lead to continued warming at ~0.18ºC/decade.
We test the predictions:
Stratospheric cooling? ✅
Detectable warming? ✅
OHC increase?✅
Pinatubo-related cooling?✅
Space-based changes in IR absorption? ✅
post-2004 continued warming?✅
Let me start by saying that Gavin is badly conflating three very separate and distinct theories.
- Theory 1) Increasing CO2 increases atmospheric absorption, which affects the overall temperature of the various layers of the atmosphere, and increases downwelling so-called “greenhouse” radiation.
- Theory 2) In the short term, large changes in downwelling radiation change the surface temperature.
- Theory 3) In the long term, small continuing increases in downwelling radiation lead to corresponding small continuing increases in global surface temperature.
Here the spoiler alert: I think that the first two of these are true (with caveats), but we have virtually no evidence that the third one is either true or untrue.
So let’s go through his six lines of evidence, consider which theory he’s actually discussing, and see if they stands up to critical examination.
a) Increasing CO2 will cause the stratosphere to cool. This is obviously evidence in support of theory 1. Here’s the record of stratospheric temperatures, from the Microwave Sounding Units on a succession of satellites.

Figure 2. Global stratospheric temperatures measured from space.
As you can see, although the stratospheric temperature has indeed dropped, the drop has been quite complex. The two peaks in the record are from the volcanoes noted in the graph. After each one, the stratosphere has warmed for about five years. Each time it seems to have stabilized at a lower temperature. There has been a slight drop since the second eruption. It’s likely that this is from the changes noted in Theory 1, although that is far from clear.
b) Increasing CO2 will cause warming at surface to be detectable by 1990s. This is supposed to be evidence in support of Theory 3. However, while this is true, the temperature has been rising for a couple of hundred years. So unless you believe in Little Ice Age SUVs, this is not evidence in support of any part of the “CO2 Roolz Temperature” theory.
c) Warming from increasing GHGs will lead to increases in ocean heat content. Same as (b) immediately above, and the same objection. It’s supposed to be in support of Theory 3, but in a warming world, a warming ocean is expected and not probative of anything.
d) Eruption of Pinatubo will lead to ~2-3 yrs of cooling. This is evidence in support of Theory 2 … but then so is the surface warming up when the sun rises. We know that large transient changes in the amount of downwelling radiation (which is called “forcing” in climate science) will change the surface temperature.
However, the models didn’t do a very good job of predicting the size of the cooling. Here are some results which I discussed in a post ten years ago:

Figure 2. Comparison of annual predictions with annual observations. Upper panel is Figure 2(b) from the GISS prediction paper, lower is my emulation from digitized data. Note that prior to 1977 the modern version of the GISS temperature data diverges from the 1992 version of the temperature data. I have used an anomaly of 1990 = 0.35 for the modern GISS data in order to agree with the old GISS version at the start of the prediction period. All other data is as in the original GISS prediction. Pinatubo prediction (blue line) is an annual average of their Figure 3 monthly results.
Note that the Hansen/Schmidt GISS model predicted more than twice the drop from Pinatubo compared to the actual reality. It also predicted that the drop would last longer than what happened. I’ll return to this question in a bit, but for now, we’ll note that Theory 2 is true—short-term changes in forcing, whether daily, monthly, or from volcanoes, do change the temperature.
e) Increases in GHGs will be detectable in space-based spectra. With more greenhouse gases in the atmosphere, we expect to see more infrared absorbed by the atmosphere. We’ve measured this change in a variety of ways. This is evidence in support of Theory 1.
f) Increases in GHGs will lead to continued warming at ~0.18ºC/decade. This is put up in support of Theory 3. However, it’s been warming for two or more centuries now, and this prediction in 2004 is nothing but the continuation of the prior thirty years of warming. Once again, the fact that it is still warming is not proof of anything.
To summarize:
• Theories 1 and 2 are clearly true and are supported by a variety of evidence. Three of his six bullet points are evidence in support of those two theories.
• The other three pieces of evidence are saying that after more than two centuries of slow warming … the warming is continuing. This says exactly nothing about Theory 3.
This is the continuing problem with the “CO2 Roolz Temperature” theory … it’s really three very separate theories in one, and while two of the theories are clearly true, there is very little evidence in support of the third leg of the stool. And the stool will not stand up with only two legs.
Gavin closes out his tweet with the following:
We can also look at the testable, falsifiable, theories that were tested, and failed.
Solar forcing? Fails the strat cooling test.❌
Ocean circulation change? Fails the OHC increase test ❌
Orbital forcing? Fails on multiple levels ❌
If you have a theory that you don’t think has been falsified, or you think you can falsify the mainstream conclusions, that’s great! We can test that too! (But lots of people have tried this already so expect there to be an answer already).
PS. Actually, it’s even a bit harder. Not only would you need to find a theory that does as well as the current theory, but you’d also need to show why the current theory isn’t operative.
Now, for folks unfamiliar with my work, I do have a theory. I also have a heap of evidence in support of it. But I’m not a climate skeptic—I’m a climate heretic, someone who denies their basic claim that changes in the temperature are a simple linear function of the changes in forcing.
Folks are interested in why the temperature of the planet changes over time. That’s at the center of modern climate science. My theory, on the other hand, arose from my being interested in a totally different question about climate—why is the temperature so stable? For example, over the 20th Century, the temperature only varied by ± 0.3°C. In the giant heat engine that is the climate, which is constantly using solar energy to circulate the oceans and the atmosphere, this is a variation of 0.1% … as someone who has dealt with a variety of heat engines, I can tell you that this is amazing stability. The system is ruled by nothing more solid than waves, wind, and water. So my question wasn’t why the climate changes as it does.
My question was, why is the climate so stable?
And my answer is, there are a host of what are called “emergent phenomena” that arise when local temperatures go above some local threshold. They include the timing and strength of the daily emergence of the cumulus cloud field in the tropics; the development of thunderstorms; the emergence of dust devils when temperatures get hot; the action of the El Nino/La Nina pump moving warm water to the poles; and various “oscillations” like the Pacific Decadal Oscillation.
These emergent phenomena arise out of nowhere, last for some length of time, and then disappear completely. And acting together, they all work to prevent both the overcooling and the overheating of the planet. And as mentioned above, I say that these phenomena acted to reduce the length and the depth of the effect of the Pinatubo volcano. See my post called “When Eruptions Don’t” for another look at how the climate system responds to a decrease in incoming solar energy due to volcanic eruptions.
I originally published this theory in the journal Energy and Environment. I followed that up with a posting of the same ideas here at Watts Up With That in a post called The Thermostat Hypothesis.
I have continued this quest by writing a number of posts over the last 20 years that have added observational evidence to the theory and explored its ramifications. These included “Emergent Climate Phenomena“, describing what emergence is and why it is so important; “The Details Are In The Devil“, explaining why the “climate sensitivity” type of analysis doesn’t work in a thermostatically controlled system; “Watching Thunderstorms Chase The Heat“, about how thunderstorms operate to cool only the warm parts of the tropical oceans; and most recently “Drying The Sky“, discussing the evolution of different stages in the tropical thermal regulation system.
In all, I’ve written some 40 or so posts exploring this theory of how the climate works. There’s an index to a number of them here, divided up by subject which covers up to January 2018 … hmm, I need to update the index. More recent posts of mine, not separated by subject, are listed here in reverse chronological order. [2021 update—my updated index to my work is now here.]
Now, I fear that my theory is of little interest to the climate establishment because they’re looking for headlines about THERMAGEDDON! CLIMATE EMERGENCY! My theory doesn’t have any of that, in fact, the opposite. My theory says that future warming is likely to be slow and small. So mostly, as with all good heretics, I’m shunned by the powers that be.
Let me close by saying that I have absolutely no academic qualifications at all. I took Physics 101 and Chemistry 101 in college. That’s it.
Since then, however, I have followed my education by teaching myself a host of subjects. For example, I taught myself and have made money writing programs in the following computer languages—Basic, VBA, Mathematica (2 of 3), Hypertalk, Vectorscript, Pascal, C/C++, and R. I taught myself refrigeration so I could take a job constructing and installing a blast freezer on a boat … in Fiji. As that post discusses, that was instrumental in understanding how thunderstorms operate in exactly the same manner as your household refrigerator.
And to return to the current discussion, I’ve spent thousands and thousands of hours researching and writing and learning about climate … all with zero certificates on my wall.
So please, don’t bother telling me that I’m an uneducated jerk or an ignorant fool. First, I already know that, and if I forget, my gorgeous ex-fiancee will gladly remind me … and second, that’s not the question. The question is absolutely not are my educational bona fides up to your high standards? That’s meaningless.
Nor is the question is Watts Up With That believable or not? I say this because where something gets published is never the question. There are folks out there that truly seem to think that if E=MC^2 is written on the bathroom wall it’s not true because of where it was published.
The question, the only valid question in science, is are the claims true? Does my theory stand up to close inspection? Are my ideas backed, not by climate models, but by actual real-world observations? Can you find flaws in the logic, the data, the math, or any other part of what I’ve written?
I have great confidence in what I’ve written about my theory, for a simple reason. Watts Up With That is the premier spot on the web for public peer-review of scientific theories and ideas about climate. This doesn’t mean that it only publishes things known to be valid and true. Instead, it is a place to find out if what is published actually is valid and true. There are a lot of wicked-smart folks reading what I write, and plenty of them would love to find errors in my work.
So when those smart folks can’t find errors in what I’ve written, I know that I have a theory that at least stands a chance of becoming a mainstream view.
My best wishes to all,
w.
Post Scriptum: As is my custom, I politely ask that when you comment, you quote the exact words that you are referring to, so we can all be totally clear about both what and who you are discussing.
Ah, Gavin… http://web.archive.org/web/20090208100837/http://sciencepolicy.colorado.edu/prometheus/alls-fair-in-love-war-and-science-4929
Willis, I think there is one (more) thing that should be considered when wondering why the climate is so stable.
We all understand that everything radiates if it’s above absolute zero – 0 Kelvins.
And everything radiates at a given RATE for a given temperature of the substance.
However, if that substance is warmed, it will radiate at the 4th POWER of the change in absolute temperature.
Stefan-Boltzmann Law
The thermal energy radiated by a blackbody radiator per second per unit area is proportional to the fourth power of the absolute temperature and is given by formula linked below:
http://hyperphysics.phy-astr.gsu.edu/hbase/thermo/stefan.html
Think about that…the 4th POWER is the feedback to any temperature change. That is about the fastest, most powerful feedback thermostat in existence. No WONDER the temperature is so stable – if it tries to change, it is INSTANTLY cancelled, by the increasing RATE of radiation. Sorry, CO2, you have nothing compared to that…
The basic problem with the theory is that they assume a linear relationship between W/m^2 and temperature. While it’s true that the work required to raise the temperature of matter is proportional to the temperature change, the work required to maintain a temperature is proportional to T^4.
In the steady state, all that matters is the work proportional to T^4 since the temperature has already been changed.
The needed to claim some kind of of linearity in order to apply Bode’s feedback analysis, so they invented approximate linearity around the mean, which while true for a small range around some temperature, it still doesn’t satisfy Bode’s requirement for strict linearity across all possible values of inputs (W/m^2) and outputs (temperature). Furthermore, it would need to be tangent to a T^4 relationship, rather than a slope passing through zero.
The data could not be any more clear that T^4 rules (the green line) or that the IPCC’s sensitivity (the blue line) passes through zero, rather than being tangent to the green line as it should be.
Excellent analysis sir, much appreciated.
MattS,
Notice that the green line is a gray body whose emissivity is 0.62 resulting in a mostly linear relationship between the surface emissions and the planet missions across the entire range of monthly average temperatures found on the planet. Even the seasonal variability per slice of latitude are points along this constant emissivity curve.
In the sensitivity plot, the temperatures are as reported in the ISCCP data, but the emissions at TOA are calculated. It was based on cloud properties and temperatures, surface temperatures and a multi-layer atmospheric model driven by GHG concentrations and HITRAN line data. As a result, the calculation is highly dependent on the amount of clouds. which when plotted against the surface temperature shows a highly non-linear, non monotonic and hemisphere specific relationship.
http://www.palisad.com/co2/sens/st_ca.png
Relative to the surface temperature, clear skies have a low emissivity while cloudy skies are higher. Since the average emissivity is highly dependent on the average amount of clouds, the data brings up an interesting question.
Is there a really bizarre relationship between clouds and the surface temperature that coincidentally results in a constant emissivity from pole to pole, or is a constant emissivity the goal and the clouds adapt as required?
If it’s the latter, then is there a reason that the constant emissivity is equal to the reciprocal of the golden mean, or is this just a coincidence?
How interesting and bizarre! Is there a difference in low clouds versus high clouds? I could imagine that at colder temperatures around the freezing point at ground level that maybe higher clouds are predominantly formed, where at higher temperatures we get more lower cloud formation?
StephenF,
“Is there a difference in low clouds versus high clouds?”
Perhaps, but the cloud metric in the plot is the fraction of the surface covered by clouds which is independent of the altitude of the cloud deck.
There’s another interesting metric where the ratio of cloud area to cloud thickness seems to change in a way that enables the cloud area to decrease even as atmospheric water vapor increases producing larger clouds that cover less surface area.
co2isnotevil,
I agree. Thank you for this analysis.
‘The basic problem with the theory is that they assume a linear relationship between W/m^2 and temperature.’
Worse than that, they also assume that all wavelengths of radiation increase temperature. This is not true. Only radiation from a warmer object will increase the temperature of a cooler object.
How does the warmer object know to ‘ignore’ the radiation from the cooler object and not increase its temperature? I have never seen an explanation of this on WUWT.
Even though it is not explained, it is still true. As far as temperature is concerned, you can ignore any additional radiation if it is emitted by a colder object. It will not cause a rise in temperature.
Bernard Lodge January 19, 2020 at 11:09 am
I’m sorry, but none of that is true. See my post ” Can A Cold Object Warm A Hot Object” for discussion.
Here’s an example. Suppose there are two widely separated stars, one at say 6,000°C and one at 4,000°C. Now put them next to each other. What happens to the temperature of the hotter star?
Well, when they were separated the hot star got nothing from its surroundings. When they are close, it’s getting energy from the cool star. So its temperature goes up.
Note that the cool star also warms up, and that the NET flow always goes from warm to cold.
w.
The hot star gets energy from the cooler star so the hot star cools more slowly, but does not heat up.
When the hot star was in isolation it was not cooling off, it was in a state of equilibrium between energy from the core and energy radiated out into space.
Now it has an additional large input of energy, and just as much coming from the core.
Why would it be cooling?
Willis Eschenbach January 19, 2020 at 11:47 am
Willis,
Well I’m sorry but it is true. Actually do the experiment and you will see for yourself. Place an object at a lower temperature next to an object at a higher temperature and watch what happens to the temperature of the warmer object … it does not go up!
Also, try this thought experiment. We all know an ice cube does emit radiation, even though it is cold. How many ice cubes do you have to surround a pan of water with to make the water boil? You know the answer is that it will never boil. In fact, the temperature of the water will not increase at all.
Now revisit your example of the 4000 degree star and the 6000 degree star. How many 4000 degree stars do you have to surround the 6000 degree star with to raise its temperature to 10000 degrees? The answer is the same. You could surround it with a hundred 4000 degree stars and its temperature would still not increase at all. Do the experiment.
Do not use the coat fallacy. Where putting on a cold coat causes you to warm up. That is because you have an internal heat source. If you wrap a steel ball at 100 degrees in a coat, its temperature will not go up. Do the experiment.
The bottom line is that a cold object absolutely cannot increase the temperature of a warmer object. Put another way, radiation sometimes increases temperature and sometimes it doesn’t.
Nicholas, the star is cooling and therefore not in equilibrium. Other cooler objects near it will slow the rate of energy loss, but only hotter objects have the potential of raising its colour temperature.
Bernard,
How does cold space at near absolute zero heat the Earth?
You’re conflating the heat transfer of matter in contact with other matter with matter heated by absorbing photons. Every photon absorbed by matter adds energy to it increasing it’s tempearture, independent of the temperature of its originating radiator. The GHG effect is radiant as photons returning from GHG molecules (and clouds) that warms the surface.
It’s not the case of a cold object heating a warmer one, but is more like a cold mirror that reflects energy back to the surface.
BTW, it’s requires well over 1000 W/m^2 to boil water. No matter how much ice area is emitting radiation, the energy density will never exceed about 315 W/m^2.
co2isnotevil January 20, 2020 at 8:47 am
Sorry for delay responding .. I’ve been travelling. Hope you are still monitoring the thread.
You said:
‘Every photon absorbed by matter adds energy to it increasing it’s temperature, independent of the temperature of its originating radiator’
This is not true which can be easily proven by experiment. If you place a metal ball at 1000 degrees on a table and then place a second metal ball, also at 1000 degrees, close to it, the temperature of the first ball will not increase … despite the arrival of a large new source of radiated photons. You could surround the first ball by 10 new balls, each at 1000 degrees and the temperature of the first ball will still not increase. The only way to increase the temperature of the first ball is to introduce a second ball that has a higher temperature.
This simple experiment proves your statement to be incorrect. To increase the temperature of one body, the photons must originate from a different body that has a higher temperature. This is not a theory – it is experimental observation. Just do some experiments with objects at different temperatures and you will quickly confirm it.
This of course implies lots of interesting conclusions. The key one is that electromagnetic emissions are not all the same … they have different energy levels. Each energy level of radiation can only heat up an object to a certain temperature and not beyond that temperature … no matter how much of that radiation is present. If nobody else has claimed this yet as a scientific discovery, I hereby claim it to be ‘Lodge’s Law’ 🙂
Bernard,
You’re missing the point and your example isn’t relevant since the 1000K metal ball is not in equilibrium and by definition, changes to Earth’s temperature are relative to some steady state. Yes, the metal ball will be radiating and cooling, but if it’s starting from a steady state, what it’s radiating must be the same as what it’s absorbing, thus each additional W/m^2 of photons arriving will increase the stored energy, increasing the temperature, until 1 W/m^2 more is being emitted. The temperature of what’s radiating that 1 W/m^2 of additional input is irrelevant. In your case, the second ball can’t contribute anything to the first one, as it’s incident and emitted W/m^2 must also be in balance to start with. Two balls in equilibrium at 1000K is the same as one bigger ball in equilibrium at 1000K. Why would one further heat the other under any conditions?
Consider the solar input to the planet of 239 W/m^2. The equivalent temperature is only 255K, yet this is capable of increasing the surface temperature to about 288K. According to your hypothesis, this shouldn’t be possible.
The EQUIVALENT temperature of the Sun at the distance of the Earth is not the same temperature as the Sun’s surface because W/m^2 decreases as r^2, thus the equivalent temperature goes as 1/r^2. Note that even the reflected sunlight from the Moon has a finite effect on the surface temperature!
You seem to be hung up on the concept of a linear temperature without consideration for starting from a steady state. I understand why, as the IPCC incorrectly frames the science this way when the physical reality should frame the science around conserving W/m^2, where the EQUIVALENT temperature is calculated at the end of the calculations based on the SB Law. The bottom line is that all Joules are the same and the temperature of their origin doesn’t matter.
co2isnotevil January 22, 2020 at 10:01 am
Thanks for the reply.
You said:
“You’re missing the point and your example isn’t relevant since the 1000K metal ball is not in equilibrium”
I did not say it was in equilibrium. Equilibrium is a red herring. My experiment is taken from the real world where nothing is in equilibrium.
You said:
“by definition, changes to Earth’s temperature are relative to some steady state”
That may be your definition but it is not mine. In the real world, changes in temperature are relative to what they were a moment ago. When you change an input, what happens to temperature the next moment … does it go up or does it go down? A simple experimental observation … not a theory.
You said:
“You seem to be hung up on the concept of a linear temperature without consideration for starting from a steady state.”
I am not hung up on anything, I am simply doing an experiment and observing the results. In the real world, there is no steady state, there is just the current temperature of an object.
You said:
“The bottom line is that all Joules are the same and the temperature of their origin doesn’t matter.”
All Joules are the same is like saying all inches are the same. Twelve inches of pipe is not the same as twelve inches of string. Forget Joules … that is a unit of measure … I am saying that all photons are not the same … though they can all be measured using Joules. Adding twelve inches of pipe to twelve inches of string does not give you twenty-four inches of either pipe or string.
My bottom line is that you should do the actual experiment and observe the results. If you place an object at 500 degrees next to an object at 1000 degrees, the temperature of the warmer object does not go up. BUT, if you place an object at 1000 degrees next to an object at 500 degrees, the temperature of the 500 degree object does go up. This is a real experiment. How do you explain those results?
Not only that, if you place a hundred objects at 500 degrees next to an object at 1000 degrees, the temperature of the 1000 degree object still does not go up … not even by a tiny amount, despite the massive increase in Joules! That is because the photons emitted by the 500 degree objects are only capable of raising the temperature of another object to a maximum of 500 degrees. It does not matter how many of these photons are present.
When you ponder these real experimental results, it leads you to the inescapable conclusion that a cooler object can never raise the temperature of a warmer object … ever!
My bottom line (Lodge’s Law) is that, in the real world, sometimes radiated photons increase temperature and sometimes they don’t – it depends on the temperatures of both the emitting and absorbing objects! Please do the experiment yourself to confirm these results.
By that logic, water heaters are incapable of heating water.
No WONDER the temperature is so stable – if it tries to change, it is INSTANTLY cancelled, by the increasing RATE of radiation. Sorry, CO2, you have nothing compared to that…
But CO2 re-absorbs the the increased RATE of radiation . The S-B Law is key to AGW. As CO2 accumulates in the upper atmosphere where it is DRIER & COLDER the mean altitude at which energy is emitted to space increases. This means that the energy is emitted from a COLDER layer.
As you correctly point out E = sigma x T^4 so outgoing rate of emission will be reduced and we will have
Incoming Solar Energy greater than Outgoing LW energy = Warming
The debate isn’t about the relevance of CO2 (it is relevant) it’s about the magnitude of feedbacks. Spencer & Lindzen, for example, explicitly argue feedbacks are negligible Others such as Lewis & Curry also imply feedbacks are small from study conclusions.
I’m less sure now. I think natural factors (ocean,solar) have dampened warming since ~2000 but warming appears to have resumed quite noticeably in recent years.
John
Co2 is well mixed so should have a worldwide and consistent effect on temperatures. It doesn’t, both the UK and many parts of the US amongst other places have been cooling since the start of the century .
This nuance is lost in ‘averaging’ which disguises those places cooling and those warming and those places not doing much at all.
Tonyb
Internal variability hasn’t gone away. Some regions will still warm faster – or slower – than others. In fact we would have expected a dip in global temperatures post-2000 but all we got was a ‘pause’ of sorts.
John, can you show me one paper that predicted “the pause”?
both the UK …… have been cooling since the start of the century
Could you be more specific about this “cooling since the start of the century”. Is this a statistically significant cooling? Which dataset shows this cooling?
The earth is warming. It has been for several decades. Warming won’t be uniform across all parts of the world but that’s expected because of regional variability.
I’m not sure CO2 is well-mixed. NASA launched OCO-2 in 2014 to scan the world for CO2 concentrations. Rather than showing a well-mixed more or less even distribution it shows much the same big variations as other climate variables in local and the long term. CO2 distribution looks much like the temperature distributions, wind speed distribution, radiation, etc.
Well-mixed is not a characteristic of the atmosphere, the ground, or the oceans. That supports Willis’ theory that many climate processes respond rapidly to changes and tend to keep the earth within a fairly narrow temperature range. All of the ice core data and most of the other paleo datasets also show that even across glaciations the temperatures have stayed within a range of about 10°C.
Philo January 19, 2020 at 5:48 pm
Here’s sample data from OCO:
While that looks poorly mixed, it’s an artifact of the graphic. The range goes from 387 to 402.5. This a total range of about ±2% … and of course, the stadard deviation is much less than that, likely on the order of ±0.5%.
And this in climate terms is indeed well mixed compared to the other main greenhouse gas, water vapor.
Best regards,
w.
… quite noticeably in recent years….
In western WI we sure could have used your noticeable warming these past 3 years. I am hoping.
Noticeably where? Noticeably how?
UAH seems to be detecting a positive trend.
john finn,
“But CO2 re-absorbs the the increased RATE of radiation . ”
What happens to the re-absorbed radiation? Does it, in turn, get re-radiated as well?
The increase isn’t cancelled, it’s reduced.
It is incorrect to apply the Stefan-Boltzman Law to a single gas species, such as CO2, that radiates in a comparatively few, distinct spectral bands. Such a gas cannot be approximated as a blackbody or grey body radiator with an “emissivity term” and T^4 dependence.
Also, although CO2 can distribute absorbed radiation energy via collisions with other, less energetic gas molecules, including other CO2 molecules (a process known as “thermalization”) it only absorbs radiation in a small portion of the continuous LWIR band at which Earth (as a true grey body) radiates over surface temperatures in the range of 200-350 K (~4-70 micon wavelength range).
Lack of awareness of this two fact leads many to misunderstanding (and overestimating) the role that CO2 plays in affecting Earth’s radiation balance, and thus its “average” temperature. I believe this applies to misunderstanding the basics of ECS, as well.
S/B “Lack of awareness of these two facts leads many . . .”
i keep telling climate warriors on social media an unenclosed gas cannot fit the definition of “body” or “system” because where would the system boundaries be, and how does this “body” absorb any and all light frequencies and why isn’t the body temperature homogeneous. when you look at emissivity tables you can find metals, rocks, wood, snow, ice but there are no gases. maybe free floating gases at room temperature don’t have the intensity to make any difference. like does anyone worry about the cold photons leftover from the big bang?
What!? Gavin Schmidt is not a Climate Scientists? Well according to every alarmists I have ever crossed swords with that, by default, renders him unqualified to have an opinion on the topic of AGW let alone to speak out and write about it. Holy Cwap! How come the General Alarmist community doesn’t know about this?
Bill, as you point out, the claim that nobody but a “climate scientist” should speak about the climate is hilarious. NOBODY is a climate scientist because the field is far too broad. It encompasses a whole host of scientific disciplines: physics, chemistry, oceanography, computer science, statistics, lithography, atmospheric physics, biology, the list goes on and on. Nobody can be an expert in all of those.
Regards,
w.
My thoughts entirely! I had the displeasure of listening to Schmidt on the BBC’s latest scare/propagandist climate emergency airing. He speaks so well – more in the Little Red Riding Hood kind of mode – to scare BBC listeners that the end is nigh. Oh dear.
Beyond that, they have set themselves up as a gatekeeper regarding who is qualified to call themselves a “climate scientist”. If you don’t agree with them, then by definition you aren’t qualified.
Pretty much by definition if you want to be considered an “expert” you need to keep in line with the consensus. Once you have an original thought that goes against the consensus you cease being an expert and are now considered a “quack”. This is the status quo of all science… it amazes me that things ever move forward.
Max Planck
Thank you, Mark. In all my discussions with alarmists – who always ask, ‘are you a climate scientist?’ – I ask them to define what a climate scientist is. I also ask them to name but three. They generally fail. But, if they name Mann, or Schmidt et al, I then go on to ask them, what their qualifications are (of the named). I could make a fortune on betting that nearly all will fail to include statisticians.
My mum does lithography, does that make her a qualified climatologist !
“1991: Eruption of Pinatubo will lead to ~2-3 yrs of cooling”
yes, Lacis et al 1992, from Gav’s own GISS team made very good , physics based calculations based on observations of El Chichon 1982. So , why did they drop physics based modelling in Hansen et al 2005 in favour of tweaking fudge factors and increasing volcanic forcing by almost 50%, to get the models to do what they wanted.
Having modelled volcanic effects and made a reasonably successful prediction you’d think they’d keep it , not throw it out.
Maybe he just forgot to mention that.
self correction:
They change AOD scaling from 30 W ( Lacis ) to 22W ( Hansen ) , thus reducing the forcing and by inference increasing the sensitivity of climate to radiative forcing.
@Willis – you left out the psychologists, sociologists, and economists from that list of “experts.” Not to mention the politicians, actors, and “journalists” who, of course, know far more than any of the plebeian masses.
Also 16 year old Swedish girls.
And let’s not forget those academics who inhabit university departments of “climate communication”. Otherwise known as “schools of how to try and scare people”.
Would this not discount most of what the IPCC base their conclusions on as most of the experts who contribute to their reports are experts in one discipline only?
Could you comment on the missing ‘hot spot’, both the hypothesis/theory of why it should occur with CAGW and the possible reasons for it not being there? Also, how has this not killed the CAGW monster as it is a major failed prediction?
Willis
Firstly thank you for your excellent article.
I consider myself a Climate Engineer.
I have over thirty years experience in designing and building infrastructure.
Although I currently project manage road construction, I many years experience in flood mitigation. I need to understand rainfall. – I am a Climate Engineer.
Additionally, I have great respect for Climate Pilots, Climate Sailors, and Climate Farmers – they all need to have an understanding of climate.
You forgot geography, Willis.
I understand that universities that offer degrees in climate science generally put the discipline in the geography department!
I could add another “I don’t know why” comment but the reason they give is that it isn’t a hard science like chemistry, physics, or geology!
I don’t mean to denigrate the effort but can we take it that serious if it’s just another branch of geography? Maybe the alarmists want it that way so they can’t be tied down, or funding is easier to get with a nebulous discipline.
Certainly Gavin has shown significant loose ends in his approach and the government seldom asks for verification–they’re rolling in dough! A circus loaded with lots of clowns is entertaining for a reason! Point out their folly and ringmaster Mann raises his whip!
Please don’t leave geologists off the list!
I suspect there’s more scepticism of CAGW by geologists than any other sort of scientist, probably because we’re good at analysing complex natural systems, we have intuitive understandings of time and scale, and we’ve seen it (i.e. climate change) all before multiple times. A lot of us have also tried earth modelling of some sort or other, with levels of skill ranging from zero to pretty good.
Willis, I always enjoy reading your articles and don’t worry about not having letters before or after your name. In the end, they don’t matter. What does matter is the truth, and that always comes out eventually.
In reply to:
There is an alternative physical explanation for the stratosphere cooling, to atmospheric CO2 changes.
“a) Increasing CO2 will cause the stratosphere to cool. This is obviously evidence in support of theory 1. Here’s the record of stratospheric temperatures, from the Microwave Sounding Units on a succession of satellites.”
A reduction in cloud cover will also cause stratospheric cooling. There are peer reviewed papers that assert there is evidence of a major reduction in cloud cover post-1994 in the climate record.
Less reflected sunlight will also cause the stratosphere to cool. Ozone absorbs the sunlight so if sunlight is reflected off of clouds the reflected sunlight has a second opportunity to heat the stratosphere.
Interesting, William. I hadn’t considered those.
One other curiosity. The RSS satellite temperatures show no stratospheric cooling since about five years after the Pinatubo eruption … go figure.
w.
A perhaps off the wall thought came to mind about stratospheric cooling: There aren’t any SR-71’s flying around anymore to inject exhaust products in the stratosphere. One good outcome of a cold stratosphere is trapping water below where UV would strip hydrogen off water molecules and allowing them to escape to space.
I do think you are on the right track in regards to the thermo-regulatory effect of tropical thunderstorms, especially when considering that the vapor pressure of water doubles about every 10C rise.
Very many commercial flights go above the mid-latitude lower stratospheric boundary every day.
The number of flights in the stratosphere, was miniscule in any event.
Whatever happened to the hotspot in the tropical troposphere?
Nicholas McGinley:
The hot spot was caused by a stalled high pressure weather system, which eventually moved on.
And the loss of clouds warms the Ocean.
indeed William but there is more to it than just cloud cover, it is why cloud cover may change. One reason is a change in the concentration of cloud condensation nuclei, another cause of change is a change in ozone, ozone dropped by between 5 and 8% after mt. P.
What Gav et al fail to tell everyone is that volcanoes also produce stratospheric cooling. This can be clearly seen as the step change AFTER the initial warming ( eruptions warm the stratosphere as they cool the lower climate ). Then the opposite accurs as the system settles to the “new normal”.
https://climategrog.wordpress.com/uha_tls/
Climate con-men like the GISS team prefer to draw a straight line though those step changes and pretend it due to CO2 and thus “proof” of their hypothesis.
As the lower stratosphere clearly cooled, once the initial aerosols had dispersed, we can conclude that it became less opaque to solar radiation than before . That means more energy gets through to the lower climate. Volcanoes cause global warming, they don’t mention that.
This is the paper I was thinking about. There is another paper that shows planetary temperature changes correlate with solar wind bursts and the solar wind bursts were caused by coronal holes.
As Palle, notes the changes in cloud cover are regional not global and are consistent with the regions affected by the mechanism electroscavenging.
Solar wind bursts create a space charge difference in the ionosphere which causes current flow for a few days which in turn affects planetary temperature.
https://www.semanticscholar.org/paper/The-possible-connection-between-ionization-in-the-Pall%C3%A9a-Butlerb/4ad159e3523889be89dce82297271472d4c024bc
A simple linear fit to the yearly low cloud data (Fig. 2) has a slope – 0.065%/yr.
The possible connection between ionization in the atmosphere by cosmic rays and low level clouds
Nonetheless they appear to be marginally field significant over broad latitude and longitude bands with a peak positive correlation at 50 degrees North and South and a tendency to negative correlation at lower latitudes. The correlation is strongest over the North and South Atlantic. Several of these features are consistent with the predictions of the electroscavenging process.
However, the symmetry in the significance distribution over the northern and southern hemispheres (see next section) points to a physical mechanism behind the correlation. The correlation distribution does become field significant if one looks only at the latitude bands 40–60_ in both hemispheres. Moreover if detrended low cloud data is used, the significances for all cells increase and the correlation becomes field significant (although marginally) over the whole earth.
The second process, considered by Tinsley and Yu (2003), namely electroscavenging, depends on the action of the global electrical circuit (see review by Rycroft et al. (2000)). The transport of charge by rapidly rising convective currents in the tropics and over continental land masses leads to a _200 kV positive charge of the ionosphere compared to Earth.
This large voltage difference, in turn, necessitates a return current which must pass through the regions of the atmosphere where clouds are formed. As cosmic rays are the principal agent of ionization in the atmosphere above 1 km altitude, any modulation of the GCR flux due to solar activity is likely to affect the transport of charge to complete the global electrical circuit. Tinsley and Yu (2003) discuss how the build up of electrostatic charge at the tops and bottoms of clouds could affect the scavenging of ice forming nuclei (IFN) and cloud condensation nuclei (CCN) by droplets, and how this can lead to greater rates of precipitation and a reduction in cloud cover. They find that the electroscavenging process is likely to be more important over oceanic
rather than continental regions and that it leads to a positive correlation between clouds and cosmic rays at higher latitudes and a negative correlation at low latitudes.
Thus the electroscavenging process can explain several of the most striking features of Fig. 5, namely: (1) the peak in significant positive correlations at latitudes around 50 degrees North and South (Fig. 5a); (2) the tendency for a less significant but nonetheless evident trend to negative correlation coefficients at low latitudes (Fig. 5a); and (3) the location of the peak in
correlation over one of the principal oceans, namely over the North and South Atlantic (Fig. 5c).
thanks for the link
My grasp of climate ‘science’ is pretty poor, though by reason and instinct I veer towards scepticism. But as a writer I do need to query ‘falsifiable’. Is this a Freudian slip by Dr. Schmidt, or does the word have a totally different meaning in science-speak? Falsifiable surely means to make a falsehood of something.
https://en.wikipedia.org/wiki/Falsifiability
“An hypothesis is falsifiable if some observation might show it to be false. For example, in order to verify the claim “All swans are white” one would have to observe every swan; but the observation of a single black swan would be sufficient to falsify the claim. “All swans are white” is falsifiable because the observation “Here is a black swan” shows it to be false.
Falsifiability was introduced by the philosopher of science Karl Popper in his book The Logic of Scientific Discovery, as an answer to both the Problem of Induction and the Demarcation Problem. He saw falsifiability as the cornerstone of critical rationalism, his theory of science.[1]
Falsifiability is a key notion in the separation of science from non-science, and as such has featured prominently in many scientific controversies, even being used as legal precedent. ”
end except
I hope that helps.
In this context, “Falsifiable” means “capable of being falsified” in the sense that there are experiments one could do that, if the results turn out in a particular way, would prove the theory is false. Sigmund Freud’s theory of the mind was considered by some to be unscientific because, for any unpredicted behavior, Freud could later come up with a reason (the id, ego or superego) why the behavior was actually consistent with the theory. Schmidt claims that his theory does not have that characteristic – that, if false, it can be shown to be false.
Tish,
A theory or hypothesis is falsifiable if it allows us to make predictions. If the predictions agree with subsequent observations, it is evidence that the theory is true. If they do not come to pass, then the failure is evidence that the theory is false. The possibility of a failed prediction makes the theory falsifiable—it could be shown to be false. It is never possible to say that the theory is proven (or “settled science”), but only that there is strong evidence that it is close to the correct understanding if it has been tested and has not been falsified.
Falsifiability is a necessary attribute of a useful scientific theory. A theory that can be twisted into explaining any outcome is not a scientific theory, it is more of a religion. If your theory is that the sun god controls the weather, whatever the weather turns out to be, the theory says was caused by the sun god’s will. No outcome can falsify that theory. Droughts and floods are signs of the sun god’s wrath. Pleasant weather indicates that the sun god is pleased with us.
Alarmists convolute their theories to cover every outcome. “Record cold is just what would be expected from climate change“. Their theories are not falsifiable.
I bet that took y’all longer to type the falsification than to do it.
Gavin? He’s so 1990s.
As far as I can tell, no satellites have produced spectra for LWIR at wavelengths greater than 15 um. There is a European satellite scheduled for launch around 2025. link
As far as I can tell, all the TOA upwelling spectra I have seen are the product of calculation, not measurement.
The term ‘iterative’ pulled me in because my colleague Philip Mulholland and I used it here:
https://wattsupwiththat.com/2019/07/18/using-an-iterative-adiabatic-model-to-study-the-climate-of-titan/
Willis’s objection to iterative models is that one needs to identify how such models can be constrained from spiralling out of control. All current iterative climate models fail to address that issue and so can only work by hindcasting the past.
Our model deals with that issue by pointing out that radiative imbalances are automatically neutralised by changes in the speed of convective overturning (as per Willis’s own thermostat hypothesis) which adjusts the balance between radiation and conduction at the surface beneath an atmosphere.
The result is that our model becomes predictive as to the tropopause height required to achieve stability for any planet or moon with an atmosphere (hydrostatic equilibrium) and that prediction of tropopause height works for all the planets or moons with atmospheres that we have been able to measure.
Our model works for a radiatively transparent atmosphere so it follows that if our model is accepted to be accurate then there is no longer any place for radiative gases as an influence on surface temperatures.
Stephen
Back when I got my first personal computer — an Atari 800 — I spent a lot of time using the approach to model things with the System Dynamics approach of iteration. I remember trying to model the terminal velocity of a falling object such as a bullet. It worked as expected up until it got close to what I thought the terminal velocity should be (~120-150 MPH), and then suddenly started oscillating wildly with unreasonable velocity values. At first I thought that I was seeing the results of turbulence. I then realized that what I was seeing was the result of round-off error as the denominator approached zero, produced very large numbers, and then worked its way back down. Iteration has unique pitfalls.
Is that relevant to our model though?
Our model incorporates the effects of decompression / compression and not just the height off the ground. Decompression and compression involve far higher energy quantities than simple raising and lowering a piece of solid matter.
Clyde is describing a computational problem and you are describing a physics problem.
Digital signal processors have a solution to the inaccuracy produced by iteration/quantization. They can have a data bus 128 bits wide so they can accurately calculate an answer that is 16 bits wide.
Think about it. You bring in 12 bit data from an a/d, you perform successive iterations and you end up with 128 bits. Then you throw away your 112 least significant bits and you have a useful 16 bit result. After that, you can probably throw away another 4 least significant bits because you only started with 12 bits in the first place.
Clyde, this is a well known property of a brute-force attack on iterative systems, and modern differential equation solvers handle it well. I am more interested to know if Stephen’s method could be applied to Earth.
CG,
We have applied it to Earth and it works:
https://wattsupwiththat.com/2019/06/27/return-to-earth/
“I am more interested to know if Stephen’s method could be applied to Earth.”
George,
We report on the application of our model to the Earth on WUWT here:
https://wattsupwiththat.com/2019/06/27/return-to-earth/
Peter Gibbons : [Explaining the plan] Alright so when the sub routine compounds the interest is uses all these extra decimal places that just get rounded off. So we simplified the whole thing, we rounded them all down, drop the remainder into an account we opened.
Joanna : [Confused] So you’re stealing?
Peter Gibbons : Ah no, you don’t understand. It’s very complicated. It’s uh it’s aggregate, so I’m talking about fractions of a penny here. And over time they add up to a lot.
Office Space (the movie, 1999)
> “If nothing else, the discrete digital nature of each calculation assures that there with be slight roundoff errors. If these are left uncorrected they can easily accumulate and bring the model down.”
“We lose a little on each transaction, but make up for it in volume.”
~ someone in Dilbert maybe?
> “He just pushed it back into balance with each timestep, turned his back, and kept rolling.”
This reminds me of an incredible scene in Arnold Federbush’s 1978 novel Ice! which is a sudden-onset ice age scenario, unsung inspiration for the Day After Tomorrow movie. It makes up in drama and novelty for the little losses of science rigor. In a room is somehow built a real ‘model’ apparatus of Earth’s climate, with rocks and water and dirt and air and fans and chillers and heat lamps and thermo-meters and what have you. And this model even passes some initial stress test, miraculously synchronizing to the day’s actual conditions like some Copernican clockwork orrery of climate. Then exhausted after this hard day’s work the protagonist falls asleep with the model running and wakes with a shiver to discover it has devolved into a crusty Ice Age. Then in fine disaster novel tradition real events begin to mirror the apparatus.
“My question was, why is the climate so stable?”
I would suggest because the sun is so massively stable, and that the other things you mentioned, for the most part, directly or indirectly, take their marching orders from it.
icisil January 18, 2020 at 10:51 am Edit
In fact, the weather is changing at all times at all points of the surface. There is no reason a priori to assume that these will all average out to within ±0.3°C over the 20th century, and every reason to assume they wouldn’t.
w.
Even with the 11 year solar cycle our sun is stable. One thing I’ve never seen discussed is Earth sits on the very inner edge of the habitable zone. With that in mind, any tiny increase in solar radiation could have a greater effect on climate than if Earth sat more in the middle or further back in the habitable zone. Are you aware of any discussion on the effect on climate from our position in the habitable zone?
From what I’ve read, Mars, Earth and Venus are all considered to be in the inhabitable zone.
…and yet only one of the three are inhabitable!
Mars the jury is still out, Curiosity found organic matter and the new Rover to do further testing wont be there until late this year or early next.
Venus we have no data either way as the planet has had limited probes land.
When Mars had a thicker atmosphere, it had liquid water. And that was back when the sun wasn’t as bright as it is today.
The habitable zone just means that water is liquid on the surface of planets at standard pressure.
On the real global climatic scales that matter, ie tens of thousands to hundreds of millions of years, Earth’s climate is not stable.
True but immaterial. The question still exists, why is it so stable on the centennial scale?
Also, even in the long run, in the last hundred million years, despite years of endless volcanoes, despite being hit by a giant meteorite, we haven’t spiraled into an ice-covered ball or died of heat-death. And after each such catastrophe, the climate has recovered to where it was before and gone on.
w.
It’s relatively stable on the centennial scale because the major movers of climate change operate on much longer time intervals.
Over short periods of tens, hundreds to thousands of years, our water world is largely homeostatic. Yet interglacials still show fairly regular climatic fluctuations even on multi-decadal and centennial scales. Within each several century-long secular trend, there are pro- and counter-trend cycles. Recognizing these facts falsifies the CACA hypothesis.
Variation of a few degrees in apparent global average T from the height of warm intervals, like the Holocene Climate Optimum, to the depths of cold spells, like the LIA, is indeed stable compared to the changes observed going into and coming out of glaciations, and between stadials and interstadials within them.
In order even to begin to try to tease out a man-made global signal, the existence and causes of such natural fluctuations need to be recognized and assessed.
So, IMO, hardly immaterial. Rather, essential.
In the early Cenozoic, climate recovered to where it was after the big impact to end the Mesozoic Era, but then it entered an Ice House in the Oligocene Epoch, in the grips of which we still are. The causes appear both astronomical and tectonic. Ice ages got worse in the Pleistocene, probably due to formation of the Isthmus of Panama.
For most of the Phanerozoic Eon, Earth has been a lot hotter than now. It was briefly as cold as today during the Ordovician-Silurian ice age, and for much longer during the Carboniferous-Permian ice age. But before the O-S, between it and the C-P and during the Mesozoic Era and first two epochs of the Cenozoic Era, Earth was usually hot, hot, hot, compared to now. Often ten degrees C balmier, and spiking even higher.
Willis your iris effect which is driven by the condensing GHG is the moderator of all.
The great wonder is that protein remains in tact in our temperature band.
I don’t think the sun IS stable,. About 4,6 billion years ago, its luminosity was only 70% of what it it now, and has been increasing in luminosity ever since,
I think Ou was correct, and it is water in its three phases, and high specific heat, that keeps the earth’s temperature stable,
https://journals.ametsoc.org/doi/pdf/10.1175/1520-0442%282001%29014%3C2976%3APBOTES%3E2.0.CO%3B2
The sun, while very stable in its radiation, is not a source of energy stability on earth, where it’s energy is impacting a sphere of chaotic fluids at rates that constantly vary in all possible dimensions.
Peak Medieval Warm Period heat happened before AD 1300, and the Little Ice Age Cool Period began before AD 1600.
Various start dates for the LIA have been suggested from AD 1300 (or even earlier) to 1550. Does the Wolf Minimum (1280 to 1350) belong to the late MWP or early LIA? Warmth returned in the second half of the 14th century, so it’s conventional to date the onset of the LIA from c. 1400, with decent into the inclement weather of the Spörer Minimum.
https://en.m.wikipedia.org/wiki/Spörer_Minimum#/media/File%3ACarbon14_with_activity_labels.svg
While the MWP thus suffered just two shallow solar mínima, the LIA was slammed with three brutal minima, the worst of which was the long, deep Maunder.
Mann of course tries to blame the LIA on volcanoes rather than the quiet sun.
Thanks, John. I discuss the volcanic theory in my post “Dronning Maud Meets The Little Ice Age“. TL;DR version? It’s not volcanoes.
w.
Glad you concur.
Here are the known VEI-6 and -7 eruptions during recognized warm and cool intervals of the past two millennia, with approximate dates:
Roman WP (AD 50-500): 3 VEI-6 and 1 VEI-7 (Vesuvius rated a 5).
Dark Ages CP (500-950): 4 VEI-6 and 1 VEI-7 (one 6 in AD 930).
Medieval WP (950-1400): 1 VEI-6 and 2 VEI-7.
Little Ice Age CP (1400-1850): 6 VEI-6 and 1 VEI-7.
Modern WP (1850-present): 4 VEI-6 and 0 VEI-7 to date.
Cool Periods do seem to have more big eruptions, but not enough to make a difference, and the period dates are to some degree fungible. The Modern WP has been active, but so far lacks a VEI-7, thank God.
The effects of even the biggest tropical (which cause more cooling) eruptions are fleeting.
“Mann of course tries to blame the LIA on volcanoes rather than the quiet sun.”
Funny that now the science is starting to catch up to the fact that a quiescent sun and volcanoes go hand in hand and not in ways Michael Mann thinks…..
“Does the Wolf Minimum (1280 to 1350) belong to the late MWP or early LIA? ”
Good question, from my findings in the ordering of solar cycles and centennial minima, I would say that the little ice age series of grand solar minima began with a longer centennial minimum from around 1215 AD, which agrees with Esper et al 2014, and with weather chronicles. The centennial solar minimum in the early 1100’s although short, was very deep and cold according to proxies and weather chronicles from Europe and the Near East. Sporer was in fact two separate centennial minima, a very long one from 1425 and a shorter one from 1550, the 1530’s were very warm and 1540 was hotter than 2003 in Europe.
Tropical volcanic eruptions normally slightly warm N Hemisphere winters, and typically occur just after extreme cold N Hemisphere winter periods, so if anything the LIA drove the eruptions.
Thanks!
If only we presently enjoyed real paleoclimatology, trying to understand the past, instead of squandering billions of GIGO models failing to predict the future.
On GIGO models instead of funding real science.
John Tilman:
Regarding the start date of the Little Ice Age, if 1350 is used, the VEI7 eruption of Mount Rinjani would fall into the MWP, as well as the string of 6 VEI5 eruptions of Tarawera 1310-1315, which caused the great famine of 1315-17, because of the colder weather.
This is ridiculous, they clearly belong in the LIA!
Tarawera’s SO2 aerosols settled out around 1320, and warming resumed, with the next large eruption not occurring until 40 years later, El Chichon VEI5 in 1360. And Oreafajokull VEI5 in 1362.
With this adjustment, the MWP had only 6 VEI5 eruptions and 1 VEI7 eruption over a period of ~300 years, as opposed to at least 34 VEI5, 8 VEI6, and 2 VEI7 eruptions during the LIA. There is a huge difference in large volcanic eruptions between the 2 eras!
I have pointed this out to you earlier, but you persist in using 1350 as the starting date of the LIA.
And, as I also pointed our earlier, it is impossible to determine changes in solar output by proxy measurements because of interfering SO2 aerosols, so the LIA cooling cannot be attributed to sunspot activity.
Just volcanoes. For once, Mann is correct.
Great presentation Willis. About the only complaint I have about all this is temperatures are always shown as an anomaly, which implies there is one true baseline. Well, there is no true baseline that we can calculate. How do we know the current state of the Earth isn’t too low and all we are doing is catching up?
But when you fix the baseline at some arbitrary point in the past and call it normal in a trending up state, you can sure put out graphs that have very intense reds and even Barney colors to terrorize your readers.
And then the Steven Mosher’s of the world can take their “data” as they call it, grind it around in a few iteration loops, and spit out new numbers more in line with the terror campaign.
The complaint I have is that we’re presented with a single line as a “global temperature” (or anomaly, makes no difference). There is no such thing, it’s a mathematical abstract that has no physical meaning.
Willis
You stated the question, “… are my educational bona fides up to your high standards?” When a zealot demands one answer that question, it is a not-so-subtle “ad hominem attack on the author, and avoids dealing with the facts and logic of the author’s stated position. Whatever “bona fides” one presents, the zealot can (and will) raise the bar and object that it doesn’t meet their standards, again avoiding the legitimate response of attacking the argument rather than the author. I don’t know how many times I have seen self-righteous defenders of the orthodoxy respond that way to a comment directed to a Yahoo ‘news’ article. It was even more common back in the days when I responded to articles posted on The Conversation blog. One Australian woman complained that she couldn’t find my digital presence on the internet. The problem was that most of what I have had published was either company proprietary, or classified, and typically written before Al Gore invented the internet! 🙂
Incidentally, the right-hand sides of Figure 1 are reminiscent of the uncertainty envelope demonstrated by Pat Frank.
Thank you Willis, another of your very thoughtful posts. Sanity incarnate.
My analog analysis of any idea I am trying to develop an understanding of always starts with how to filter the overwhelming amount of information typically available. Your post uses one of my primary rules of engagement:
“We don’t know”. If this concept is not honestly conveyed in prodigious quantity, the source gets down marks.
Pat Franks excellent series of posts relating to model uncertainty go to the heart of this concept.
Another concept I adhere to, which you clearly share, if that the purpose, and measure, of learning about something is the ability to ask better questions.
The bulk of the information posted by the AGW adherents usually fails both of these miserably. The reason, trivial…they “believe” in what they are saying. The concepts of faith (religion) and science are not the same.
Your idea of emergent physical mechanisms which act to counter temperature changes is, I think, similar to my own take of how our bodies physically deal with ionizing radiation (nuclear engineering is one of my life side roads…). The current “settled science” with respect to how radiation affects us is embodied in the linear threshold theory (any amount is bad). A more nuanced, and actual data supported theory, is the concept of hormesis (a non linear response with perhaps, some positive elements at low levels). I suspect that there may be some interesting underlying behaviors going on that relate your emergent feedback idea with biological hormesis, and that both relate to the behavior of systems with chaotic tendencies, when subjected to any change .
The trouble with learning is that it just generates more questions!
And what fun that trouble is!
Best,
Ethan Brand
W,
If I weren’t 75, unscientific, and an inveterate word cuisinart, I would consider you my hero. That said, you are a reliable source for a scientific dilettante use.
Your longstanding efforts, intellectual girth, and palpable humility would make Lincoln proud.
Thanks for your hard work and passion, Willis.
Best,
The Energy Pragmatist and Word Merchant
Stephen Heins- My Mac lets me highlight a word, right click and take the Look Up option to get the definition of the word. It helps me significantly when people of your ilk post these multi-syllabic words that are half French and half Latin and only used by people like yourself and the late, great William F Buckley. 🙂
And Willis sneaks a few in now and then as well.
Thanks so very much for a very informative posting. I am always eager and happy to learn something new and to reinforce any previously acquired knowledge on this subject. This is definitely much better than an Open University…
Willis your efforts are legendary I cant believe you have put up with this S@ur momisugly@@ur momisugly for years. My prediction for 2020 Trump will get the congress and senate back with huge majorities and Will Happer or others will end this nonsense.
“The interesting part of our interaction was what convinced me that he was a lousy programmer. I asked him about his program, the GISS Global Climate Model. I was interested in how his model made sure that energy was conserved. I asked what happened at the end of each model timestep to verify that energy was neither created nor destroyed.”
Gavin is not a lousy programmer. The energy correction is what every program that is based on conservation of energy has to do. It conserves energy. That provision would have been in GISS GCMs since Hansen’s time. It is in every other GCM, and in every CFD program that has to run for any substantial length of time.
Now CFD is a major engineering tool. CFD was not written by lousy programmers.
CFD, of which GCMs are a branch, solves the progress of a flow subject to conservation of mass, energy and momentum. You work out what forces apply, use F=ma and at the end of a timestep, have a new state which should have achieved that conservation. The scheme is discretised; there will be some error. We knew that. But the error should not be in total energy (or mass) because that will be accumulated. Other errors mainly attenuate by diffusion. So to the equations which express the exchange of mass, energy and momentum between cells, you add an equation which says the global total must be unchanged.
CFD often does not have an explicit correction because of use of a conservation form. That builds the correction into the basic equations. More elegant, but same effect.
Nick, please learn to read before attacking at random. I didn’t say he was a lousy programmer for how he dealt with the energy imbalance. I specifically said that was OK.
I said he was a lousy programmer for not putting a Murphy Gauge on the amount of energy re-distributed, so he could see when and where it went off the rails.
w.
Willis,
“I said he was a lousy programmer for not putting a Murphy Gauge on the amount of energy re-distributed”
And my assertion is that he is not. He has dealt with a universal CFD issue in a conventional way. I have never seen anyone apply a “Murphy Gauge” in these circumstances.
The function of solving the equations iteratively is to get a set of numbers at the end of each step consistent with conservation laws. Here an equation requiring global conservation is added, a perfectly valid equation. The fixer process in effect gives it very high weight. But it is part of the system.
CFD programs (and GCMs) are monitored for signs of failure. These are well known – I described the general stability issues in a WUWT post. They are characterised by exponentially growing modes, which can be quickly spotted. In comparison with these, the very slow growth of total energy or mass discrepancy would be a poor diagnostic.
Nick Stokes January 18, 2020 at 1:07 pm
Look, Nick, I don’t care what you’ve seen or haven’t seen. THINK ABOUT IT. You have a chance to see whether your model is going seriously off the rails and being nudged back on every timestep. Why would you NOT want a Murphy Gauge on that? Why would you ignore such a critical indicator of error by simply munging the data back into balance each time, regardless of the size of the error???
w.
Anyone who uses a leading CFD package like OpenFOAM, must have heard of the Courant Number?
Just as an example see :
https://www.simscale.com/blog/2017/08/cfl-condition/
Lets say it’s a Murphy, or better, Ms Murphy’s Law, measure.
The Courant Number determines the timestep. So?
The amusing part is referring to your own wrong post … repeating an error doesn’t make it right.
Willis, you may personally know, or are at least familiar with Christopher Essex’s (Canadian Mathematician) work regarding Climate Computer Models, or you are probably quite familiar with his perspective on climate models from some other such mathematician, or from even your own expertise – not needing anyone else’s input because of your own broad knowledge. Having made the aforementioned “excuse me, in case you know this already”, I think that the below excellent 1 hour presentation by Mr. Essex, to some folks somewhere in England, is relevant to Computer Climate Modeling discussions. It starts very slow, and seems trivial at first, but hang with it for its excellent revelations on the enormous deficiencies of Computer Climate Modeling.
Hang with it, it is worth the 1 hour…
https://wattsupwiththat.com/2015/02/20/believing-in-six-impossible-things-before-breakfast-and-climate-models/
Gavin seems to be obsessed with the conservation of energy, correctly, but to an exclusion of other valid concerns. Here he defends models which neglect the temperature dependence of a latent heat of water evaporation, resulting in a 2.5% error in energy transfer by water evaporation from tropical seas. Who cares for a 2.5% error when we can use a pretty good approximation?
” The temperature dependence of L depends on the differences in specific heat in each phase (since energy must be conserved in a condense–> warm –> evaporate –> cool cycle), and the dependence is then
L(T) = L0 + (c_vap – c_cond) * T
What the appropriate form for L is depends on what the total energy function is in the atmosphere. If the specific heats of condensate and vapour is assumed to be zero (which is a pretty good assumption given the small ratio of water to air, and one often made in atmospheric models) then the appropriate L is constant (=L0). (Note that all models correctly track the latent heat of condensate).
The fix is not to simply put a temperature dependence on L (which of course would be trivial), but to rewrite the entire code with extra prognostic variables for vapour and condensate sensible heat. If you just ‘fixed’ L you would not conserve energy, and that would be a much worse error.”
https://judithcurry.com/2012/08/30/activate-your-science/#comment-234131
I think anyone who proposes using CFD solutions of the Navier Stokes equations for climate modeling is at best an idiot, and at worst a charlatan. There is no foreseeable computer that can ever handle the number of computations required to actually model the global climate to a meaningful scale, and do so in less than real time (a prerequisite for prediction). So what we have are low-fidelity, highly approximate (an understatement) codes posing as climate predictors.
But there’s another aspect of climate model errors that I’ve seen dismissed by people who should know better. Computers are machines, and like all machines they sometimes fail. In a thread on Dr. Roy Spencer’s (I think) blog, someone asked whether the same climate code on the same machine with the same initial conditions would always produce the same results. The responses were universally dismissive (and derisive), following the idea that a computer is a machine that always gives the same results if given the identical data and running the identical code.
Well, they don’t. Computer memory, especially modern memory with highly dense features, is subject to a large number of influences which can cause one or more bits in a word to flip. Error correcting codes hardwired into the computers may catch these – or they may not. Here is just one study (https://core.ac.uk/download/pdf/81577401.pdf) of bit errors in a large-scale computer, the type necessary to run climate models. It developed techniques to catch bit errors of virtually any type, and found that there were a number of “undetectable errors”, i.e. those that error correcting codes are not equipped to spot.
Everyone here is familiar with Lorenz and his finding that small changes in initial conditions for certain differential equations produce increasingly different results. Judith Curry had a post a while ago quoting a study which found that changes of one trillionth of a degree in initial conditions produced completely different results in runs of global climate models.
Well, in every numerical integration scheme, the results of each time step are the initial conditions for the next. Having even one case in which 3 non-adjacent bits in a word flip (a non-detectable error) changes the initial conditions for a subsequent time-step, and the trajectory of all subsequent time steps.
The “higher fidelity” the climate model, the more susceptible it is to this kind of error propagation. They may not happen “frequently”, but when terabytes of memory and teraflops worth of computation are performed for days on end, the odds are that a code sensitive to small changes in initial conditions will not produce the same results from run to run.
“I think anyone who proposes using CFD solutions of the Navier Stokes equations for climate modeling is at best an idiot…”
Every practical application of CFD works at the scale nominated, with finer effects that it does not resolve. I’m thinking especially of turbulence. You have to model the effects of all the fine scale eddies. But CFD works, despite turbulence.
GCMs are no different. They can’t resolve a whole lot of fine scale features. But they can still conserve mass, momentum and energy on the scale of their grids. GCMs used for weather forecasting do that with continually tested success.
And the turbulence treatment is one way of seeing why the issue of great sensitivity to initial conditions does not matter. The turbulence treatment is of constant random fluctuations. Totally irreproducible on a fine scale. You can’t usefully track particles. And yet, CFD works.
Nick,
See my post about Freeman Dyson at the end of this thread.
You know Dyson’s éminence as Einstein’s protégée.
Climate models are not reflective of the world in which we live.
The whole global warming issue has been grossly exaggerated.
That is all we need to know to avoid a catastrophic misallocation of public and private funds, now proposed to be in the trillions, and a perversion of science.
“GCMs used for weather forecasting do that with continually tested success.”
Which is why the forecasts change every couple of hours for the same time period. Wonderful.
Jeff,
“Which is why the forecasts change every couple of hours for the same time period. Wonderful.”
You pretty much nailed it. If the models don’t work over the short term then how can they possibly work over the long term. We are expected to believe that over the long term all the short term inconsistencies somehow average out so the long term outputs are correct.
My daddy called that buying a pig in a poke.
The issue here is the conflation of 2 types of CFD. Reynolds’ Averaged Navier-Stokes or RANS is a steady state formulation that “averages out” the unresolved turbulent eddies. There is at least some plausible hope these might be well posed, even though evidence is accumulating that this is not the case. The second type is eddy resolving simulations which typically use some form of LES to model the unresolved scales. These are not well understood and there is very little definitive research so far. People just run the code, adjust the many parameters until they get a plausible result. A perfect example of selection bias. Climate and weather models fall into this latter category. By careful attention to detail and tuning you can control the numerical errors on short time scales (a few days) if all you want to model is Rossby waves. On longer time scales, this becomes much more difficult if not impossible.
But the real problem is the almost complete lack of rigorous research into these questions. Instead, modelers use pseudo-mathematical sounding arguments that have no substance and are impossible to verify. This is one of the disappointing things about modern science. It’s vastly easier to just run and tune codes than to try to address fundamentals where you might not generate any “publishable” results.
As you say, Nick (about Schmidt’s modelling
HOW? Who determines energy saving, for goodness sake? It’s not an objective meme, IMO.
Conservation of energy, mass and momentum are basic, classic physical laws. All mechanics can be derived from them.
Yes but in the real universe none of those hold. It isn’t even a debate anymore because since the discovery of Gravity Waves and the installation of GR as a science fact it follows none of those things are conserved. Space and time are curved and you don’t have a invariant reference to conserve quantities against.
If you want an explanation just search “Is Energy conserved in GR” and almost any hard scientist forum or site will explain it.
Always remember when using ye ole classical physics on things outside a very small localized setting that it may not hold. At the scale you are working it likely is not an issue and you can ignore. However if you want to be a deep thinker consider what happens with GR on a hotter (heavier Earth) versus a Colder (lighter Earth) if you now understand the background 🙂
Even simple systems can exhibit chaotic behavior for which it is not possible to derive all mechanics.
Conservation laws are still obeyed.
However climate/weather can’t be derived from mechanics alone.
Nick
I too am a programmer and have to deal with this type of error.
ATM I am working in retail where the sizes of clothes are determined by a size ratio
If I used your ‘elegant’ way of attacking the problem, pretty soon everyone in the country would be wearing ‘XXXL’ .
At least Willis has the inestimable wisdom to want to attach some common sense to a known problem.
“pretty soon everyone in the country would be wearing ‘XXXL’ “
My experience with off-the-rack shopping is that the store is already working on that principle.
But I think before people disparage the programming skills of Gavin, they should try getting a GCM working, or even a CFD program. It is a humbling experience. But they do work. It does help to be an eternal optimist.
Nick Stokes
“But I think before people disparage the programming skills of Gavin, they should try getting a GCM working, or even a CFD program. It is a humbling experience. But they do work. It does help to be an eternal optimist.”
Hmmm..it might be helpful to more rigorously define “works”:
10 CLS
20 PRINT “I believe”
‘ 30 PAUSE (for reflection)
30 GOTO 10
It does help to (be an eternal optimist) << be introspective.
🙂
Ethan Brand
Not convinced Nick
If your words were accurate, that the discrepancy is used to modify the algorithm in an elegant way
(“builds the correction into the basic equations. More elegant, but same effect”)
that’s like changing e = mc2 on an iterative basis.
crazy.
do it once, then start afresh, or, as willis says, keep on top of exactly what’s going on
nick,
“So to the equations which express the exchange of mass, energy and momentum between cells, you add an equation which says the global total must be unchanged.”
If you have multiple elements in the total, how does saying the total must stay the same determine how that is achieved? You can change any or all of the elements in order to keep the total the same. What changes you make to what elements will have a big difference on the overall environment! In other words it can have a big impact on the output of a CFC (e.g. CGM).
I can’t see that any linear computer model can mimic Earth’s climate. You’d think all the algorithms would be inputting to and getting feedback from each other in real time.
Not sure what you mean by a “linear model”, but computer models are constrained by the hardware, which effectively operates in discrete time increments. It takes X nanoseconds (or etc.) for the CPU to perform a single operation, and during that time slice it can’t take input from some other process. That short a time slice may look like real time to us, but it isn’t. And any particular calculation may require many operations in the CPU, which generally cannot be interrupted for new data input. (Also, some operations take longer than others, e.g. multiplication or real numbers is slower on most processors than addition or subtraction, and division is often slower than multiplication.)
Now a days, most climate models are run on supercomputers (or at least on GPUs, or maybe TPUs). That effectively means a multitude of calculations are done simultaneously. Nevertheless, the same time slice constraint is effective: although many calculations are done in a single time slice, they can’t take input from each other until that time slice is over.
The other part of this is that you’d like a 100 year (for example) climate model to finish in something under 100 years. So each time slice on the computer represents some longer time slice in the real world.
Even so-called “real time processors”, used to monitor industrial processes for example (or the Apollo moon landers, back when), slice real world time up into chunks, of necessity.
Regarding the 2004 prediction of warming being a continuation of warming that happened in the 30 prior years: CO2 increased enough in the decades prior to 2004 to account for much of that warming, upswing of multidecadal oscillations account for about .2 degree C of surface warming indicated by HadCRUT3 and HadCRUT4.
Couldn’t get past this, Willis:
==========
“…..If nothing else, the discrete digital nature of each calculation assures that there with be slight roundoff errors.”
Typing while holding three thoughts in your head, all at the same time ?
I’ve never been happy with using the word climate when global warming is the concept.
I prefer Wladimir Köppen’s plant-based boundaries for climates. Note the ‘s’.
Not that anyone agrees with me, of course.
~ ~ ~ ~ ~ ~ ~
“ We don’t know.”
At least we know all of the things we don’t know. Right?
– – winking smiley face – – Poe’s Law
The earth may well be remarkably stable in this respect.
If so, what about the rest of the planets and moons? If we have a remarkably stable body, a runaway ice cube and a runaway hot-house…
It cant be long till we have all the answers. no ?
@Willis
You might want to recall that blog of yours..
https://wattsupwiththat.com/2013/10/03/the-cloud-radiative-effect-cre/
I had the suspicion these NASA data do not make sense, so I put them to the test, at least where I could. Among other regions NASA suggests a massively negative CRE (cloud radiative effect) in the Bering Sea. Incidently there are the Aleutic Islands with 10 weather stations reporting to the NOAA, which again postet these data on its website (though has withdrawn it a while ago).
Here is the result of my analysis (years 2016 and 2017):
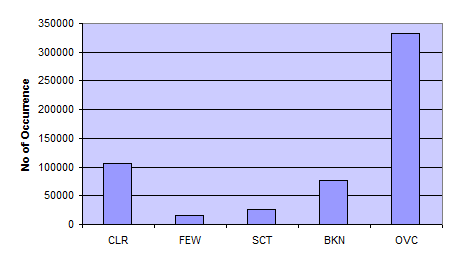
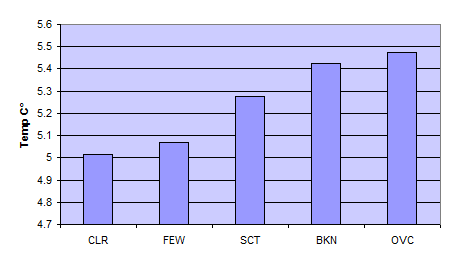
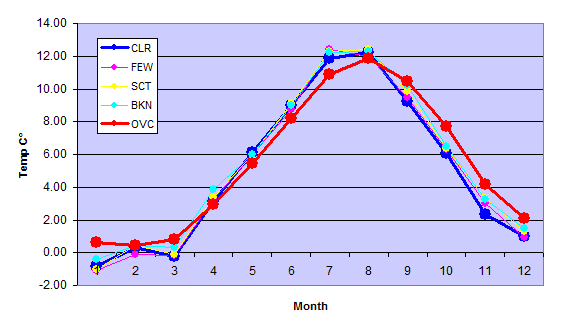
1. It is indeed a very cloudy region, with 60% of all records giving an “OVC” condition.
2. There is a strict, linear correlation between cloudiness and temperature. The more clouds, the warmer it is (seasonally adjusted)
3. We see the common pattern. From spring to mid summer, when solar radiation is relatively stronger as surface temperatures, clouds have a cooling effect. This is reversed for the rest of the year when surface temperatures are relatively higher than solar input.
Conclusion: The CRE in the Bering Sea is positive, as anywhere else on the planet. The named NASA data are garbage. And of course the “GHE” is based on the ill-fated believe clouds were cooling the planet, rather than warming it, as they do indeed.