Just a couple of days ago, climate scientist Dr. Roy Spencer suggested U.S. Warming Trends could be largely spurious.
In his analysis, Dr. Spencer examined another dataset maintained by the National Oceanic and Atmospheric Administration (NOAA) and found that when adjusted for population density, weather stations used to measure climate trends report lower long term temperature trends:
“… the highest population density stations had ~0.25 C/decade warming trend, with a reduced warming trend as population density was reduced…”
He adds:
“Significantly, extrapolating to zero population density would give essentially no warming in the United States during 1973-2011. As we shall see (below) official temperature datasets say this period had a substantial warming trend, consistent with the warming in the highest population density locations.
How can one explain this result other than, at least for the period 1973-2011, (1) spurious warming occurred at the higher population density stations, and (2) the evidence supports essentially no warming if there were no people (zero population density) to modify the microclimate around thermometer sites?
I am not claiming there has been no global warming (whatever the cause). I am claiming that there is evidence of spurious warming in thermometer data which must be removed.”
He also cited my work published at AGU in 2015:
Note that this is about the same as the trend I get with the stations having the highest (rather than lowest) population density. Anthony Watts reported qualitatively similar results using different data back in 2015.
Now, along the same lines, in a response to a Tweet I made today, panning the Biden appointment of NASA GISS Dr. Gavin Schmidt to a senior advisor on climate to the White House, atmospheric scientist Dr. Wei Zhang had this to say, and included a graph of his analysis I had not seen before:
We know with Gavin in charge , the temperature will go up… No matter what the thermometers say. I’m still waiting for a plausible explanation of why temperature adjustments are almost perfectly correlated with carbon dioxide. Would expect correlation to be near zero.

Wei Zhang adds in a follow up Tweet responding to another poster who ignorantly tries to tell him it the greenhouse effect 101, bold mine:
That’s not what I said. Why do temperature ADJUSTMENTS correlate with CO2? The probability that this happens by chance is shockingly close to zero.
For those of you that don’t immediately grasp the significance of this, here’s the meat of it.
What Wei Zhang has illustrated is almost a perfect correlation between adjustments to the surface temperature record made by NASA GISS (and Gavin Schmidt) and the concentration of CO2 in the atmosphere. They’ve artificially cooled the past prior to 1960 (about the time Mauna Loa CO2 measurements started) and artificially warmed 1960 to the present.
The result? A steeper warming trend (adding 0.24°C) than what actually exists in the unadjusted data.
It is proof of man-made climate change – created by adjusting the temperature data to fit a premise – that man-made CO2 released into the atmosphere is driving temperature.
But it seems very clear from Dr. Wei Zhang’s analysis that statistical adjustments are the major drivers of temperature increase here.
In my opinion, this is either scientific incompetency or fraud in my view, possibly both. I seldom use the word “fraud” in my criticisms, but when millions of dollars of funding, prestige of being appointed a White House climate advisor is at stake, what else is left? If they are true scientific experts, how does scientific incompetency like this persist for years?
Inquiring minds want to know.
It was clear the jig was up when HADCRUT no longer databased or transmitted the “unadjusted” data.
People sometimes ask what motive scientists could possibly have for lying about cagw. Being given a top job by the president probably qualifies
Good presentation, Anthony. The CAGW goal is control and expanding government at the expense of capitalism. There was a switch to Covid_19, but that started to look iffy as a substitute, so back we go to CAGW. “…there is either scientific incompetency or fraud, possible both.”. Alex, I’ll take “both” for a million bucks.
Hang in there, Anthony, you’re one of the few holding back the corrupt idiots. Thanks.
Embracing The Biggest Lie Possible is just Gavin and The Cause channeling their Goebbels methodology training.
If they can fake an election, they can fake the climate.
This is old news. climate4you.com has had such graphs of temperature adjustments for many years. The NASA chart on that web site shows that only temperatures measured around 1970 require no adjustments while those earlier must be cooled and those after warmed.
I wonder what it would look like if only night time temperatures were used?
Averaging ‘Global temperature’ is a bit of nonsense, it is they say somewhere just below 300K..
Anyone knows what might be average ‘Global altitude’ ? I suspect it might be somewhere around 210 meters.
Landmass 840m, Oceans 0m
/sarc
“BUT IT IS EVIDENCE OF MANMADE CLIMATE CHANGE – but not the in the way you think. By making manmade adjustments to the actual historical temperature records the self designated climate consensus make the data appear to agree with / support the claims of “manmade climate change.” How ironic to change the data making it “manmade climate change.” This became very clear when Thomas Karl published his temperature record adjustments (Science Express, 4 June 2015) which was opportune in the runup before the 2015 Paris COP meeting.
This graph and some context should comprise an effective press conference or front-page article in a news publication. Rebut the CAGW agenda with a simple, factual, visual data display. This should be “front-page” news.
There won’t be a rebuttal to this because they can’t. This will be put on ignore by the MSM and AGW community and the populace will not get to see it. Only a deep freeze will awaken the people.
Every time alarmists show me some “scary” graph, it is an “average” where, invariably, they have their thumb on the scale.
If this is not the case they should be able to show me the data for a single weather station that is terrifying. That is, if the “average”s are so daunting, then there should be some extremely scary historical datasets for individual weather stations.
Until then, they are a bunch of statistical frauds.
Two quotes apropos the above article and its implications, especially re: Gavin Schmidt:
“The primary method by which governments increase their control is by creating fear.” — Charles Eisenstein
“If you tell a lie big enough and keep repeating it, people will eventually come to believe it. The lie can be maintained only for such time as the State can shield the people from the political, economic and/or military consequences of the lie. It thus becomes vitally important for the State to use all of its powers to repress dissent, for the truth is the mortal enemy of the lie, and thus by extension, the truth is the greatest enemy of the State.” — Joseph Goebbels
Remember, there is “The Cause” that must be supported in climate science. No one doubts that as the climate scientists themselves all talk about it in their emails.
What you see in the graph is the result of the “cause”. Of course, by any other measure, “The Cause” is easily defined as agenda propaganda.
Scientific numerology is a curious thing, today’s sunspot count is 7 (seven)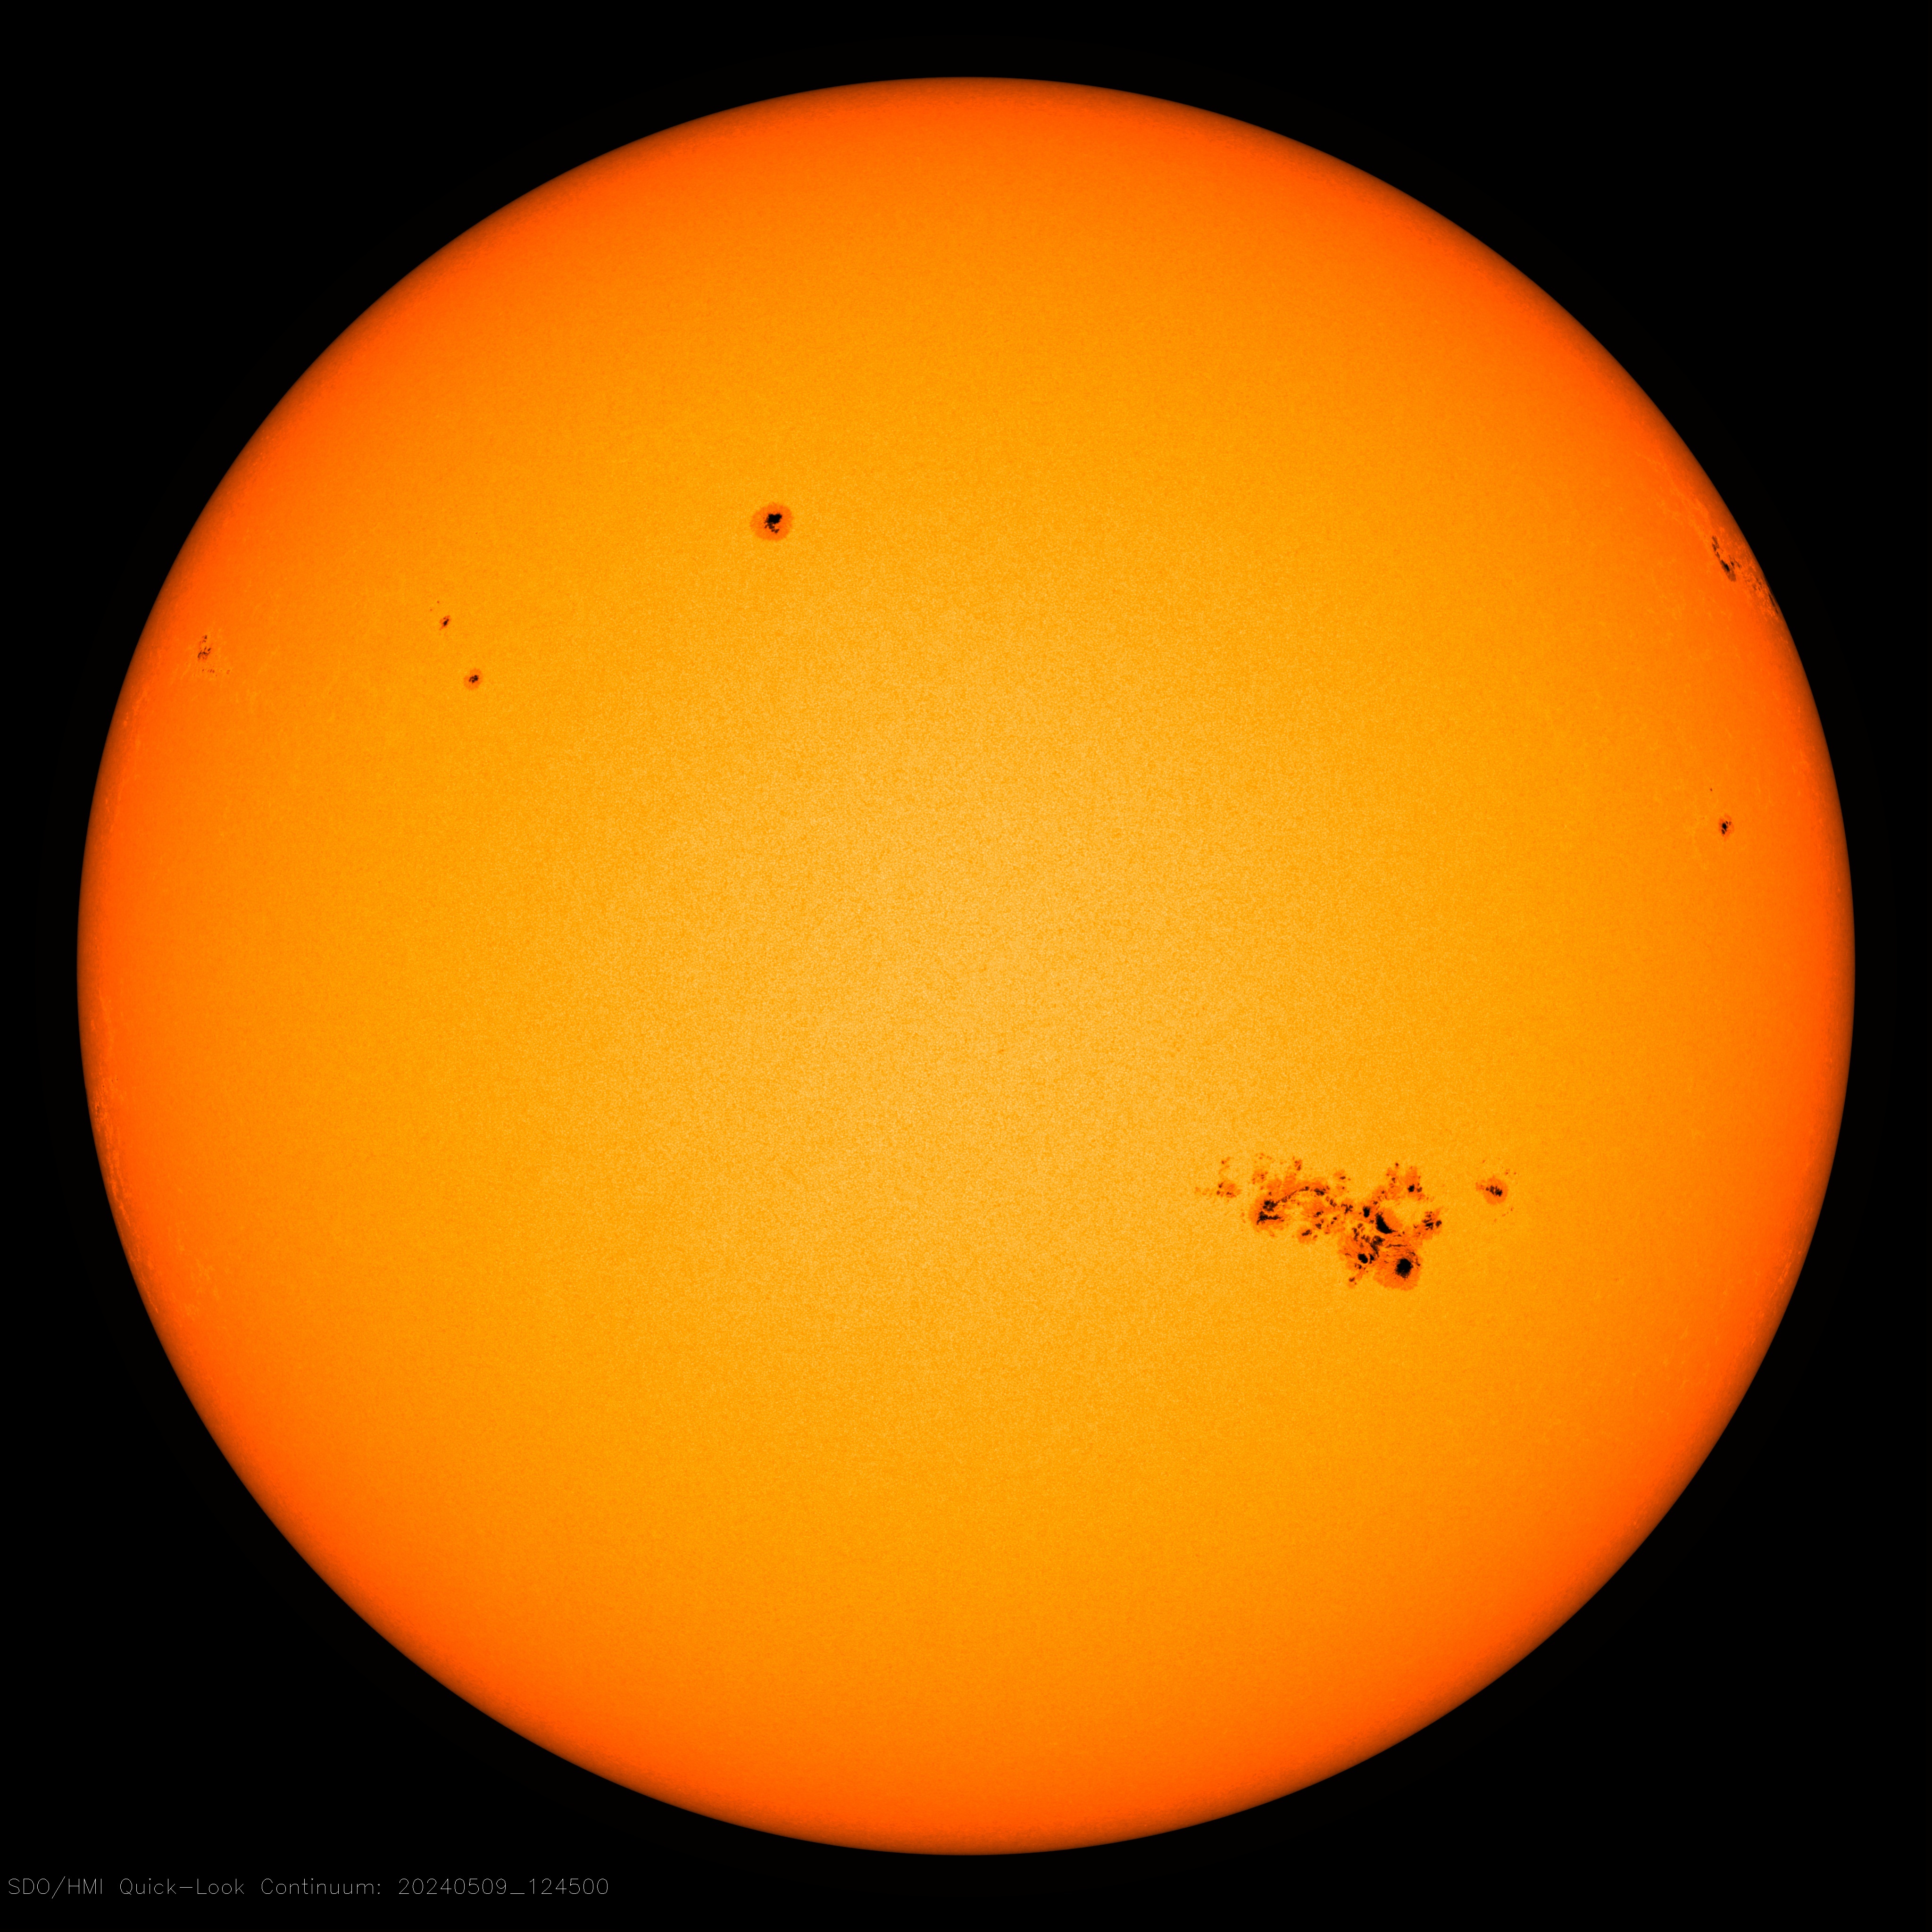
Here is up to minute solar image
For a test just zoom in to the max and see if you can find the offending sunspot !
(it’s on the disk somewhere around ‘2pm’ location near the edge)
Anthony, I don’t know how these things work in the USA but have you just invited a lawsuit?
Or is that just the Mann?
“The Shocking Climate Graph @climateofgavin Doesn’t Want You To See”
On the contrary, it is displayed on the GISS site, here:
https://data.giss.nasa.gov/gistemp/history/
They give an interactive presentation, showing various years that you can choose to compare. I chose to highlight 1997, 2002 and 2019

The plot below is the difference plot shown by Wei Zhang. You’ll see that the 1997 data only goes back to 1950; that is true also in 2001. The reason is that they didn’t back then have enough SST data to go back before that date. I suspect that what Wei Zhang is doing here is subtracting from 2019 land/ocean data the GISS met stations only data for 1999, calculated using land stations only. So the difference is not due to adjustment.
And, as you’ll see, it is just not true that the adjustments (made by NOAA, not GISS) are the main driver of warming.
OT a bit but a good story lead (C02 mixing in to ocean)
https://www.geoexpro.com/articles/2021/02/recent-advances-in-climate-change-research-part-x-how-quickly-does-atmospheric-co-mix-into-the-ocean-and-biosphere
I covered several variations on both Dr. Spencer’s findings (data from California) and this graph’s message (including a very similar one plus some other alternative depictions) in essay When Data Isn’t in ebook Blowing Smoke. Bottom line conclusion was the surface temperature data simply isn’t fit for purpose because of UHI over time, homogenization makes things worse, and the easily provable constant data fiddling is plainly warming biased—and not just in GISS.
Science itself is massively corrupted. Government dollars only pay for what they want, which is tools to manipulate the public. This is a primary lever of the Left and has been promoted as such for decades in their internal communications. It sounds too fantastic to be true so the average citizen doesn’t usually believe it but such is their contempt for the “people” they purport to fight for that they have no problem lying to them. This is the true background of climate change .University graduates from third world countries working at the UN and promotingtheir Great Lie to destroy Capitalism.
The size of the adjustment is in fairness much less than the temperature change observed, such as the 0.7 C rise since 1980 seen in the satellite data. It is true that the adjustments seem wrong, but they also seem smaller than the effect, which is also important.
What can I say.
There is no emperical evidence supporting CO2 driven AGW.
https://breadonthewater.co.za/2021/01/26/am-i-a-climate-denier-denialist/
Pity I did not get a reply from Roy.
It’s all part of the plan. 😉
“In my opinion, this is either scientific incompetency or fraud in my view, possibly both.”
I remember when you accused NOAA of deception, stating that “It can be shown that they systematically and purposefully, country by country, removed higher- latitude, higher-altitude and rural locations, all of which had a tendency to be cooler.”
And you were wrong, both about them “removing” stations, and about what the effect of station drop-out would be. Perhaps that, the mistakes you’ve repeatedly made regarding anomalies and different baselines, the fact that there are multiple independent groups who use the raw data and come up with very similar estimates (Berkeley Earth, Nick Stokes, GISS, HadCRUT, Cowtan & Way, and so and and so forth), the agreement between the US Climate Reference Network and the USHCN, and such would lead to a little humility before slinging accusations of fraud once again. If there’s any scientific incompetency here, perhaps you should look in the mirror…