


(Photo credits: NOAA)
By WUWT regular “Just The Facts”
Your help is needed in building the new WUWT “Extreme Weather” Reference Page. My recent article A Big Picture Look At “Earth’s Temperature” – “Extreme Weather” Update appears to have struck a cord with some of our Warmist friends, as I earned an “Extreme Denial” label from Tamino.
Apparently Tamino took issue with the fact that I only debunked the “Climate Change” = “Extreme Warming” meme from one angle, i.e. by showing that little if any warming has occurred over the last 15 years, thus claims that “Extreme Weather” has recently “arrived” and become “the new normal” are unfounded and erroneous. Tamino seemed disappointed that I had not attempted to debunk claims that there’s been a “dramatic increase in weather-related catastrophes”. He offered in support of this claim, an insurance company’s marketing materials and 3 charts (1, 2, 3) from the United States, which represents less than 2% of Earth’s surface area. Not particularly compelling.
I will address Tamino’s charts in further detail below, but the first order of business is to see if we can figure out whether there has been a “dramatic increase in weather-related catastrophes” and “Extreme Weather”. As such, I’ve created the WUWT “Extreme Weather” Reference Page and populated it with all of the credible 3rd party data on weather extremes that I am aware of. I am sure there’s more. Please post links to any credible data sources on weather extremes below or in comments of the WUWT “Extreme Weather” Reference Page, and we’ll review them for inclusion on the “Extreme Weather” reference page.
The credible global weather extremes charts I have found thus far are as follows:
Tropical Cyclones
Global Tropical Cyclone Accumulated Cyclone Energy (ACE)y – 1971 to Present
y - 1971 to Present")
Global Tropical Cyclone Frequency- 1971 to Present

Global Hurricane Frequency – 1978 to Present

Precipitation/Drought
Global Precipitation

Global Palmer Drought Severity Index (PDSI)

Tornadoes
US Strong to Violent Tornadoes (EF3-EF5) – 1950 to Present chart;

is also significant as “Tornado researcher Tom Grazulis estimates that about 75 percent of the world’s tornadoes occur in the United States.” Chicago Tribune However, this may be misleading in that “many countries do not keep records of their tornadoes. The actual number of tornadoes outside the U.S. is not known.” Answers.com
If you are aware of any other global or semi-global weather extremes charts from credible data sources, please post them in comments.
Returning to the charts that Tamino thinks I am in “Extreme Denial” of, the first chart Tamino offers is from the marketing materials of German Insurer Munich RE:

Munich RE is “one of the world’s leading reinsurers” “with income from reinsurance premiums alone at nearly €26.5bn (2011)”. Their “What we do” section begins with, “What happens if the sea level rises by one metre? How do offshore wind farms affect risks in the shipping business?” Furthermore, if you look at this Munich RE marketing press release from November 11, 2011, you’ll see that they have a clear financial interest in marketing and promoting the “Extreme Weather” meme:
Over the last 30 years, Asia Pacific has experienced more than 50% of all fatalities from natural catastrophes, almost 40% of all economic losses but less than 9% of the insured losses.
This shows the urgent need for wider natural catastrophe insurance coverage. This can be met through a variety of measures, from traditional insurance and reinsurance, to public-private partnerships or pooling of natural catastrophe risks nationwide.
Munich Re has the expertise and experience, and is discussing natural catastrophe schemes with governments all over Asia. The support can be twofold: on the one hand, driving the discussion in greatly exposed economies to structure country-wide solutions; on the other, finding solutions for governmental infrastructure assets such as roads and bridges. Munich RE
Clearly Munich RE has a significant financial interest in “discussing natural catastrophe schemes with governments”, thus it’s marketing materials cannot be considered a credible source for unbiased scientific data. It would be akin to a skeptic posting a temperature chart from Exxon Mobil, laughable.
This Federal Emergency Management Agency (FEMA) Disasters Declared chart is the second undeniable plot Tamino posted:

However, it appears more indicative of changes to the “disaster declaration” criteria versus a change in weather extremes, i.e.:
“FEMA was established under the 1978 Reorganization Plan No. 3, and activated April 1, 1979, by President Jimmy Carter in his Executive Order 12127″ Wikipedia.
“A review of data for a seven-year period from 1988 to 1995 reveals that large expenditures, as funded by supplemental bills, relate to declarations issued for the largest events. During this time period, disaster declarations were made for Hurricane Hugo, the Loma Prieta earthquake, Hurricane Andrew, the Midwest floods of 1993, and the Northridge earthquake. However, these were not the only events deemed worthy of presidential action and of cost to the federal treasury.”
“But like the tail of a comet, over 200 other declarations accounted for one quarter of such outlays, many of them of relatively minute cost and extent. While of lesser impact on the national treasury, such “low end” declarations have become, to some observers, new sources of federal spending at the local level, long referred to in other contexts as “pork barrel spending.” Congressional Research Service
“In 1996, the agency was elevated to cabinet rank.” which correlates well with the spike in Disasters Declared in the second half of the 1990s. Furthermore, if you look at this 2011 FEMA list of 99 “Major Disasters” versus these lists from 1958 and 1959 with 7 “Major Disasters” each, it seems apparent that the FEMA data is biased by changes in disaster declaration criteria, e.g. “events deemed worthy of presidential action and of cost to the federal treasury”. As such the FEMA Disaster Declaration data is not a credible proxy for “Extreme Weather”.
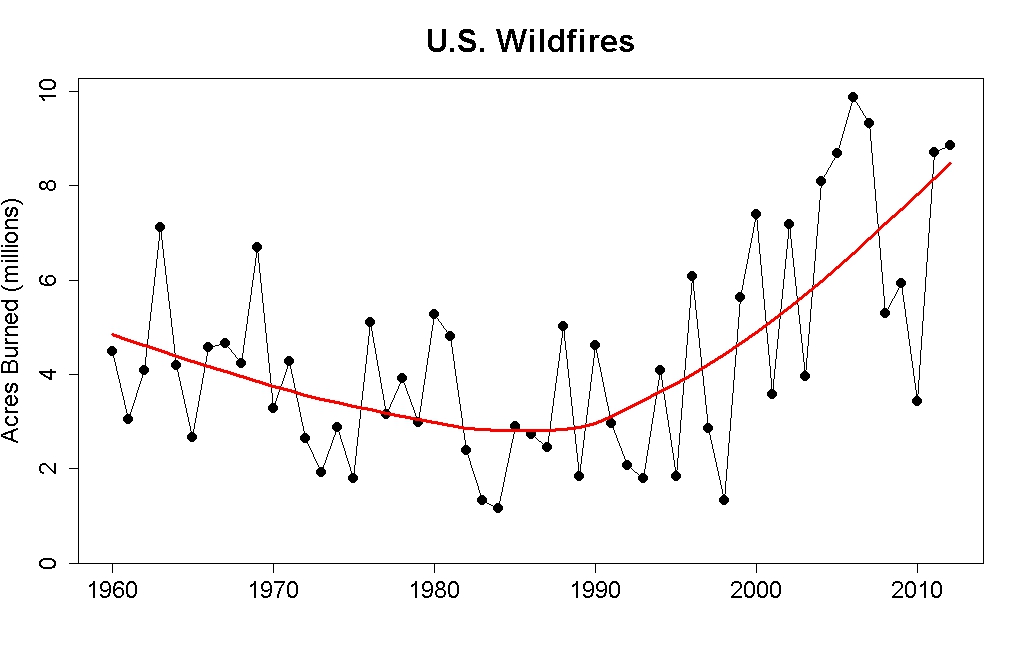
Third Tamino’s posted this US Wildfire chart;

however, it only shows Acres Burned, whereas the following chart shows the US Acres Per Wildfire and the Number of Wildfires Per Year:

This is an important distinction as the associated article elaborates:
This graph shows the inverse relationship between numbers and sizes of US wildfires over time. Note the greater number and smaller sizes of fires between the creation of Wilderness in 1964 and the beginning of the modern wildfire era in 1987 and 1988 (with Silver Complex and Yellowstone fires of those years), as compared with the smaller number and greater size of recent fires. One factor may be the shift in USFS policy from rapid suppression to “let it burn,” which has allowed for numerous smaller fires – previously extinguished individually — to coalesce into larger fires and singular complexes.Evergreen
For reference;
“Forest managers agree that the current fire risk is primarily a combination of two factors — higher-than-average temperatures and a profusion of fuel, the product of nearly a century of fire suppression policies.”
“Recognizing widespread overgrowth in American forests, in the late 1970s the Forest Service began reintroducing policies of prescribed burning and allowed many smaller, natural fires to burn out on their own, provided they didn’t threaten lives or property. The decision this summer to attack all fires, while not a direct reversal of this policy, does represent a departure from that practice of natural restoration, said Jennifer Jones, a public affairs specialist with the Forest Service. Scientific America
The shift in thinking was formalized in a 1995 statement of federal fire policy, and strengthened in a 2001 revision. The policy recognizes that fire is “an essential ecological process,” and that decades of trying to keep fires from burning have led, ironically, to “larger and more severe” conflagrations because of the buildup of underbrush and other fuel. USA Today
As such, US Forest Fire data is biased by “nearly a century of fire suppression policies” and “the shift in USFS policy from rapid suppression to ‘let it burn,'”, which begin “in the late 1970s”, “was formalized in a 1995 statement of federal fire policy, and strengthened in a 2001 revision.” US Forest Fire data is not a credible proxy for “Extreme Weather.”
Finally, Tamino offers this NOAA Extremes in 1-Day Precipitation chart;

which is relevant, but it is only illustrates the “Contiguous U.S.”, which is just “1.58% of the total surface area of the Earth” and the chart ends in 2011. Fortunately, this NOAA Extremes in 1-Day Precipitation – 1910 to Present – Year to Date chart;

shows the full US, which is at least closer to 2% of Earth’s surface area, whatever that means, and the chart is current through October 2012, so it shows the drop in Extremes in 1-Day Precipitation that has occurred during 2012. This Extremes in 1-Day Precipitation chart was one of a number US climate extreme charts that were already included in the WUWT US Climatic History Reference Page, which I’ve now added, along with an array of other US centric weather extreme charts, to the WUWT “Extreme Weather” Reference Page
Tamino didn’t do so well supporting claims that there’s been a “dramatic increase in weather-related catastrophes”, “Extreme Weather” has “arrived” and is now the “new normal”. Perhaps you can do better? Please post all credible charts on weather extremes in comments and we will review for inclusion on the WUWT “Extreme Weather” Reference Page. Thank you in advance for your assistance.
Please note that WUWT cannot vouch for the accuracy of the data/graphics within this article, nor influence the format or form of any of the graphics, as they are all linked from third party sources and WUWT is simply an aggregator. You can view each graphic at its source by simply clicking on it.
@Kurt in Switzerland
Haha, Google Trends shows an unprecedented use of the word unprecedented (2004-12), and when you tick the forecast box, the forecast is for a further unprecedented increase.
http://www.google.com.au/trends/explore#q=unprecedented
Jimbo says: November 23, 2012 at 1:39 pm Reinhard Böhm – Austrian Central Administration For Meteorology (ZAMG) – Click the pic to view at source[/caption]
Here ya go…………..
Solid…
* scroll down a little on this page as I have given several other references which Antony added to his post as an “Update”.
http://wattsupwiththat.com/2012/05/27/another-paper-shows-that-severe-weatherextreme-weather-has-no-trend-related-to-global-warming/
I added a new Europe section, and included this Central Europe Pressure – Temperature – Precipitation chart:
[caption id="" align="alignnone" width="578"]
from the original article and added an Additional Research section at the end:
Anthony Watts – WattsUpWithThat.com
“See also my compilation of extreme weather trends (not).”
Floods – no increase in frequency, less intense
Extreme weather events – no trend
Global precipitation – no trends
Rate of sea level rise – deceleration over 80 years
Weird weather – no trends
Forest fires – decreasing frequency
Tropical Pacific sea level rise – fell
“Little change in global drought over the past 60 years”
http://www.nature.com/nature/journal/v491/n7424/full/nature11575.html
“Dr. Ryan Maue releases new hurricane frequency data showing a negative trend in the last 30 years”
http://wattsupwiththat.com/2012/10/01/dr-ryan-maue-releases-new-hurricane-frequency-data-showing-a-negative-trend-in-the-last-30-years/
http://www.agu.org/journals/gl/gl1114/2011GL047711/2011GL047711.pdf
“U.S. tornado activity near low point in modern record”
After one of the busiest years for tornadoes in 2011, tornado numbers in 2012 have come crashing down to historic lows.
In 2011, there were 1692 twisters – second most on record. This year, only 882 tornadoes have touched down. (Tornado records date back to 1950*).
http://www.washingtonpost.com/blogs/capital-weather-gang/post/about-face-tornado-activity-near-low-point-in-modern-record/2012/11/14/9ee31a2a-2e86-11e2-89d4-040c9330702a_blog.html
All are now covered within the “Extreme Weather” page.
“New paper finds the highest storm activity is associated with cold periods”
http://hockeyschtick.blogspot.com/2012/11/new-paper-finds-highest-storm-activity.html
“We find that high storm activity occurred periodically with a frequency of about 1,500 years, closely related to cold and windy periods diagnosed earlier”
http://www.nature.com/ngeo/journal/vaop/ncurrent/full/ngeo1619.html#ref1
Yes, interesting, changes to storminess absent anthropogenic CO2, who would have imagined?… 🙂
Added to the Additional Research section:
Thank you
I wonder what Leland Palmer believes that skeptics ‘deny’?
Palmer’s mindless pejorative name-calling takes the place of any rational thought. He is the typical ignorant climate alarmist, with no room for honest science in his screwed up belief system. True Believers like Palmer have bought into evidence-free propaganda that CO2 is a problem, but they have zero supporting scientific facts for their belief. There is no evidence showing that CO2 is any kind of a problem. None. The only empirical evidence available shows that CO2 is harmless, and beneficial to the biosphere.
The scary thing is that people like Leland Palmer are actually allowed to vote. No wonder we have such enormous social problems. The lunatics have got control of the asylum, as the last election makes clear.
I’ve had relatives in NY respond negatively to my links to sites (links to source references from WUWT, Steve Goddard, etc) that counter the globaloney warming scare. They come back to me stating that having experienced flooding from hurricanes on Long Island twice in 2 years just couldn’t be coincidence. I’m simply amazed at how college educated people can lack even the beginnings of analytic thought. I send them links to the data graphs from NOAA , the University of Colorado and other sites showing hurricane ACE or frequency trends or sea level trends that are at odds with the alarmist spin. They usually ignore the actual data and simply want to repeat the media’s alarmist spin. It is so disheartening. The alarmists have a fascinating quasi-religious hold on their minds. I see people here and elsewhere put down this closed-mindedness as a type of religious dogmatism. I object to this comparison as I am a Christian and the quality of thought and careful reflection found in the writings of Christian theology and apologetics is by far so superior to that of these green ideologues as to be incomparable. Anyway, the fight for simple sanity continues. I look forward to your further efforts, Consolidating information even more would be very helpful. Thank you, Anthony and company.
noaaprogrammer says: November 23, 2012 at 5:03 pm
justthefactswuwt says:
“Earthquakes have very little to do with weather, …”
To the extent that deep underground water can lubricate a fault line so that slippage occurs before more tension can build, there might be a low correlation between increased precipitation and more frequent, but less catastrophic earthquakes. Does anyone know of any research done on this?
According to the U.S. Geological Survey:
However, this New Scientist article states that;
and from the University of Miami Rosenstiel School of Marine & Atmospheric Sciences:
However, regardless if weather might be able to influence the occurrence seismic activity, a seismic event is fundamentally not a weather event. I would amend my statement above to say that “Earthquakes have very little to do with causing or influencing weather”.
Thank you
Here are a few possible non-natural causes of increasing insurance claims:
1. Greatly increased pleasure boat ownership and average pleasure boat value. (A proxy for this would be number and size of marinas and size of average berth in marinas. Another proxy would be annual sales of such boats, probably available from the Dept. of Commerce and/or some trade association.)
2. Increased use of frozen food, and ordinary food like meats stored in a freezer–which goes bad in an outage. Plus larger modern refrigerators store more perishable items, enabling people to shop less frequently, but putting more value at risk.
3. Increased issuance of official evacuation orders, and increasing compliance with them. These save lives but, with residents no longer in place, there’s less likelihood of vulnerable household goods being sheltered or moved to a safer location within the house during a storm or flood, of broken windows being patched up, etc. Also, there’s greater vulnerability to looting.
4. Increasing forest grow-back in the NE of the US may have made electrical lines more vulnerable to falling trees.
5. Possible lesser strictness with insurance claims by insurers, owing to one or both of these factors: A) Greater off-loading of risk onto reinsurers; B) Legally mandated standards for payment of claims. (I.e., in the litigious US, homeowners whose claims have been denied must have sued and established case law that certain rules of thumb insurers used to use to estimate the value of losses, or allowable types of claim, were too ungenerous. I think this could be a big part of the explanation, and one that outsiders would likely overlook. But my thesis is supported by the much greater increase in insurance payouts in the litigious US compared to other regions, per Munich Re’s figures. I urge researchers to probe this by, as a first step, interviewing veteran insurance agents to see if there’s anecdotal support, then checking trade journals of the industry to see if this trend was reported on in them. One clue might be the cost to insure per unit insured. If the cost of insurance is higher in the areas of the US that haven’t had increased disasters in recent decades, this could point to lesser strictness with claims as an explanation.)
6. Possible higher-insured-house-values, due to pressure from mortgage holders (bankers, etc.). If the bank now wants, say, 90% of a house’s value to be insured compared to 50% 40 years ago, then claims will increase.
7. Possible interaction between creeping inflation and fixed deductibles. If mortgage holders set a standard 40 years ago of $1000 for deductibles (say), or if that is what is habitually chosen, then inflation will ensure that damages over the deductible amount will increase over time.
8. Possible increasing readiness of insureds to file a claim, owing to greater sophistication about interacting with such paperwork, greater ease of doing so (e.g., online), greater assistance from emergency management agencies, more sources of information online, and greater litigiousness and lesser stoical acceptance of fate, etc.
The “inflation” referred to is the increasing number of small tornados that are detected in recent years. What NOAA has done is to figure out the average ratio of minor to major storms in the current period, and then to upwardly adjust the number of small tornados presumed in past periods.
I visited the Yahoo UK site today and read stories about the flooding there. A couple of commenters remarked that the main cause of flooding is the elimination or reduction of river dredging in the past decade or more. In UK comments I’d read in past years the same complaint had been made–and the finger had been pointed at greenies, who don’t want the minnows disturbed (and who might, IMO, enjoy seeing persons who have sacreligiously settled in a flood palin to get their just deserts). (And, or course, at penny-pinching, short-sighted agencies and local governments. This apparently was what happened with the power company (government-owned) in Long Island).
Of course, they don’t want to blame themselves for settling in a vulnerable area or filing to harden their house against water intrusion. They want the finger of blame to point elsewhere. Just like the unprepared politicians above them.
Oops–failing, not filing.
PS: A few months ago, to gather ammo for an online scuffle I was in, I started reading books on critical thinking, fallacies, and logic. It’s terrific stuff. Such courses should be required in every grade–they’re more important than anything else.
Michael says: November 23, 2012 at 1:47 pm Drought Frequency and Severity - 1402 to 2002") SaskAdapt – the Prairie Adaptation Research Collaborative at the University of Regina – Click the pic to view at source[/caption]
SaskAdapt – the Prairie Adaptation Research Collaborative at the University of Regina – Click the pic to view at source[/caption]
Here is the chart.
http://www.parc.ca/saskadapt/adaptation-options/theme-assessments/water-drought
Small regional coverage, i.e. the Prairie Provinces (Alberta, Saskatchewan, and Manitoba Canada), but the length of the record, i.e. 1402 to 2002, makes it noteworthy. Added at the bottom of the North American section:
“Prairie Provinces (Alberta, Saskatchewan, and Manitoba Canada) Drought Frequency and Severity – 1402 to 2002”:
[caption id="" align="alignnone" width="578"]
Thank you
Jimbo says: November 23, 2012 at 1:56 pm
http://onlinelibrary.wiley.com/doi/10.1002/qj.776/full
August 2011
“Fluctuations in some climate parameters
Abstract
There is argument as to the extent to which there has been an increase over the past few decades in the frequency of the extremes of climatic parameters, such as temperature, storminess, precipitation, etc, an obvious point being that Global Warming might be responsible. Here we report results on those parameters of which we have had experience during the last few years: Global surface temperature, Cloud Cover and the MODIS Liquid Cloud Fraction. In no case we have found indications that fluctuations of these parameters have increased with time.”
http://www.sciencedirect.com/science/article/pii/S1364682611000319
Added to Additional Research section:
A.D. Erlykina, B.A. Lakenb and A.W. Wolfendalea – Fluctuations in some climate parameters – Journal of Atmospheric and Solar-Terrestrial Physics:
Paper – http://www.sciencedirect.com/science/article/pii/S1364682611000319
“There is argument as to the extent to which there has been an increase over the past few decades in the frequency of the extremes of climatic parameters, such as temperature, storminess, precipitation, etc, an obvious point being that Global Warming might be responsible. Here we report results on those parameters of which we have had experience during the last few years: Global surface temperature, Cloud Cover and the MODIS Liquid Cloud Fraction. In no case we have found indications that fluctuations of these parameters have increased with time.”
Thx
This really is not fair. Asking for Just The Facts!!!
Sad, but true. The Warmists’ flimsy narratives are vulnerable to readily available facts.
Hi Roger:
“PS: A few months ago, to gather ammo for an online scuffle I was in, I started reading books on critical thinking, fallacies, and logic. It’s terrific stuff. Such courses should be required in every grade–they’re more important than anything else.”
Yes, at least around here.
Around here, the ability to argue endlessly is certainly more important than a sense of vision, for example.
Certainly, the ability to argue endlessly is more important than the ability to see a melting icecap.
Roger Knights says:
November 23, 2012 at 9:36 pm
“… Such courses should be required in every grade–they’re more important than anything else.”
I agree wholeheartedly. The three Rs. Then the nuances of argument, logic and scientific method. Then… whatever you like, as you are armed for life.
The activists believe we should stop at two Rs and delegate everything else.
To Laura’s dad (Mr Palmer) – your vision may be correlated to your dread of ice melt? What if we don’t wish to become infected with your fear(s)?
Take a look at what I’ve just posted here:
http://wattsupwiththat.com/2012/11/23/climate-ugliness-goes-nuclear/#comment-1155993
Anthony
My friend Heinz Thieme – you should have him on your link list –
has an Internet page with (but sorry these are in German – but the pictures are self explaining):
Historic high water marks
Frequency of hurricanes and typhoones since 1990
Eleven-Touwn-Tour ( Elfstedentocht ) skate races in Holland on frozen channels
and two hints from museums for Climate change in recent earth history
The information is very valuable!
I think if we ask him, he may be willing to translate this.
Historic high water marks
http://real-planet.eu/hochwasser.htm
http://real-planet.eu/
Juergen Michele
Chris Landsea did some good work showing hurricanes correlate with AMO
“These multi-year swings in ocean temperature are nearly an exact match to the adjusted number of tropical storms, adjusted hurricanes, U.S. hurricanes, and normalized U.S. hurricane damages. When stratified by the Atlantic Multidecadal Oscillation, there is a doubling in the number of major hurricanes, a 50% increase in the frequency of U.S. landfalling major hurricanes, and over three times as many Caribbean hurricane strikes between the warm and cool phases.”
http://www.aoml.noaa.gov/hrd/Landsea/gw_hurricanes/
Gee, how about snow?
accuweather: endless winter for Alask’s mountains
CHINA: Worst snow in 50 years damages 400 greenhouses
Graphs for Snow Cover in the month of October. This would be the start of cooling in the Northern Hemisphere since Arctic Sea Ice starts increasing in mid September. October would be the most sensitive to the rate of change in heating or cooling of the NH.
NOAA Norther Hemisphere snow cover
North American Snow Cover
Eurasia Snow Cover
Northern Hemisphere Sea Ice extent
Southern Hemisphere Sea Ice extent
Can we predict the duration of an interglacial?
“…thus, the first major reactivation of the bipolar seesaw would probably constitute an indication that the transition to a glacial state had already taken place.”
P. C. Tzedakis, E.W. Wolff, L. C. Skinner, V. Brovkin, D. A. Hodell, J. F. McManus, and D. Raynaud
WUWT discussion of paper: http://wattsupwiththat.com/2012/10/02/can-we-predict-the-duration-of-an-interglacial/
PDFs of the paper:
http://www.clim-past.net/8/1473/2012/cp-8-1473-2012.pdf
http://wattsupwiththat.files.wordpress.com/2012/10/cp-8-1473-2012.pdf PDF raw
http://wattsupwiththat.files.wordpress.com/2012/10/cp-8-1473-2012-hlt.pdf PDF highlighted
Roger Knights
Those are valid points about the rising cost of insurance. In our own experience I have noticed our family is simply buying more insurance; more things to insure at higher values and we seem less willing to carry any of the risk on our own shoulders. My late father had an opinion about insurance and people like us: “on Sunday they place their faith in providence, on Monday they buy more insurance”.
Ah, it looks like Leland Palmer finally got past the moderators, as in, he obeyed site policy. And he ended with:
“Certainly, the ability to argue endlessly is more important than the ability to see a melting icecap.”
So he’s reduced the level of insult from near-slanderous to merely condescending.
Leland, if I may address you thus, it’s good to see you here, because it does at least mean you are not blindly ignoring the fact of really well founded scepticism. But regarding any melting icecap, yes, we are aware of that (it’s late spring in Antarctica now so the icecap is, thank goodness, now melting from its “record” high extent). And yes I know you mean the Arctic icecap, and here we do actually like to see data and reasons and scientific consequences and balanced comparisons with past behaviour. The Arctic icecap, like season for like season, is certainly in decline on average, but has this never happened before? Do you find it interesting that in Greenland ice reduction is leading to archaeological finds of items dated 800-1000 years ago?
Rich.
Is NOAA starting to see real facts are demanded not just computer modeling using faulty data sets? NASA has also pulled in their nasty attitude – what is going on?
We should have all known that the hypothesis of AGW was going to fall apart when the lead “SCIENTISTS” set out their findings for peer review but withheld the base data and the details of the computer model as the information was “PROPRIETARY” and so could not be made available?? So, then invent “CONSENSUS OF SCIENTISTS” and declared the PROOF.
US state max temp records – most set in the 1930’s.
http://notalotofpeopleknowthat.wordpress.com/2012/11/17/us-maximum-temperature-records-by-state/
US state 24 hour precipitation records – last decade below average.
http://notalotofpeopleknowthat.wordpress.com/2012/11/16/extreme-rainfall-events-in-the-usa/
No trend in extremely wet or dry years by US regions.
http://notalotofpeopleknowthat.wordpress.com/2012/04/15/is-our-weather-becoming-more-variable/
NOAA’s Martin Hoerling really said all there was to say, when he responded to Rahmstorf’s paper “A Decade of Weather Extremes”, a few months ago.
Among his choice comments
Exaggerated language, and many unsubstantiated assertions. For instance, in what manner did the last decade experience an “unprecedented” number of extreme weather events? Note that the increase in heat waves was largely balanced by a decrease in cold waves—-
Very few of the [cases of extreme weather listed in the paper] have undergone a scientific investigation of contributing factors, let alone human impacts. I believe that a read of the Lewis and Clark journals would reveal an impressive list of extreme weather also…. so what is one to make of this list for the 2001-2011 period provided in this Perspective by Coumou and Rahmstorf. The fact is that extremes happen, have happened, and will continue to happen. For some, their character, preferred phase, and intensity may be changing (aside from temperature extremes, the detection and attribution evidence to date is weak).
http://notalotofpeopleknowthat.wordpress.com/2012/04/14/rahmstorfs-claims-of-increasing-extreme-weathera-damning-put-down-by-noaa-expert/
It would be helpful to have links to the actual numeric data, not just the charts. Maybe it’s just because I was a math major, but I like to know the precise values and trends.
“Extreme Weather” Reference Page ???? You mean this . . . . coming from those who think tenths of a degree in temperature are extreme???? . . . coming from those who think parts per million of an air component are extreme??? . . . . coming from those who think millimeters of sea level rise compared to the total depths of the oceans are extreme????
The only extremes are the insurance losses, and that’s because the fired all the good acturaries, and hired GIGO experts . . . . . (sadly, a long time ago!)
Laurie,
I like that – lets us think, does water expand when heating or cooling? Humm rising sea level?
CGN writes: …the collective anxiety that is clearly felt by a section of the population with regard to the climate issue.
I think the “collective anxiety” is truly felt by only a small percentage and it’s the main stream media that exaggerates/amplifies it.