Global Cooling – Climate and Weather Forecasting.
Guest post by Dr. Norman Page
Introduction.
Over the last 10 years or so as new data have accumulated the general trend and likely future course of climate change has become reasonably clear. The earth is entering a cooling phase which is likely to last about 30 years and possibly longer. The major natural factors controlling climate change have also become obvious.Unfortunately the general public has been bombarded by the scientific and media and political establishments with anthropogenic global warming – anti CO2 propaganda based on the misuse and misrepresentation of already shoddy IPCC “science” for political ,commercial and personal ends.
The IPCC climate science community largely abandoned empirical Baconian inductive scientific principles and built worthless climate models based on unfounded assumptions designed to show that anthropogenic CO2 was the driving force behind changing climate. Most of the IPCC output is useless as a tool for predicting future climate trends and their impacts and in particular the IPCC Summaries for Policymakers can be safely ignored for practical purposes. The divergence between the IPCC Hansen projections and the observed trends is shown below.
Fig 1 ( From Prof. Jan-Erik Solheim (Oslo) )

Fortunately, however , the basic data is now easily available so that any reasonably intelligent person can check on line daily or monthly to see what the incoming empirical data actually is and draw ones own conclusions.
Here’s how to do it in a few simple steps. I have put in CAPITALS the main empirical observations on which one can draw conclusions re climate change ,its causes and future trends and also get a good idea of weather patterns and trends for the next year or so.
1. Check the Temperature Trends and Data.
Because of the Urban Heat Island effect ,the built in local variability of the NH land data and the thermal inertia of the oceans, Sea Surface Temperatures are the best measure of global temperature trends. These show that the global warming trend ended in about 2003. THERE HAS NOW BEEN NO NET WARMING SINCE 1997 -15 YEARS WITH CO2 RISING 8.5% WITH NO GLOBAL TEMPERATURE INCREASE. SINCE 2003 THE TREND IS NEGATIVE.
To check the past years go to
ftp://ftp.ncdc.noaa.gov/pub/data/anomalies/annual.ocean.90S.90N.df_1901-2000mean.dat
and for monthly updates go to.
ftp://ftp.ncdc.noaa.gov/pub/data/anomalies/monthly.ocean.90S.90N.df_1901-2000mean.dat
The 2012 average NCDC SST anomaly thru Sept was .4438 versus the 1997 annual anomaly of .4575.
The peak anomaly was .5207 in 2003.
An excellent site for reviewing all the basic temperature data is http://www.climate4you.com/
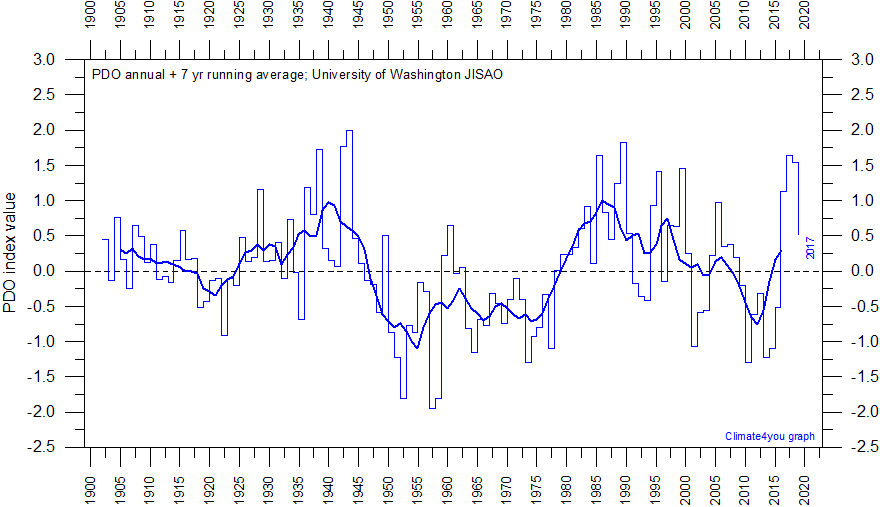
2. Check the current phase of the Pacific Decadal Oscillation.
Here is a plot and suggested projection based on the Hadley SST3 from Tallbloke.

(See: http://tallbloke.wordpress.com/2012/10/23/the-carbon-flame-war-final-comment/) He says “I have put together a simple model which replicates sea surface temperature (which drives global lower troposphere temperature and surface temperatures a few months later). The correlation between my model and the SST is R^2=0.874 from 1876 FOR MONTHLY DATA.” The model is shown with predictions to 2050 (blue) along with the HADsst3 (red).
I included Fig 2 because an approximate 60 year cycle is obvious by inspection and this coincides well with the 30 year +/- positive (warm) and 30year +/ negative (cold) phases of the Pacific Decadal Oscillation. Figure 2 shows warming from about 1910 – 1940-45 , cooling from then to about 1975 -.warming to about 2003-5 and cooling since then. Total warming during the 20th century was about 0.8 degrees C. For a complete discussion and review of the data relating the PDO to the other oceanic cycles and temperatures see
For latest PDO data see http://jisao.washington.edu/pdo/PDO.latest
IT IS CLEAR THAT WE ARE IN THE EARLY STAGES OF A THIRTY YEAR NEGATIVE (COOLING ) PDO CYCLE.

3. Check Solar Activity – where are we at?
The major ice age climate cycles are controlled by the sun – earth orbital eccentricity,and the earth’s obliquity and precession. These cycles are approximately 100,000, 41,000 and 21000 years in length respectively and are well documented in the ice core and geological record. It is useful to keep in mind that the warmest temperatures in the current interglacial occurred about 7500+/- years ago and the GENERAL TREND IS NOW A COOLING TOWARDS THE NEXT ICE AGE.
Fig 4 http://colli239.fts.educ.msu.edu/1999/07/11/vostok-1999/

These long term cycles are modulated by quasi cyclic trends in solar activity which may be decadal ,centennial or millennial in length.Of particular interest in deciding where we are with regard to the solar cycles is the approximately 1000 +/- year cycle which produced succesively the Roman Warm Period, the Dark Ages,the Medieval Warm Period, the Little Ice Age and the recent 20th century warming.
Fig 5 (From http://www.theregister.co.uk/2012/07/10/global_warming_undermined_by_study_of_climate_change/ )

The red line shows the continuing cooling trend from the Holocene optimum and the 1000yr +/- solar cycle is clearly seen.
NOTE – A REASONABLE CASE CAN BE MADE THAT THE WARMING PEAKS OF A 60 YEAR PDO CYCLE AND THE 1000 YEAR SOLAR CYCLE COINCIDED AT 2000 +/- AND WE ARE LIKELY ON THE COOLING SLOPE OF BOTH.
The clearest empirical measure of solar activity is the solar magnetic field strength. On an empirical basis Livingston and Penn have shown that the decline in solar magnetic field strength suggests that sunspots could disappear by about 2015 signalling THE START OF A NEW MAUNDER MINIMUM WITH SIGNIFICANT COOLING.
For a semi-empirical estimate of the possible cooling if a Maunder Minimum does develop see http://pubs.giss.nasa.gov/docs/2001/2001_Shindell_etal_1.pdf
Note the abstract of the Shindell paper (Mann is one of the et als) says “THIS LEADS TO COLDER TEMPERATURES OVER THE NORTHERN HEMISPHERE CONTINENTS ESPECIALLY IN WINTER (1 to 2 C), IN AGREEMENT WITH HISTORICAL RECORDS AND PROXY DATA FOR SURFACE TEMPEERATURES
“For a good review of the latest sunspot and magnetic data see
http://wattsupwiththat.com/2012/09/03/the-sun-still-slumping/ and to keep with the decline in solar magnetic field strength and the liklihood of a Maunder Minimum check monthly the Livingston and Penn thread at
http://solarcycle24com.proboards.com/index.cgi?board=general&action=display&thread=855
Perhaps the best indicator of the effect of the declining solar magnetic field can be seen in the Galactic Cosmic Ray flux.
This can be checked on a daily basis at http://cosmicrays.oulu.fi/#database
Fig 6 Neutron count since 1964 from the Oulu data base.

The Dec 2009 neutron maximum ( solar cycle 23 -24 minimum) is greater than anything seen previously and the neutron count is now (Nov 2012) higher than at any comparable time in previous cycles since we are only 12 -18 months away from the cycle 24 solar maximum.There was a secular change in solar magnetism in 2005 – check the WUWT link posted earlier. The neutron count ties to earths climate via cloud cover and albedo. Simply put – the lower the neutron count the lower the cloud cover and the warmer the temperature. Because of the enthalpy and thermal inertia of the oceans there is a 10 – 12 year lag between the neutron troughs and global SSTs. The short term temperature record is variable over shorter times than 12 years because of El Ninos and La Ninas and volcanic and lunar effects but the increasingly lower counts on the three troughs from 1970 – 1991 are well matched by the temperature rise from 1981 – 2003. THE RELATIVELY HIGH NEUTRON COUNT IN 2012 COMPARED WITH 1970 SUGGESTS THAT BY 2024 GLOBAL TEMPERATURES WILL BE BELOW THOSE OF 1970 WHICH WERE ALREADY BELOW 2012 BY ABOUT 0.36 C.
4. Check the Southern Oscillation Index.
Fig 7 http://www.bom.gov.au/climate/enso/

In Fig 7 values above +8 indicate La Ninas, values below -8 are El Ninos and values in betwen are neutral or La Nadas.
Figure 7 also has some predictive value relative to global temperatures. ( Mclean et al JGR 2009) Global temperatures appear to lag the SOI by about 7 months.
5. Climate , Weather and Extreme Events.
Sections 1 – 4 above show that the earth has entered a cooling trend which will continue for at least 30 years and perhaps longer. To get some idea of possible extreme weather events we might look at extremes found between the MWP and the Little Ice Age. It is unlikely however that any future extremes will be “unprecedented”.There is a large literature on this topic which interested parties can consult.Some general empirical observations can be made.
On a cooling earth there is a steeper temperature gradient from the Tropics to the Poles. This produces instabilities with the jet stream swinging meridionally further south and north. Thus blocking high pressure systems develop with extremes of cold and heat and sharp temperature gradients between air masses with for example Sandy type blizzards or tornado swarms. A cooler world will be a generally drier world with increasing droughts globally and in e.g the USA corn belt and in the USA in general When combined with shorter growing seasons and possible early and late frosts this is likely to threaten world food production as population increases.
The PDO and SOI indices are the main ocean climate and weather indicators.Obviously ,for regional analyses at particular times, the phases of other ocean systems relative to the first two – for the U.S for example the AMO and NAO need to be considered. These are easily checked by looking from time to time at the work of the best climate and weather interpreters Joe D’Aleo and Joe Bastardi on http://www.icecap.us/
6.Summary of some Future Trends and Policy Suggestions.
The empirical observations highlighted in CAPITALS above indicate that the global warming temperature trend has peaked .The peak is broad with only a little cooling to date but this will likely accelerate from 2015 or 2016 on reflecting the beginning of the increase in the cosmic ray count already seen from 2004 – 2009 in Fig 6. The cooling will last until 2030- 2040. Often the signal for a climate direction change is a see saw effect between Arctic and Antarctic sea ice. The Arctic is still reflecting the peak in the warming trend with low summer ice values.
The first indication of a cooling event is however the increase in Antarctic sea ice which has already occurred.
This alters the oceanic deep water circulation patterns and spreads the cooling world wide. The Arctic ice will begin to catch up in a five years or so.
With a cooling world sea levels will stop rising and begin to fall as glaciers and ice caps begin to increase and the oceans compress with cooling.Eventually the rate of CO2 increase will slow and may even reverse even if human emissions continue to rise .
Because the error bars in our rough estimates of natural temperature variations are larger than any possible
Scarface says:
November 20, 2012 at 12:11 am
eco-geek says: (November 19, 2012 at 5:15 pm)
“It will be clear that the recent “good years” surpluses should have been preserved and stored for the decades of low food production which lie on our immediate horizon.”
The greens will one day be trialed for that, since they promoted to make biofuel of food.
________________________________________
We can only hope.
JimG says
the summer temperature graph looks sinusoidal to me,
Henry says
just look at the right graph
http://blogs.24.com/henryp/2012/10/02/best-sine-wave-fit-for-the-drop-in-global-maximum-temperatures/
after that toasting of Dr Leif. Svalgaard by Prof. Ilya Usoskin I was surprised to be the first to visit his site to at least check credentials.
Appeals to authority have no value, however the most dangerous appeal to authority is belief in one’s own infallibility.
Perhaps the strongest appeal to self-doubt was political and concerned the life of only one man. Our current crisis, hot or colder, and what could be the immediate effects leads me to say to Leif, Ilya, Michael, Phil, Christopher et al:
I beseech you, in the bowels of Christ, think it possible that you may be mistaken.
IanW says
As they watch the Mississippi glacier calving ice into the frozen wastes of the Gulf of Mexico, they will say “when this lot melts its going to get really really warm!”.
As I was saying;
http://wattsupwiththat.com/2008/03/16/you-ask-i-provide-november-2nd-1922-arctic-ocean-getting-warm-seals-vanish-and-icebergs-melt/
Sounds familiar?
count back 2012-88= 1924.
By 1945 all that ice lost was back.
it will happen again. Mark my words. In two decades from now, all the arctic ice losses reported will be back.
And from the BBC “Greenhouse gases hit record high”
http://www.bbc.co.uk/news/science-environment-20410942
But still Schmidt and Hansen claim that the Hansen/IPCC temperature models have succeded, even though they admit that Scenario A is not coming (at this point).
Cognitie dissonance did in the believers of Jim Jones. I hope when the warmists come to their existential crisis, they will realise that voting Republican is all the change that is necessary.
Ilya Usoskin says:
November 20, 2012 at 8:40 am
I have been pointed to this discussion by someone who got surprised by Leif Svalgaard’s claims on the drifts in Oulu NM data. I am the PI of the Oulu NM and am quite surprised that this issue, including direct cliams of my misqualification, are discussed here without contacting me first!
Oulu NM is regularly checked for the stabiity of electronics and counters and is regarded by experts as one of the most stable station of the world network. No aging is observed. Moroever, as Leif claims, Oulu is counting MORE cosmic ray than Thule, but this cannot be due to aging, unless this is aging of Thule. Aging can lead only to decreasing count rate!
Comparing Oulu to mid- and low-latitude stations is incorrect as the modulation during the cycle 23-24 is known to be more energy dependent than before. Moreover, Oulu data is totally consistent with most of the high-latitude stations (Apatity, McMurdo, Kerguelen, Terre-Adelia etc. – see http://www.nmdb.eu/nest/search.php ), except only two – Thule and even greater difference with the South Pole, the latter both showing a decreasing trend, absent in other stations. Moreover, McMurdo being counting even more than Oulu during the last years.
Thus, I consider Leif’s comments ungrounded and offensive as publicly discussed behind my back. I advice everyone to ask experts first if you think some data are wrong, not just claiming the data wrong because they don’t support someone’s idea.
Please don’t reply to me here, I am not reading this forum. If you have any questions, write to me directly (contact info is at http://cc.oulu.fi/~usoskin/ ).
Sincerely yours,
Ilya Usoskin
————————————————————————————————————————–
I’ll think Leif should clean his face and ask apology. Leif who is the one that makes cherrypiking? Seems that Ilya is bit angry. 🙂
There is already global cooling. The long term slight warming, and even the recent flat trend is the product of radical upwards adjustment.
D Böehm says: November 19, 2012 at 6:01 pm
The same mercury thermometers used for the past several centuries in compiling the Central England Temperature record show a steady warming trend, which has not accelerated in modern times.
_______________________________________
The same mercury thermometers used for the past several centuries in compiling the Central England Temperature record show a steady UHI** increase, which has not accelerated in modern times.
There, fixed that for you.
.
** UHI Urban Heat island effect. One of the three thermometers for the CET temperature series is based at Blackpool airport, the other is based just outside the engine run-up bays at Manchester International airport. Having stood on the ramp at Manch airport, I can tell you that those engines chuck out a lot of heat. And if you are only measuring a maximum, rather than an average for that day, one blast of hot exhaust will increase your ‘daily’ temperature reading.
.
.
Given the rate of accelerated rate of warmist madness, global cooling will be explained away by global warming models as increased volatility and nothing more. And with the steepness of the curve in warmist policy gambits this might be enough to wreck your personal finance and that of your country in smaller increments of time on the ridiculous curve. It’s a little bit like election calculus for minds and votes.
Doug Proctor says:
November 20, 2012 at 11:32 am
….I hope when the warmists come to their existential crisis, they will realise that voting Republican is all the change that is necessary.
________________________________
Make that a new independent party that does not have entrenched parasites and I would agree. The Repubs are as bad as the Democrats. Has either party bother to oust the banking cartel in the last 100 years? How many laws have been repealed? Bureaucracies shut down?
Olavi says:
November 20, 2012 at 11:57 am
I’ll think Leif should clean his face and ask apology. Leif who is the one that makes cherrypiking? Seems that Ilya is bit angry. 🙂
It is not a good idea to argue with angry people. There are only a handful of stations with very long records. The longest one is Climax. In this plot, I normalize several long-running stations to have the same mean as Climax [so they can be compared]: http://www.leif.org/research/Cosmic%20Ray%20Count%20for%20Different%20Stations-Oulu.png
Then I divide Oulu’s counts by the mean of all the other stations and plot them as the triangles. It is clear to me that there is an upward drift in the triangles and that Oulu therefore is not representative for the overall cosmic ray intensity [whatever the reason for the drift, be it instrumental or not] measured at the surface of the Earth [which is presumably what some people think has effect on climate]. BTW, one does not need permission to analyze data that is publically available.
It is possible that Oulu has seen more of the low-energy cosmic rays than other stations at mid-latitudes, but since the climate is supposed to be influenced by the high-energy cosmic rays, that possibility seems irrelevant.
It is instructive to use the site that Ilya linked to: http://www.nmdb.eu/nest/search.php to see for yourself what the variations at several stations have been.
I’ve been pondering the “No warming for 16 years” news for a few weeks now, and it causes me to revise my thinking on at least one subject. Since the late 90s I’ve wondered whether the increase in atmospheric CO2 was explainable simply in terms of sea surface temperatures. I’d always held out the idea that a warmer ocean would absorb less CO2 and that warming the ocean by even a fraction of a degree say, through solar activity, could explain a lot.
Since we are looking at sixteen years of no increase in SST, I have to reject this idea, or at least regard it with doubt.
I’ve always doubted that the amount of CO2 in the atmosphere was enough to explain any change in earth’s temperature. No reason here to stop doubting that idea.
Anthony, As always interesting and informative whilst simultaneously prompting “peer review”. However may I suggest you always incorporate a link to the credentials of the writer? Whilst you may know Dr. Page like a brother my Google efforts revealed little. With so much bullsh*t being published … it always helps if we newer and / or less well informed readers are more fully informed of the credentials.
The big question is how much and for how long.. The climate models say intervals of a decade can happen , but history shows these are more like 30-40 years I think the most probable blueprint for the next 20 -30 years for the globe is the past climate period from 1880-1910. The period had three low solar cycles , something like our current #24 which could be the first of three such low solar cycles in the immediate future as low cycles seem to cluster in threes.During that period the global SST anomaly dropped as did the global air temperatures when they bottomed around 1910 and the decade after. AMO went negative or cool in 1900 or about 17 years after the last solar maximum of solar cycle # 12.[1883] If the current pattern is similar , then AMO may go negative by 2000 plus about 15- 17 years or 2015 to 2017. The probability that AMO interval will be around 20 years is about 70%. It last changed in 1995 We could also see fewer climate changing strong El Ninos, perhaps only one per decade compared with 2 per decade during the warmer three decades of 1970 -2000. If these events do take place then global temperature anomalies could drop by about 0.4C and hover around 0.C at the trough period by 2030 . Regionally and inland areas could l see greater temperature drops.Winter temperature could drop by 5C in Northern inland areas. Winter temperatures have been flat or dropping in most areas of the Northern Hemisphere. Europe has seen no warming of winters for 20 years and dropping winter temperatures since 1998 and they have already seen some very severe winters during the last 4-5 years .Their winter cooling started after 2007. In Canada and US the winter temperatures have been flat or dropping if we discount the unusual winter of 2011/2012. I have found that past cycles never repeat exactly as the previous one but some elements are similar and give at least a clue of what may happen. One of these is that global temperatures never just rise but fluctuate and the cycle is clearly heading down . for the last two
Silver Ralph says:
November 20, 2012 at 12:05 pm
…….
Not much evidence that the UHI warmed the CE from 1690 to 1750
http://www.vukcevic.talktalk.net/CET1690-1960.htm
TRM says:
November 20, 2012 at 10:20 am
“GM seeds adapted to drought and cold should be developed.”
Hopefully ones that are actually safe and can pass Dr Pusztai’s tests and not end up in the fraud category “http://www.responsibletechnology.org/fraud”.
Genetically modified crops have been in use around the world since the mid-1990’s, the acres of deployment growing significantly every year. There is no evidence, repeat no, that genetically modified crops have caused any problems for human consumption, and for the environments in which they are used. Pusztai’s “research” has been roundly and soundly shown to be bogus.
Show me some bulletproof science that genetically modified crops are a problem. There is none yet to date after 16 years of use. WUWT is devoted to the furtherance of sound science – let’s not mess up the record with talking points on GM crops taken from the likes of Greenpeace and the Sierra Club.
TRM says:
November 20, 2012 at 10:20 am
“GM seeds adapted to drought and cold should be developed.”
Hopefully ones that are actually safe and can pass Dr Pusztai’s tests and not end up in the fraud category “http://www.responsibletechnology.org/fraud”.
Not trying to hijack the thread, but my first reply disappeared into the ether….No “awaiting moderation statement”
There is absolutely no evidence that the use of GM crops, growing worldwide every year since the mid-1990’s, causes any problems for human consumption and for the environment in which they are used. The “research” of Pusztai has been shown to be bogus, and has been widely discredited.
WUWT is devoted to sound science – let’s keep it that way, and leave the scare tactic talking points to the likes of Greenpeace and the Sierra Club.
OT, but the BOM Nino 3.4 SST index is currently 0.12 degrees and falling, for more than a week:
http://www.bom.gov.au/climate/enso/monitoring/nino3_4.png
The Nino 3 index has just fallen below zero:
http://www.bom.gov.au/climate/enso/indices.shtml
But the WUWT ENSO dial shows the value just increased from 0.5 to 0.7 degrees. Do we have a closet warmist controlling this dial?
Emigrate to Australia, unless China invades it first.
The Netherlands did better than most European countries during the LIA, their agricultural practices were ahead of every country, it took the French over a hundred years to catch up. We may cope as we have even better technology to aid us this time around, though there are some factors that will cause problems, a much larger proportion of people to land viable land area, and a just in time method of food production and delivery, these factors place us at heightened risk of setbacks in cases of late frosts, poor summers etc.
Thus ensuring that the atmosphere over the oceans picks up plenty of moisture which is then deposited over the cold continental interiors as snow, deepening the misery and cold.
Gail Combs says:
November 20, 2012 at 12:21 pm
Doug Proctor says:
November 20, 2012 at 11:32 am
….I hope when the warmists come to their existential crisis, they will realise that voting Republican is all the change that is necessary.
________________________________
Make that a new independent party that does not have entrenched parasites and I would agree. The Repubs are as bad as the Democrats. Has either party bother to oust the banking cartel in the last 100 years? How many laws have been repealed? Bureaucracies shut down?
Why should the governing class bust up a cartel they created deliberately? /rhetorical and this applies to OPEC too, in a manner of speaking.
The deewB dweeB C(o2 ) brainwashed zeros.
Laws of Nature ,Lazy Teenager,Monckton of Oz.
As I said above, the main point of the post was to point the way to the key data – you don’t have to believe my interpretation – I don’t think belief has much to do with science- dig down on the links and draw your own conclusions. Lazy Teenager I have no idea what.you are referring to re Morano – I’ve never written anything for him.
Monckton of Oz – I retired from the international oil exploration business about 10 years ago and find Climate Change an amusing topic of great scientific interest.I have no financial or professional standing incentives in the outcome of the Climate Wars one way or the other . I do have a PhD in geology but personally put little store on qualifications or appeals to authority – all that really counts is the data and some ability in critical judgement and logical argument eg it’s colder at night and cooler in the shade and winter is colder than summer. Common sense and the obvious will carry one quite a long way and should not be set aside except for very good reasons.I have about 50 years of experience in analysing and correlating time series of multiple variables which, at base ,is pretty much what exploration geologists do.It is often more an art than a science – you can believe me on that.
I don’t believe in global cooling. I hate the very idea of it. The shortened growing seasons and longer winters requiring the use of more energy to keep warm, thus higher expense, putting upwards pressure on energy prices, driving the cost of living higher. The ripple effects throughout humanity would be harmful, of course. Therefore, I choose to not believe in it, preferring the advantages we’ve enjoyed from the slight warming since the LIA to stick around at least a little while longer. Though, I must admit, it would be nice for the Children to know what snow is.
DR
I think a similar analysis was made by Lucia at The Blackboard on 4 Oct 2012. See
Arima11 Test: Reject AR4 Multi-Model Mean since 1980, 1995, 2001,2001,2003.