(Photo credits: NOAA)
By WUWT regular “Just The Facts”
Your help is needed in building the new WUWT “Extreme Weather” Reference Page. My recent article A Big Picture Look At “Earth’s Temperature” – “Extreme Weather” Update appears to have struck a cord with some of our Warmist friends, as I earned an “Extreme Denial” label from Tamino.
Apparently Tamino took issue with the fact that I only debunked the “Climate Change” = “Extreme Warming” meme from one angle, i.e. by showing that little if any warming has occurred over the last 15 years, thus claims that “Extreme Weather” has recently “arrived” and become “the new normal” are unfounded and erroneous. Tamino seemed disappointed that I had not attempted to debunk claims that there’s been a “dramatic increase in weather-related catastrophes”. He offered in support of this claim, an insurance company’s marketing materials and 3 charts (1, 2, 3) from the United States, which represents less than 2% of Earth’s surface area. Not particularly compelling.
I will address Tamino’s charts in further detail below, but the first order of business is to see if we can figure out whether there has been a “dramatic increase in weather-related catastrophes” and “Extreme Weather”. As such, I’ve created the WUWT “Extreme Weather” Reference Page and populated it with all of the credible 3rd party data on weather extremes that I am aware of. I am sure there’s more. Please post links to any credible data sources on weather extremes below or in comments of the WUWT “Extreme Weather” Reference Page, and we’ll review them for inclusion on the “Extreme Weather” reference page.
The credible global weather extremes charts I have found thus far are as follows:
Tropical Cyclones
Global Tropical Cyclone Accumulated Cyclone Energy (ACE)y – 1971 to Present

Global Tropical Cyclone Frequency- 1971 to Present

Global Hurricane Frequency – 1978 to Present

Precipitation/Drought
Global Precipitation

Global Palmer Drought Severity Index (PDSI)

Tornadoes
US Strong to Violent Tornadoes (EF3-EF5) – 1950 to Present chart;

is also significant as “Tornado researcher Tom Grazulis estimates that about 75 percent of the world’s tornadoes occur in the United States.” Chicago Tribune However, this may be misleading in that “many countries do not keep records of their tornadoes. The actual number of tornadoes outside the U.S. is not known.” Answers.com
If you are aware of any other global or semi-global weather extremes charts from credible data sources, please post them in comments.
Returning to the charts that Tamino thinks I am in “Extreme Denial” of, the first chart Tamino offers is from the marketing materials of German Insurer Munich RE:
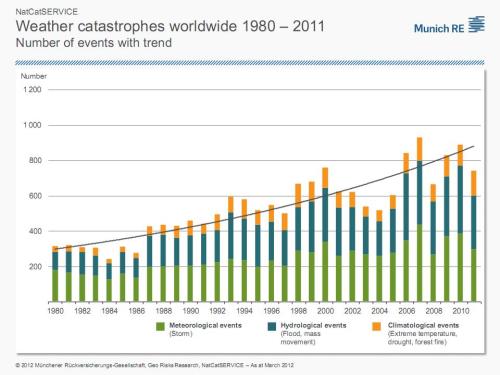
Munich RE is “one of the world’s leading reinsurers” “with income from reinsurance premiums alone at nearly €26.5bn (2011)”. Their “What we do” section begins with, “What happens if the sea level rises by one metre? How do offshore wind farms affect risks in the shipping business?” Furthermore, if you look at this Munich RE marketing press release from November 11, 2011, you’ll see that they have a clear financial interest in marketing and promoting the “Extreme Weather” meme:
Over the last 30 years, Asia Pacific has experienced more than 50% of all fatalities from natural catastrophes, almost 40% of all economic losses but less than 9% of the insured losses.
This shows the urgent need for wider natural catastrophe insurance coverage. This can be met through a variety of measures, from traditional insurance and reinsurance, to public-private partnerships or pooling of natural catastrophe risks nationwide.
Munich Re has the expertise and experience, and is discussing natural catastrophe schemes with governments all over Asia. The support can be twofold: on the one hand, driving the discussion in greatly exposed economies to structure country-wide solutions; on the other, finding solutions for governmental infrastructure assets such as roads and bridges. Munich RE
Clearly Munich RE has a significant financial interest in “discussing natural catastrophe schemes with governments”, thus it’s marketing materials cannot be considered a credible source for unbiased scientific data. It would be akin to a skeptic posting a temperature chart from Exxon Mobil, laughable.
This Federal Emergency Management Agency (FEMA) Disasters Declared chart is the second undeniable plot Tamino posted:

However, it appears more indicative of changes to the “disaster declaration” criteria versus a change in weather extremes, i.e.:
“FEMA was established under the 1978 Reorganization Plan No. 3, and activated April 1, 1979, by President Jimmy Carter in his Executive Order 12127″ Wikipedia.
“A review of data for a seven-year period from 1988 to 1995 reveals that large expenditures, as funded by supplemental bills, relate to declarations issued for the largest events. During this time period, disaster declarations were made for Hurricane Hugo, the Loma Prieta earthquake, Hurricane Andrew, the Midwest floods of 1993, and the Northridge earthquake. However, these were not the only events deemed worthy of presidential action and of cost to the federal treasury.”
“But like the tail of a comet, over 200 other declarations accounted for one quarter of such outlays, many of them of relatively minute cost and extent. While of lesser impact on the national treasury, such “low end” declarations have become, to some observers, new sources of federal spending at the local level, long referred to in other contexts as “pork barrel spending.” Congressional Research Service
“In 1996, the agency was elevated to cabinet rank.” which correlates well with the spike in Disasters Declared in the second half of the 1990s. Furthermore, if you look at this 2011 FEMA list of 99 “Major Disasters” versus these lists from 1958 and 1959 with 7 “Major Disasters” each, it seems apparent that the FEMA data is biased by changes in disaster declaration criteria, e.g. “events deemed worthy of presidential action and of cost to the federal treasury”. As such the FEMA Disaster Declaration data is not a credible proxy for “Extreme Weather”.
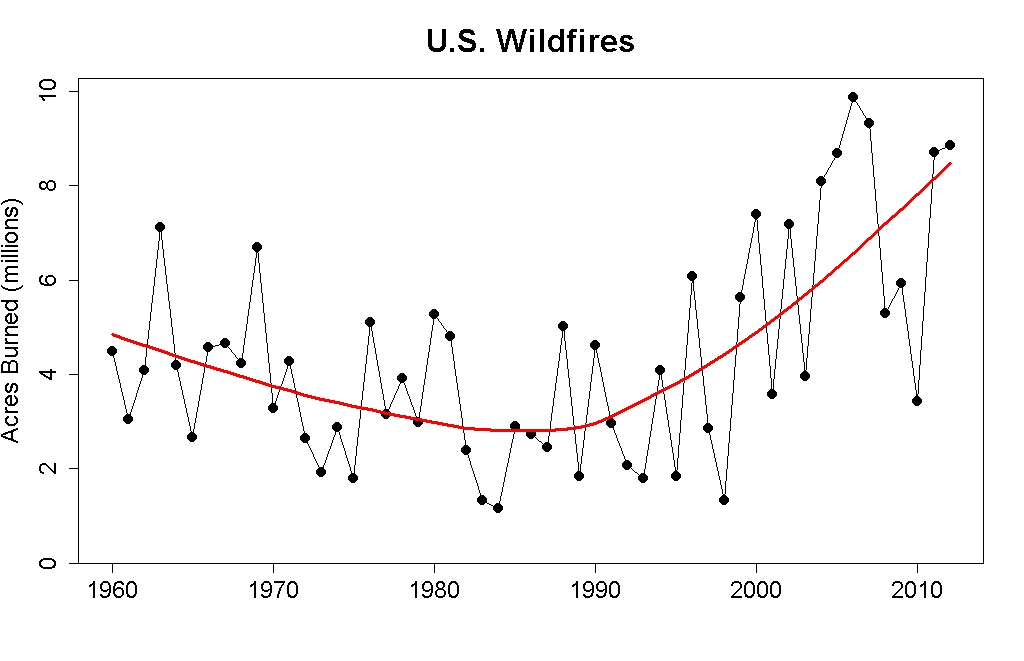
Third Tamino’s posted this US Wildfire chart;

however, it only shows Acres Burned, whereas the following chart shows the US Acres Per Wildfire and the Number of Wildfires Per Year:

This is an important distinction as the associated article elaborates:
This graph shows the inverse relationship between numbers and sizes of US wildfires over time. Note the greater number and smaller sizes of fires between the creation of Wilderness in 1964 and the beginning of the modern wildfire era in 1987 and 1988 (with Silver Complex and Yellowstone fires of those years), as compared with the smaller number and greater size of recent fires. One factor may be the shift in USFS policy from rapid suppression to “let it burn,” which has allowed for numerous smaller fires – previously extinguished individually — to coalesce into larger fires and singular complexes.Evergreen
For reference;
“Forest managers agree that the current fire risk is primarily a combination of two factors — higher-than-average temperatures and a profusion of fuel, the product of nearly a century of fire suppression policies.”
“Recognizing widespread overgrowth in American forests, in the late 1970s the Forest Service began reintroducing policies of prescribed burning and allowed many smaller, natural fires to burn out on their own, provided they didn’t threaten lives or property. The decision this summer to attack all fires, while not a direct reversal of this policy, does represent a departure from that practice of natural restoration, said Jennifer Jones, a public affairs specialist with the Forest Service. Scientific America
The shift in thinking was formalized in a 1995 statement of federal fire policy, and strengthened in a 2001 revision. The policy recognizes that fire is “an essential ecological process,” and that decades of trying to keep fires from burning have led, ironically, to “larger and more severe” conflagrations because of the buildup of underbrush and other fuel. USA Today
As such, US Forest Fire data is biased by “nearly a century of fire suppression policies” and “the shift in USFS policy from rapid suppression to ‘let it burn,'”, which begin “in the late 1970s”, “was formalized in a 1995 statement of federal fire policy, and strengthened in a 2001 revision.” US Forest Fire data is not a credible proxy for “Extreme Weather.”
Finally, Tamino offers this NOAA Extremes in 1-Day Precipitation chart;

which is relevant, but it is only illustrates the “Contiguous U.S.”, which is just “1.58% of the total surface area of the Earth” and the chart ends in 2011. Fortunately, this NOAA Extremes in 1-Day Precipitation – 1910 to Present – Year to Date chart;

shows the full US, which is at least closer to 2% of Earth’s surface area, whatever that means, and the chart is current through October 2012, so it shows the drop in Extremes in 1-Day Precipitation that has occurred during 2012. This Extremes in 1-Day Precipitation chart was one of a number US climate extreme charts that were already included in the WUWT US Climatic History Reference Page, which I’ve now added, along with an array of other US centric weather extreme charts, to the WUWT “Extreme Weather” Reference Page
Tamino didn’t do so well supporting claims that there’s been a “dramatic increase in weather-related catastrophes”, “Extreme Weather” has “arrived” and is now the “new normal”. Perhaps you can do better? Please post all credible charts on weather extremes in comments and we will review for inclusion on the WUWT “Extreme Weather” Reference Page. Thank you in advance for your assistance.
Please note that WUWT cannot vouch for the accuracy of the data/graphics within this article, nor influence the format or form of any of the graphics, as they are all linked from third party sources and WUWT is simply an aggregator. You can view each graphic at its source by simply clicking on it.
 wpDiscuz