By Rud Istvan
This post was motivated by May’s second here on paleoclimate, by comments to Bradley Jr’s climate models repost from AIER, and my previous posts and comments about climate models and equivalent (observational) or equilibrium (modeled) climate sensitivity (aka ECS). All are hyperlinked below. This post summarizes some of the most important climate basics at a simple high level, while pulling together the myriad underlying specifics via linked references to a lot of stuff posted at WUWT over the years. Hopefully this is helpful at both levels for the many newer WUWT commenters. It also indirectly takes scientific aim at some of the extreme skeptics who also comment here, like those who deny that the greenhouse effect exists, or that ECS cannot be significantly positive.
First, the green house effect (GHE) is real although often misunderstood. Unlike a real greenhouse (which works by inhibiting surface convective cooling), the GHE works by inhibiting radiative cooling in the troposphere. “Greenhouse” gases (GHG) absorb and omni-directionally re-emit infrared radiation (IR), inhibiting (retarding) cooling IR escape to space. Greenhouse gasses (so also their ‘backradiation’) cannot warm—incoming insolation is solely responsible for that. But as first shown experimentally by Tyndall in 1859, GHG can inhibit radiative cooling. The level in the troposphere where the GHE ceases to be a factor is called the effective radiating level (ERL). The ERL is also why the GHE can never saturate. More GHG just raises ERL, meaning the ERL emission temperature is cooler so less efficient thanks to the troposphere temperature lapse rate. Which is why Guy Callendar realized in his 1938 paper that increasing CO2 has a decreasing logarithmic effect. For what follows, that also means that whatever the ECS per CO2 doubling might be, it remains about constant over a much broader concentration range.
Second, the notion that there must be some positive ECS to doubled CO2 is logically valid. Given steady insolation heating but reduced offsetting radiative cooling, Earth’s surface temperature must rise until the resulting increase in IR offsets the GHE so that TOA radiation ‘equilibrium’ is re-established. ECS can be established two basic ways. First is by problematic climate models that predicted about 3C in AR4 (CMIP3), about 3.4C in AR5 (CMIP5), and now about 3.7-4.5C in upcoming AR6 (CMIP6, specifics follow). Second is via various observational methods all suggesting about 1.7C. This 2x discrepancy was so great that AR5 explicitly declined to provide a central ECS estimate because of it.
Third, the climate models ARE problematic for an inescapable reason. Thanks to computational intractability of important climate phenomena size scales (e.g. Willis Eschenbach’s many TStorm posts here), they are forced to parameterize. Parameterization drags in the attribution problem, both on long time scales as Andy May just showed, and on short time scales of just the past century. Attribution very simply is how much of the observed past temperature change was natural, and how much was CO2 ‘forcing’. IPCC assumes (by charter!) all forcing, ignoring natural variability. MBH 1999 attempted to remove millennial time scale natural variability (erroneously) via its infamous hockey stick handle—erasing the historically well documented but only natural MWP.
Now we have coming soon for AR6 the newest and ‘best’ CMIP6 climate models. While their results are not yet finalized, it is already apparent that the climatariat and reality continue to diverge. The interim CMIIP6 ECS results are as follows.

The high ECS from the 40 reported models is 5.6C, the low is 1.8C (INM CM5, the Russian model close to observational methods). The mean is now 4.5 (yellow/blue), very far from observational methods. The median has risen to 3.7C. So, CMIP6 has significantly INCREASED ECS uncertainty (the opposite of what ongoing science is supposed to do), while further raising its modeled central tendencies ( now at greater variance from the observations that caused AR5 heartburn). As the text around the linked carbonbrief.org graphic above shows, the warmunists there find this both plausible, and cause for mild celebration!?!
It is apparent that those who believe in anthropogenic global warming do not understand the intractable fundamental problem with their climate model approach. They are digging themselves a deeper hole. The Army’s first rule of holes is, when in one and wanting out, first stop digging.
Or to paraphrase a very famous Feynman lecture summation:
‘It does not matter how beautiful your theory is. If it disagrees with observations (experiments based on the theory), IT IS WRONG.’
Rud. Two obervations.
1. If there was no lapse rate, there would be no GHE. ECS would be zero.
2. Convection will create a lapse rate wirhiut any GHG.
Consider a planet scals solar powered heat pump. The low pressure cold coils are in the upper atmosphere. The high pressure hot coils are at the surface. A planet scale solat panel drives the compressor pump.
This will cool the upper atmosphere and warm the surface, creating a lapse rate. Exactly as seem on earth.
The sun drives the compressor pump through a process called convection. Gravity takes the place of thwe high low pressure orifice found in a heat pump, by restricting the flow of air from the hot side to the cold.
You can’t attribute human causes with climate models because climate models are not physical representations of the actual climate. They’re just toys, in the same way that someone’s model of the economy is not a representation of reality.
Speaking of Chimps;
What did Tarzan say when he saw the Chimps eating all his chocolate chip cookies?
“Chimps ahoy”!
Hi Rud,
I think you have a typo. INM-CM5’s sensitivity is 1.9 degC. INM-CM4.8 has the lowest one at 1.8 degC.-Volodin (who heads the group) wrote a paper a few years ago that seemed to apologize for the fact that his ECS was so low, and yet somehow version 4.8 got even cooler.
The INM’s are cold because their deep ocean heat capacity is about double what’s in the other models, but I am surprised that when they sent out the “new, improved” CM4.8 and CM5 that the results were similar but slightly slower to warm than CM4.
Any ideas on what’s going on here?
Pat M.
Thank you for the excellent update. I have enjoyed using this graph from IPCC AR5 (2014) to illustrate how badly the CMIP models overestimate warming. I hope they include a similar one in AR6. It’s fun to use their own findings to debunk their hyperbole.
I also like pointing out that warming trends projected by their various Representative Concentration Pathways (RCP) scenarios are vastly overstated and the one most used by every published study prophesying an imminent apocalypse, RCP8.5, which assumes no drastic, concerted global effort to curb CO2 emissions (which is what’s actually happening) is 2 to 3 times higher than measured temperature and sea level trends. Even more fun, the measured trends show that the least scary RCP2.6 scenario is the likeliest; the one where global CO2 emissions stop increasing (looking at you China, India, and every developing country in Asia, Africa, and Latin America) and start to decline slightly by 2040, which is improbable.
RCP8.5 warming by 2100: 2.6 to 4.8 C, mean of 3.2 C
RCP2.6 warming by 2100: 0.3 to 1.7 C, mean of 1 C
Measured trend (UAH temp): 1.4 C
RCP8.5 sea level by 2100: 0.45 to 0.82 meters, mean of 0.63 m
RCP2.6 sea level by 2100: 0.26 to 0.55 meters, mean of 0.40 m
Measured trend (satellite): 0.33 meters
Tide gauges show a lower trend than satellites for sea level rise.
The logical implication? The contribution of CO2 to warming is far lower than the climate models estimate.
stinkerp
“I have enjoyed using this graph from IPCC AR5 (2014) to illustrate how badly the CMIP models overestimate warming”
Just thought I’d bring your graph up to date …..
http://blogs.reading.ac.uk/climate-lab-book/files/2021/01/fig-nearterm_all_UPDATE_2020-panela.png
To second Anthony Banton, why do you “enjoy” using data that ends in 2011? That’s 10 years ago. It’s 2021; so now we have whole-year data up to and including 2020. Ed Hawkins gets credit for updating that chart with up to date data. Enjoy!
“It’s fun to use their own findings to debunk their hyperbole.”
“Enjoying” the irony?
The head post here talks about “Effective Radiating Level”, then the conclusion that “increasing CO2 has a decreasing logarithmic effect”. This is a conclusion that almost everyone seems to accept, it would be silly to question it, however if you take it quite literally it leads to a logical contradiction. If an increase of temperature is attached to every doubling of CO2, shouldn’t the same decrease be attached to every halving? If you continue on a downward trend like that, you would have to say that zero CO2 assumed should imply a *negative infinite* temperature, something fishy there!
My serious point here is that the logarithmic thing can’t actually be literally correct, it can only be some kind of approximation, or rule of thumb. Given that, who knows where the approximation really breaks down? If we really could take all the CO2 out of the atmosphere, say, maybe water vapor would pick up the slack with hardly any cooling at all — H2O is a powerful greenhouse gas, you know! In that scenario, the ability of the upper atmosphere to shed heat might even be compromised just a bit, with the result being, again, hardly any cooling?
It also indirectly takes scientific aim at some of the extreme skeptics who also comment here, like those who deny that the greenhouse effect exists, or that ECS cannot be significantly positive.
Rud you said your article ‘takes aim at some…”, then you basically called those of us who think otherwise extremists. Why do you think it is necessary to use such loaded language?
That is the language of consensus groupthink enforcement.
I acknowledge the GHG effect but not a climate-changing role for it simply because CO2 changes follow ocean temperature changes and the amount of atm CO2 is so small.
The proper metric instead of ‘ECS of CO2’ is sensitivity of CO2 to temperature changes.
Changes in CO2 are relative to the growth in the size and temperature of the ocean above ~25.6ºC over time, due to outgassing re Henry’s Law of Solubility of Gases.
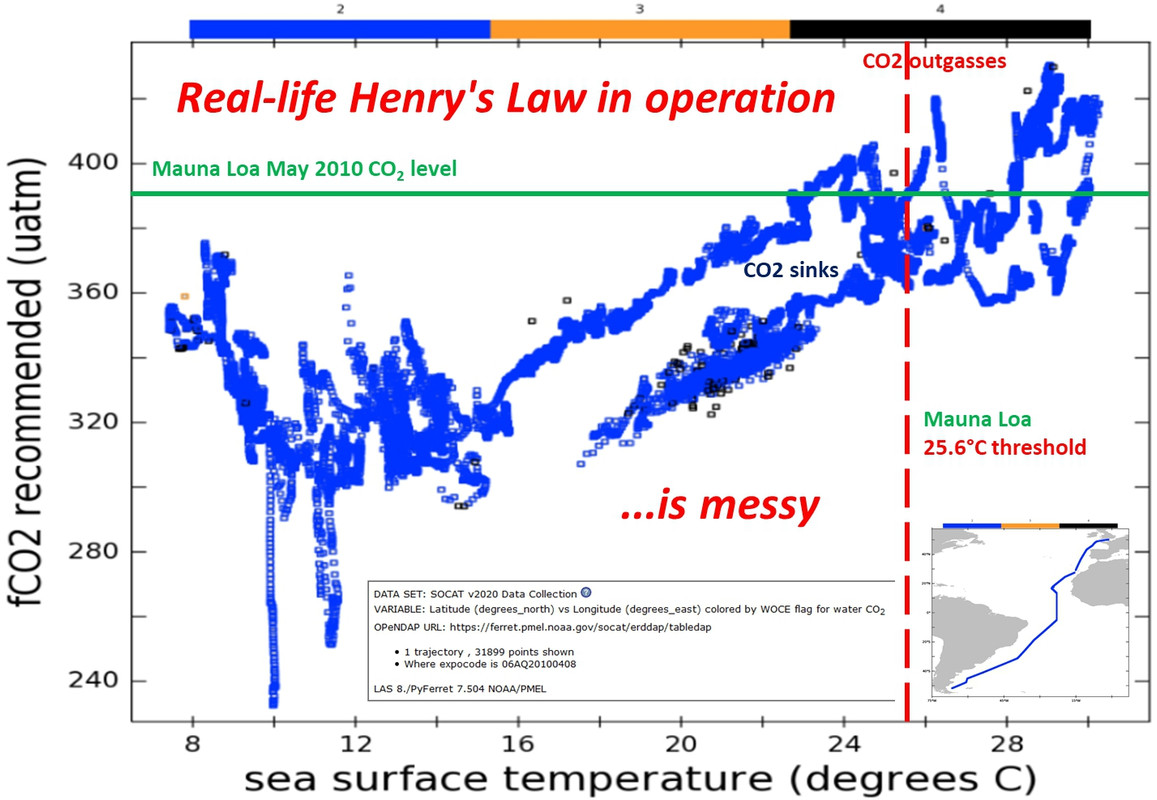
It is simple to ascertain a positive CO2 sensitivity to temperature changes. In the following example the 12month change in Mauna Loa CO2 significantly follows HadSST3 by 10 months, with a sensitivity of 2.34ppm/ºC:
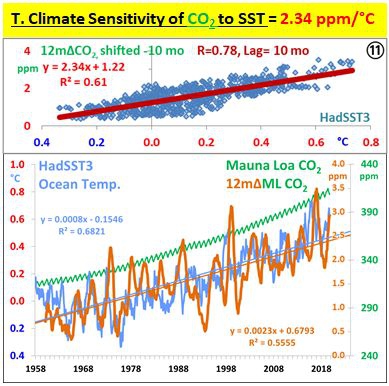
Clearly the ocean is driving the atmospheric temperature too:
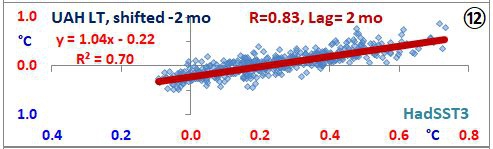
It follows that the ECS of CO2 is unreal, definitely not ‘significantly positive’ because CO2 isn’t driving the ocean temperature, rather it’s the other way around.
Why should I accept any other interpretation?
Man adds CO2 to the atmosphere. Nature takes out about half of Man’s contribution. The atmospheric concentration of CO2 increases accordingly.
CO2 is a radiatively active gas (GHG). Increases in GHG in the Earth’s atmosphere will tend to warm the atmosphere. We don’t know by how much a particular increase in CO2 concentrations will warm the atmosphere because the massive energy flows throughout the atmosphere obscure the relatively small impacts of minor GHG changes.
Using historical observations and a number of assumptions, the best current estimate of CO2 ECS is about 1.7. UN IPCC CliSciFi GCMs have no valid bases for the derivation of their ECS estimates, evidence a CMIP6 range of 5.6 to 1.8.
Anybody that disagrees with the thrust of the above has their head up their ass.
Dave Fair posted: “Increases in GHG in the Earth’s atmosphere will tend to warm the atmosphere.”
That statement is commonly made, and just as commonly is an unsubstantiated, illogical assertion.
Many physical processes (such a salt dissolving in a limited quantity of fresh water) are known to approach asymptotic limits. Such appears currently to be the case with CO2 according to W. A. van Wijngaarden and W. Happer [2020], Dependence of Earth’s Thermal Radiation on Five Most Abundant Greenhouse Gases, free download available at https://arxiv.org/abs/2006.03098
According to these well-respected physicists, doubling the current concentration of CO2 increases its feedback forcing by only a few percent.
The lack of inclusion of this asymptotic limit by almost all (all?) of the climate models used to establish CMIP-x ECS values and associated future projections for global warming is the fundamental reason they depart from reality in temperature projections and in their calculations of ECS values.
In addition, the van Wijngaarden and Happer CO2-is-near-total-saturation-at-420-ppm assertion gives us an excellent explanation for why Earth did not experience “runaway” greenhouse warming, and thus the extinction of all life, when Earth previously experienced CO2 levels 8 to 15 times higher than today’s level.
BTW, I can see the light clearly.
Great link especially Fig 4 .
Layman lurker here. I believe this is a phenomenon that needs to be cited more often to counteract the intense efforts by media to scare people. Many people presume that there are positive feedback traps waiting around every corner: increase the average .5 degrees and suddenly whoops it jumps up to 3 because the Gulf Stream stopped or something. This is what allows people to believe it when they are told that in X years, it will be “too late” to reverse climate change.
Providing evidence that almost all feedback loops in nature are negative rather than positive is critically important. The science as currently argued is not adequately targeted at the probability or improbability of encountering positive feedback loops. But the simple truth that Earth has naturally moderated itself from much higher CO2 concentrations, should be evidence enough. Thank you for providing it.
When my better half is weighed at the doctor’s office she removes her watch and glasses. She correctly thinks these add to her apparent weight. Of course the watch and glasses weigh less than 1 pound but could be enough to increase her recorded weight by 1 pound when recorded in whole pounds. But that does not mean that the watch and glasses cause a 1 pound change. But the data available cannot tell us just how much these items actually weigh. Even if the weighing was done twice – with and without the watch and glasses – we would not be able to determine their weight based on a scale with 1 pound resolution as the difference would be either 0 or 1 pound.
We do know that CO2 concentration increase will result in some change in atmospheric cooling rate and hence must result in some level of temperature increase. But we also know that there are many potential feed backs that would affect the amount of warming. The net feedback could well be negative and thus minimize the warming. I would submit that we simply cannot measure atmospheric temperature with anywhere near the resolution that would be required to determine the ECS.
Computer models are useless in resolving this issue. By definition they include some calculation that affects the projected temperature change based on change in CO2 concentration. The size of the change depends on the modelers choice of factors used in the calculation.
Thank you, Rick. A much better (and kinder) discussion than mine.
Rud,
Unless I am mistaken ECS includes feedback from H2O. It is not clear if you are criticizing those who “deny” CO2 without-feedback has positive ECS or you are including those who “deny” CO2 with-feedback has positive ECS. Since clouds and water vapor are poorly understood, it is also not clear on what basis anyone can claim with certainty that the feedback effect of CO2 is positive or negative. My understanding is that knowing the effects of water feedback is necessary to understanding CO2 as a greenhouse gas; water vapor feedback is the missing link.
Since CO2 is a nonlinear greenhouse gas, isn’t the effect of doubling CO2 a function of where you start? In his Hillsdale speech Dr. Happer claims that CO2 is effectively saturated as a greenhouse gas (28:55 into his speech). He says the effect is approximately 1% or 3w/m2. This appears to be without feedback.
Is any science more unsettled than climate “science”? I read a lot of science in magazines and books including college texts for courses I never took- but I buy or borrow them anyway. I see little debate and argument in other sciences. Conclusion: no need to spend trillions to attempt to solve a problem not yet proven. As for warming- it’s suppossed to be about 80 F today in central MA, but it’s barely 70, cold and damp. I wish they got it right.
The big problem is the models are designing to show global warming. Period. Models that don’t show global warming are discarded.
Beyond that, nobody can show the climate works the way the models posit. It takes willful ignorance to keep believing the models when the results don’t match the real world.
I think that those of you who believe that the accepted greenhouse gas physics are wrong simply need to go into the lab and demonstrate by experimental observation and measurement that it is wrong. Please let us know when you have done that experiment.
Here’s one example:
https://www.researchgate.net/publication/340692292_The_Influence_of_IR_Absorption_and_Backscatter_Radiation_from_CO2_on_Air_Temperature_during_Heating_in_a_Simulated_EarthAtmosphere_Experiment
The simple scalar solution to… reduction of what is a complex (characterization and diversity), and, in fact, chaotic, problem (i.e. energy, matter, and heat interaction, transmutation, transport, and auditing) is reminiscent of the search for the “prime” prime algorithm, and separately the calculation of how many licks does it take to get to the Tootsie roll center of a Tootsie pop? One, two… crunch.
David Blenkinsop (below) has a great point in the comments.
Rud Istvan claims that “Guy Callendar realized in his 1938 paper that increasing CO2 has a decreasing logarithmic effect.”, whereby every doubling of CO2 concentration would result in the same increase in atmospheric temperature, called the “Equilibrium Climate Sensitivity”, or ECS.
But there are several fundamental problems with this theory, sometimes known as the Arrhenius equation, used by the IPCC. If the Arrhenius equation were rigorously true, then if all the CO2 were somehow removed from the atmosphere, then the atmospheric temperature would go to negative infinity, which is physically impossible, since the minimum possible temperature for anything is zero degrees Kelvin. In reality, if all the CO2 were removed from the atmosphere, the effect of CO2 on the atmosphere would go to zero, but any warming effect due to water vapor would still be in effect, resulting in an equilibrium temperature above zero degrees Celsius.
Although Guy Callendar’s paper is behind a paywall, even the freely readable abstract contains some errors. Callendar claims that, as of 1938, three quarters of the CO2 emissions from burning fossil fuels remains in the atmosphere, after 150,000 million tons were emitted in the previous 50 years. That would be an average of 3 gigatons (GT) per year.
In recent years, human CO2 emissions have increased to about 35 GT/yr. If all the CO2 remained in the atmosphere, that should cause the concentration to increase at the rate of 4.4 ppm/year (by a mass balance over the atmosphere). But actual concentrations at Mauna Loa are increasing at a rate of about 2 ppm/yr, meaning that only about 45% of human CO2 emissions remain in the atmosphere, as compared to 75% claimed by Guy Callendar. If Callendar could make such a large error in the fraction of CO2 retained in the atmosphere, what other errors are in his analysis?
Rud Istvan also writes that “Greenhouse gases (GHG) absorb and omni-directionally re-emit infrared radiation (IR), inhibiting (retarding) cooling IR escape to space”.
This is not entirely true. If a CO2 or water vapor molecule absorbs an IR photon, the energy of its electrons increases. It can then either re-emit the photon “omni-directionally” (of which about half the photons are aimed toward the earth, and half toward space), OR the added energy can be transmitted as kinetic energy to a neighboring non-radiative molecule such as nitrogen or oxygen, in which case the temperature of the air increases.
By the law of conservation of energy, a GHG molecule can either re-emit the photon (in which case there is no increase in temperature) OR increase the kinetic energy and increase the air temperature, but it cannot do both. About half the absorbed and re-emitted photons can eventually reach the Earth’s surface and warm the surface (solid ground or liquid water), but only the absorbed and non-re-emitted photons can warm the atmosphere.
But solid ground and liquid water have very high specific heats per unit volume compared to air. The photons that are absorbed and re-emitted toward the earth cannot increase the surface temperature by much, compared to solar radiation. The photons that are absorbed and not re-emitted in can have a greater effect on the temperature of the atmosphere.
Rud Istvan claims that “The ERL is also why the GHE can never saturate. More GHG just raises ERL, meaning the ERL emission temperature is cooler so less efficient thanks to the troposphere temperature lapse rate.”
At a given surface temperature, there is a limited number (intensity) of IR photons in the wavelengths absorbed by CO2 emitted by the earth’s surface. Some of these photons never collide with a GHG molecule and are emitted to space. Some of them are absorbed, and a certain fraction raise the temperature of the nearby atmosphere, and of the remainder, some of them are re-emitted upward, some are re-emitted downward.
If the concentration of CO2 in the atmosphere were doubled, then (according to Beer’s Law) the altitude required for the same number of photons (of wavelengths absorbed by CO2) to be absorbed would be halved, meaning that the ERL would be lower in the atmosphere (not higher), and the temperature of the ERL would increase, not decrease, and the emission toward space would increase, not decrease. The “greenhouse effect” CAN saturate, and would tend toward a limiting maximum asymptote for which all the photons of an IR-absorbing wavelength are absorbed.
Also, the “effective radiating level” (ERL) is likely fictitious, because the altitude at which IR photons are no longer absorbed varies with wavelength, and also with water vapor concentration, which is highly variable.
Even at a constant concentration (in mole fraction), the number of absorbing molecules per unit volume is proportional to P/T (absolute pressure / absolute temperature) by the ideal-gas law, and this ratio decreases rapidly with increasing altitude. This means that any IR absorption also decreases with altitude. There is no single altitude at which IR absorption suddenly becomes negligible–the IR absorption rate decreases gradually and “fades out” with increasing altitude.
I’m not sure how to assess some of the points you raise, myself, but that last point about the rapidly decreasing density of atmosphere with height does seem to suggest that there would be fewer molecules to emit both ways, up and down, at higher altitudes. So you raise the ERL, it’s harder than you might think to keep the earth cool, this fits with standard theory then, or do conventional theories even care about the number of molecules?
Rud, thank you for this post and for all your contributions against the unjustified alarm over CO2. Yours is a voice of reason, clearly expressed. Still, I don’t see why ECS must logically be a significantly positive value. I don’t self-identify as extreme on this point. I appreciate Spencer, Lindzen, Curry, and others for their views and their integrity.
Still, it deserves consideration that the total energy in the atmosphere above any point on the surface is a huge quantity, and varies widely and rapidly. Perhaps you have seen this plot I have posted in comments before, but I’ll put it here again. The point being illustrated is that 3.7 Watt-hours per hour per square meter, acknowledged as the direct static warming effect of a doubling of CO2 from pre-industrial times, is vanishingly thin in the vertical scale. These hourly time series values are the “vertical integral of total energy” from the ECMWF’s ERA5 reanalysis product for all of 2019 for a gridpoint near where I live. I have expressed the vertical scale in Watt-hours per square meter. The large changes in total energy in both directions over short time periods will completely blur whatever happens with the 3.7 W/m^2 incremental improvement in the radiative coupling of the lower atmosphere to the surface.
 ?dl=0
?dl=0
So I have commented here at WUWT several times that I don’t see how ECS can ever be reliably differentiated from 0C. Sure, the numbers work out, as you say, for the estimates of ECS derived from temperature records, assuming CO2 is the cause of the warming. But the warming could also be entirely natural, and one would never know the difference. Time will tell.
You mention Callendar in this post. I refer to the record of Sir George Simpson’s points in the “Discussion” of Callendar’s 1938 paper, at page 15 of this pdf. Those points make good sense to me.
https://www.rmets.org/sites/default/files/qjcallender38.pdf
Again, I write this with great appreciation for your posts.
Thanks for the link. I just scrolled to the bottom of that PDF (Callendar’s paper), to read George Simpson’s rather concise criticisms and/or questions? I don’t know whether to laugh or cry, Simpson sounds just like today’s climate skeptics, and it is far from clear whether Simpson or anyone else ever got anything like a satisfactory answer.
I appreciate your reply. 83 years later, as you say, there is still the same tension. One sees the static radiative concept as dominant; another sees the dynamic motion of the atmosphere, with all its energy implications, as equally compelling and necessary to grasp. In a nearby reply, you wonder about the high-altitude aspects of radiative emission/absorption. Have you explored the online interactive Modtran website? http://climatemodels.uchicago.edu/modtran/
What ERA5 field has been vertically integrated here?
It is this parameter, converted from Jm**-2 to Whm**-2.
https://apps.ecmwf.int/codes/grib/param-db?id=162063
From this list
https://confluence.ecmwf.int/display/CKB/ERA5%3A+data+documentation#ERA5:datadocumentation-Parameterlistings
Got it, thanks. I think this puts into perspective just how much energy 3.7 W/m2 of an EEI puts into the climate system compared to the total energy in the atmosphere. The total RF from 1960 to 2020 is about 2 W/m2 with 0.8 W/m2 of an imbalance remaining. That means about 1.2 W/m2 has equilibrated with a total energy accumulation of 350e21 joules. That is 190,000 W-hours/m2. Triple that and you have 570,000 W-hours/m2. That is a significant portion of the total energy contained with the atmosphere. 3.7 W/m2 of an EEI even with a decay curve of a few decades adds up.
Thank you for your reply. Rather than assuming the incremental static warming effect must accumulate, I see it as disappearing into the huge reservoir from which a highly active variable emitter is supplied. Please see my comment on another post recently, linked here.
https://wattsupwiththat.com/2021/06/22/serious-error-of-physics-in-recent-grl-paper-loeb-et-al-on-earths-unprecedented-heat-retention/#comment-3274852
In other words, if you assume the incremental warming effect must end up trapped, of course it will calculate out as you suggest. But if one puts more emphasis on how the atmosphere works as a heat engine, it need not accumulate. Additional CO2 supplies no additional energy of its own.
Good article.
Rud Istvan, Willis Eschenbach and Andy May articles are always must reads for me,
along with every comment that follows.
My comments are more generic than most of the science comments here.
I will state them as questions that need answers.
The final words will be my own answers.
Two assumptions:
(1) Computer models “project” whatever their owners/programmers want projected.
(2) The average climate model projection represents a “consensus” of the scientists who own and program the computers.
My first question is:
“Do I trust those scientists?”.
My second question is:
“Does the model that makes the most accurate projections get the most attention?
My third question is:
“Does the average of model projections get more accurate over time?”
My last question is:
“Is there any indication that accurate temperature projections are the primary goal of the models?”
My own answers:
These are climate computer games, not models of climate change on this planet.
Accurate projections are not a goal.
Scaring people about an imaginary coming global warming crisis is the primary goal
(political, not scientific).
Complex computer games impress people more than just having government bureaucrat scientists waving their arms and predicting climate doom. The computer games are props to support a scary climate change fairy tale.
Concerning the CIMP6 ECS chart with the article.
– It’s often claimed climate science is settled, yet the ECS numbers have a HUGE range !
My guess is they are all too high.
– Thanks to earning a BS degree, I am skilled at detecting BS
The climate computer games are BS.
Due Diligence:
I live in Michigan, love global warming, and want a lot more!
http://www.elOnionBloggle.Blogspot.com
” They are digging themselves into a deeper hole.” When you see historical temperature being altered, that’s becoming obvious. There is still no proof of correlation between CO2 and AGW. The religion is powerfully promoted by MSM, schools and universities, to keep the dream alive. I cannot envisage that teachers, after dragging students out of class, will ever go back to the students and tell them “sorry it’s all been a political hoax”.
I read a left wing columnist criticizing the skeptics. She said the ‘the deniers always say that reality doesn’t match the models but the global mean temperature is ‘tracking’ (her word) the lower range of the models. She didn’t say that the lower range is the Russian model and yes it’s close to reality but it is also not scary.
“like those who deny that the greenhouse effect exists”
Never proven. Not one enviromental observation.
Tyndall only proved absorption of IR.
Flame me all y’all want- just remember lots of concepts exist only in the mind or the math not reality. There’s no such thing as imaginary numbers…
A good summary by Rud. Just two points, I was surprised that feedbacks were not mentioned and I would have appreciated a little bit more comment on ERL and GHG saturation.
I don’t know if Rud plans to respond to the general feedback at some pont.
Rather than more theorising, I’d have preferred more about observation. How is ERL supposed to be measured? If it can’t be measured (observed), it can’t be tested and that means it’s not science.
This key point should be widely reported, but I doubt it will be:
Billions of dollars, thousands of scientists, and 42 years – yet our estimate of the effect of CO2 on global temperatures is worse than it was in 1979!
Good post Rud.
ERL.
Effective Radiating Level.
Effective.
How do you measure “effective” Rud? This is not observable, and not testable scientific reasoning. It’s nonsense. Why would you put your name to it?