By Rud Istvan,
In several previous recent post comments, I have been cryptically alluding to an alternative ECS derivation that strongly supports the observational ECS estimates, and also the Willis Eschenbach emergent thermoregulation hypothesis. Since my comments were scattered about and are largely non-searchable via WUWT, I thought a guest post with lots of links and illustrations might be a useful summation avoiding more same-same comments. In the future I can just comment to relative newbies by referencing this summary guest post.
My arguments are somewhat technical, so please forgive the sometimes unfortunately lengthily explanations intended for those who newly visit WUWT. Its logical history goes back to 2011, as the below linked references prove.
Background
AR4 said the most likely ECS (equilibrium climate sensitivity, what the resulting GAST temperature will be after a doubling of CO2 when everything else settles out after some hundreds of years hence (see essay Sensitive Uncertainty in ebook Blowing Smoke for the inherently uncertain ECS time frame issues) was ~3C. Their CMIP3 climate model ensemble actually had a mean of 3.2C, so IPCC could even claim they were being ‘conservative’.
AR5 offered no such most likely ECS estimate. The reason was that the CMIP5 models still predicted about 3.2C ECS, while the observational energy budget papers since 2013 estimated about 1.7C. So IPCC said no central estimate could be given because of the model/observation discrepancy (IPCC AR5 SPM.5.D2).
The questions arise, which is the more reliable ECS estimate, and can the AR5 differences be reconciled? This guest post attempts to answer both in a simple logical fashion, while omitting many distracting ‘climate science’ false nuances.
Basic Climate Science
There are two notions of ECS. The first is without feedbacks (mainly water vapor and clouds). It estimates a simple non-condensing gas CO2 doubling. AR4 implicitly had that at a 1.1C. Lindzen’s 2012 curve reproduced below used ~1.2C. Using Monckton’s equation and his parameters yields 1.16C, so one can legitimately argue Lindzen’s following curve merely rounds up given uncertainty.
To understand the following Lindzen graph, one also has to understand his underlying BODE f/(1-f) ‘total feedback factor’ equation reasoning derived from electronics amplifier circuit theory. It posits that the net system feedback gain is a linear sum of the individual system feedbacks. It works. And, if the no feedback result is just about 1.2C (Lindzen), then it looks mathematically like this:

Simple graphical analysis says that per Bode, if the AR4 ECS is ~3, then the Bode equivalent must be about 0.65. Unlike Monckton’s previous CE posts here on Bode math, it is still quite reasonably well behaved.
AR4 also said that water vapor feedback (wvf) by itself about doubles the no feedback ECS. So ~1.2C * 2 = ~2.4C, so from the above graph a WVF Bode of ~0.5. AR5 also said that cloud feedback must comprise most of the rest, since all else per AR5 nets to about zero.

So per AR5 cloud feedback must be about positive Bode (0.65-0.5) 0.15.
Basic Observations
Dessler (paywalled, A Determination of the Cloud Feedbacks, Science 330:1523-1527 2010)) wrongly asserted his paper found a positive cloud feedback. Steve McIntyre took him severely to task. In fact, Dessler’s R^2 of 0.02 shows no correlation whatsoever, so no cloud feedback at all. So the real Bode is 0.65-0.15~=0.5.
Wentz (paywalled, Wentz et al, How much more rain will global warming bring? Science 317: 233-235, 2007)) found in 2007 that the CMIP3 models produced about half of ‘observed’ ocean precipitation. His paper can be criticized because the oceans were not then well ‘observed’. ARGO changed that, and one of its three main design goals (via salinity) was ocean precipitation. ARGO data now says that in fact CMIP5 produced about half the ARGO sensed precipitation.
That implicitly means that the water vapor feedback is actually about half of modeled because of rainfall humidity washout. So Bode 0.5/2 is about 0.25.
Willis Eschenbach thermoregulation theory rules.
Conclusion
Plug Bode 0.25 into Lindzen’s above base ~1.2C Bode feedback curve and out pops about 1.7C ECS, very close to the observational energy budget ECS estimates, and about half of the CMIP5 climate models. Model ECS is provably high by about 2x. And that unavoidable observation/math explains two things:
- Why there is no climate emergency at all.
- Why Schellnhuber’s admittedly arbitrary 2C ‘tipping point’ was later changed to 1.5C by alarmists. Otherwise, their new climate alarm would have to also be mathematically cancelled.
You cannot reconcile a CO2 ECS with the constant warm pool temperature.
You have to argue that the warm pools do not regulate to an annual average of 30C. That defies 50 years of reasonable temperature records.
If you accept that warm pools regulate to 30C then ECS is zero over warm pools. Then you have to work out how the CO2 ECS changes across the globe and why.
On a homeostatic water world, net feedbacks are more likely to be net negative than positive. Hence ECS should lie between 0.0 and 1.2 degrees C per doubling of plant food in the air. In some environments, feedbacks are so negative that more CO2 produces tropospheric cooling. This arguably happens in the hot, moist tropics and over cold, dry Antarctica.
Assuming that the concept of ECS has any validity at all.
“Simple graphical analysis says that per Bode, if the AR4 ECS is ~3, then the Bode equivalent must be about 0.65”
No it doesn’t. You don’t need a graph anyway. If
1.2*f/(1-f)=3
then
4.2*f=3
f=5/7=0.714
Late here, so good night. But please revisit your Bode math and the Lindzen curve and his explanation before reposting more nonsense.
Bode didn’t invent linear algebra. We knew how to handle f/(1-f) before Lindzen. This stuff is elementary.
The Navier Stokes equations are nonlinear. Sensitive dependence on initial conditions means that no finite set of past data can ever be sufficient to predict future states with confidence. This has been known since 1963 when Edward Lorenz published “Deterministic Nonperiodic Flow” in the Journal of Atmospheric Sciences. Anyone who pretends to predict distant future states in a Navier Stokes system is either incompetent, or a fraud, or both.
Rud,s analysis has nothing to do with Navier-Stokes equations.
They really don’t deserve you Nick.
I used your “BODE” f/(1-f) formula there. But in fact Lindzen has graphed the correct 1/(1-f) function (check where f=0). So using that,
1.2/(1-f)=3
3*f=1.8
f=0.6
You know, I goofed onceagain, proven by my own links if anyone bothered to check. The Bode math thing is 1/(1-f). The sigmoid market penetration ‘S’ curve from my long distant past is f/(1-f). I made the now unfortunately too frequent mistake of confusing too much just from memory.
Wont happen again here. Either no post, or everything is double checked before hand. Here, my one minor misstatement is fortunately easily discoverable, and has no impact on the final conclusions.
Nick, all due respect,
but if I may say;
There will never be more than 1.2C warming detected or observed.
In consideration of natural, it could be ok to consider both TCR and CS or even ECS.
But definitely not how is used by the climatariat of AGW.
We live in a time period that it is very interesting.
It is the only period offering the possibility
of detecting or observing the
Radiative effect and it’s ‘size’.
And that is not and has nothing to do with manmade CO2 emissions.
In real, or reality,
even when we may approach the concept of TCR or CS and ECS,
by means and relation to CO2,
it actually is about the Sun shine,
CO2 plus the physical variation of the size of Atmosphere.
The way I am putting this forward, it means that TCR can not be more than 0.2C,
CS can not be more than 0.8C.
TCR, the ‘value’ point where atmosphere will be bound to respond.
At 0.2C random anomaly in the system, either internal or external.
An only atmospheric response.
CS, the ‘value’ point where the whole thermodynamic coupling,
Ocens-Atmosphere,
will respond to a regular radiative thermal content, equivalent to 0.8C warming in Atmosphere. (the corresponding CO2 variation 200ppm)
ECS, the ‘value’ point,
where and when the thermodynamic coupling will respond to a very long time ‘anomalous’, but periodic accumulation of a radiative thermal content in the oceans.
Equivalent to 0.4C atmospheric warming.
In consideration of such a response, the max atmospheric warming will be more or less at 1.2C… observed… the ECS value.
Only happening once every 80K years… within a time frame of 0.5-1K years.
I know that this may sound weird or crazy,
but hey you never know, a specific one there put forward.
At least hopping that Rud will appreciate it… or at least not mind it, regardless. 🙂
cheers
Really wishing and expecting a negative red vote there on me comment… to Nick.
Please do it!
This is amazing…
“In fact, Dessler’s R^2 of 0.02 shows no correlation whatsoever, so no cloud feedback at all. So the real Bode is 0.65-0.15~=0.5.”
This makes no sense. Various people have thought various things about cloud feedback. To do that subtraction, what you have to find is what the people who found ECS as 3 actually used (or rather are interpreted to have used), not what Dessler may have found.
But in any case, a high uncertainty associated with correlation does not mean the answer is zero.
“That implicitly means that the water vapor feedback is actually about half of modeled because of rainfall humidity washout. So Bode 0.5/2 is about 0.25.”
This makes no sense at any level. What is “rainfall humidity washout”? If CMIP3 is underestimating rainfall by 1/2, they are underestimating humidity, and thus underestimating, not overestimating wv feedback.
But precipitation over land and water is fairly well known, and from observations in the phase where it actually happens (air). By rain gauges, radar, satellite etc. It averages just under a meter a year, globally, and matches evaporation. The water budget isn’t that loose. Trying to estimate from Argo measurements of ocean salinity is very flaky. It relies on some model of surface turbulent mixing, among other things. If the Argo estimate is about twice what rain gauges/radar/satellites say (big if), it’s wrong.
ANOTHER collossaly stupid comment, Nick. There are no rain gauges on the open ocean, DUH. Rainfall on land is highly dependent on topography and prevailing winds. Consider the difference in annual rainfall in Hilo, Hawaii (130 inches) and Kailua-Kona (16 inches) 76 miles away. Even rainfall averaged over the whole island would tell you nothing about what the rainfall would be at that location in the ocean if the island wasn’t there. You made up that crap about ARGO being wrong if it disagrees with rain gauges. The simple fact is rainfall is strong function of location and satellite measurements are subject to much error too.
The more it rains, the less the remining humidity in the atmosphere will be. DUH. Evaporation is a function of the humidity, DUH. The more you write the more obvious it gets that you just make stuff up. WHY?
Satellites measure rainfall over the oceans and have done so for decades. For example: https://gpm.nasa.gov/missions/GPM/DPR
Really? Satellites aren’t rain gauges. Read my post again.
Nick didn’t say ocean precipitation relied on rain gauges. Read his post again.
“The more it rains, the less the remining humidity in the atmosphere will be.”
So Hilo must have really dry air???
The wind constantly blows in humid air from the ocean, as Hilo is right on the ocean on the windward side of the island. However, there are times after a rainfall when Hilo’s air is less than 100% relative humidity. DUH. You can stop making stuff up, it’ll get called out.
It sure is “dry” (wrung out? dry-er?) upon exit … headed to Kailua-Kona, that is.
Meab posted: “The more it rains, the less the remining humidity in the atmosphere will be.”
Well, in terms of relative humidity in a volume surrounding any rain cloud, that statement is non-sensical. By definition, rain fall is precipitation resulting from the atmosphere reaching 100% relative humidity in the presence of condensation nuclei. Therefore, the more it rains the more (longer) the local relativity surrounding the rain cloud remains at its maximum possible level, 100%.
You apparently don’t know much about rain, Dressler. It rains when warm, humid air meets a colder air mass or when uplifted air cools, as in orographic lifting or a thunderstorm. Condensing water releases heat, warming the air, so if there was no uplifting and cooling (look up adiabatic, moist lapse rate) or no cold air mass the relative humidity would quickly fall below 100% (it takes more water content to reach 100% relative humidity in warmer air) and it would stop raining immediatly. But that’s not what happens, is it? Rain is a dynamic process that removes water from the air at the cooler boundary and leaves lower humidity air when the air sinks. That’s why Kailuna Kona is dry and Hilo is wet.
To avoid a lengthy—and sure-to-be-unappreciated reply—I will just point out that water vapor condensation, as rain, is offset to a large degree, in real time, by evaporation of rain as it falls from clouds, thus cooling the surrounding air. Please look up “virga” to understand a limit case of this process.
Which leads me ask: Is Kailua Kona dry due to its physical location wrt to prevailing winds enhancing evaporation over that experienced by Hilo?
Virga doesn’t hit the ground so it doesn’t contribute to rainfall. And no, Kailuna-Kona IS dry because the air is less humid from all the rain falling out upwind on the Hilo side. I suspect that you knew that. Same reason the Olympic Peninsula is a rain forest, Western Washington is wet, and Eastern Washington is semi-arid. 120 inches difference in rainfall in 180 miles – over 1/2 inch difference in rainfall per mile
“Same reason the Olympic Peninsula is a rain forest, Western Washington is wet, and Eastern Washington is semi-arid. 120 inches difference in rainfall in 180 miles – over 1/2 inch difference in rainfall per mile”
That is amazing. I didn’t realize there was such a difference. And it happens even out in the middle of the Pacific ocean, too. That’s amazing, too.
Specious.
Rain falls at 32 feet per second squared, minus air friction.
That evaporation you refer to happens in dryer air far below where condensation originally occurred.
Or are you claiming that heat released by condensation is countered by immediate evaporation which completely eliminates rainfall?
The evaporation you claim occurs is a temporary phenomenon. Since that evaporation eliminates/reduces rainfall until humidity reaches a level that supports rainfall to proceed with minimal unevaporated.
Leaving heat where condensation occurred at higher altitude.
Sufficiently high condensation rates drives the humidity laden air higher in altitude increasing rates of condensation.
It is well known—at least by scientists—that large atmospheric convection cells that form clouds (especially cumulonimbus clouds) carry raindrops upward, often to great heights where they freeze, and they can cycle thusly, up and down, inside the convection cell, for many minutes to the extent that large hailstones eventually drop from such clouds to the ground.
This does, in fact, happen over Hawaii (ref: https://en.wikipedia.org/wiki/2012_Hawaii_hailstorm ).
But maybe this is all just . . . specious. After all, I’ve been accused of not knowing much about rain.
You fail to see the more profound problem. Even a no feedback ECS of ~1.2 can only obtained if you ignore the sheer existence of clouds and already include vapor feedback. Once you allow for clouds it drops massively. The effect can easily be shown with modtran.
Load the default preset with “tropical atmosphere” and so on. Emissions are 298.52W/m2. If you double CO2 to 800ppm emissions sink to 295.191W/m2.To get emissions back up to 298.52W/m2 we need to add a temperature offset of 0.76K if we hold “water vapor pressure” constant. Only if we set “relative humidity” constant, thus allowing for vapor feedback, we have to add 1.21K. But again, that is already including the feedback.
The interesting thing is what happens if we include a cloud scenario, like “Altostratus Cloud … Top 3.0km”. Then emissions are 269.004W/m2 at 400ppm to start with. But then, including vapor feedback, we only need 0.84K as a temperature offset to with 800ppm to emit 269.004W/m2 as before.
So the problem with assessing ECS is not any (uncertain) cloud feedback, but ignoring the existence of clouds in the first place.
Yes – just ignore clouds because they do not fit the story.
CERES shows ToA OLR emissions over warm pools to be as low as 180W/sq.m averaged over an entire months. See how MODTRAN can be adjusted to get that result over a 303K surface.
Anything pitching the “Greenhouse Effect” that states water vapour is a greenhouse gas conveniently ignores that water exists as gas, liquid and solid in the atmosphere.
If water vapour is a Greenhouse Gas in the atmosphere then it is reasonable to describe solid water in the atmosphere as an Icehouse Solid.
“CERES shows ToA OLR emissions over warm pools to be as low as 180W/sq.m averaged over an entire months. See how MODTRAN can be adjusted to get that result over a 303K surface.”
Just to get ths straight in my mind, you are saying that the warm pool creates lots of clouds above it through evaporation, and these clouds keep much of the warmth nearer the surface, and this reduces the emissions at the top of the atmosphere above the warm pool?
And there are numerous warm pools around the world and they are not being taken into consideration in figuring out the amount of energy coming in and out of the Earth system?
oops…I forgot to post the link
http://climatemodels.uchicago.edu/modtran/modtran.html
In other news, my golf was delayed yesterday morning due to frost warnings.
“Where’s my snow wedge?”
Golf games disrupted by snow in Eastern USA and Canada again this weekend.
Global cooling is happening, even as atmospheric CO2 concentrations increase.
“Atmospheric CO2 changes lag temperature changes at all measured time scales.”
Climate Sensitivities CS, ECS, TCS may not even exist.
_____________________
Allan MacRae published in the Calgary Herald on September 1, 2002, based on communication with Dr Tim Patterson:
3. “If [as we believe] solar activity is the main driver of surface temperature rather than CO2, we should begin the next cooling period by 2020 to 2030.”
MacRae updated his global cooling prediction in 2013, based on cold events that occurred starting circa 2008 near the end of Solar Cycle 23:
3a. “I suggest global cooling starts by 2020 or sooner. Bundle up.”
In 2019, expert meteorologist Joseph D’Aleo and I co-authored a paper describing the late planting in 2018 and 2019 and the huge Great Plains crop failure of 2019 due to cold, wet weather.
THE REAL CLIMATE CRISIS IS NOT GLOBAL WARMING, IT IS COOLING, AND IT MAY HAVE ALREADY STARTED October 27, 2019
Planting was ~one month across the Great Plains of North America for crop years 2018 and 2019. In 2018 the growing season was warm and the crop recovered, but in 2019 there was a huge crop failure across the Great Plains. In 2019 fully 30% of the huge USA corn crop was never planted because of wet ground. Much of the grain crop across the Great Plains was severely harmed because of early cold and snow in the Fall.
We saw these very-cold weather patterns due to the instability of the polar vortex at the end of SC23 circa 2008, and this enabled me in 2013 to re-calibrate our 2002 global cooling prediction from “2020-2030” to “2020 or sooner”, at the end of much weaker SC24. A huge crop failure across the Great Plains of North America occurred in 2019. Now we have this brutal winter and very cold spring in 2020-2021. Nailed it.
Crop losses are already significant this year. Worrisome.
Best regards, Allan
________________________
CLIMATE CHANGE, COVID-19, AND THE GREAT RESET
A Climate, Energy and Covid Primer for Politicians and Media
By Allan M.R. MacRae, Published May 8, 2021 UPDATE 1e
Download the WORD file
https://thsresearch.files.wordpress.com/2021/05/climate-change-covid-19-and-the-great-reset-update-1e-readonly.docx
Addenda:
COLORADO BREAKS MULTIPLE COLD RECORDS + DENVER SUFFERS ITS SECOND-LONGEST SNOWFALL SEASON SINCE RECORDS BEGAN
May 12, 2021 Cap Allon
You’d forgive CO residents for thinking the climate was actually cooling!–But I’m sure they know better than to trust their own eyes and real-world observations — after all, it’s those ‘supercomputer-generated’ climate models that dictate reality, not natural variability, not the Sun… (sarc!).
CENTRAL RUSSIA EXPERIENCES RECORD SPRING SNOW, AS CRIMEA SUFFERS EXCEPTIONALLY COLD APRIL
April 30, 2021 Cap Allon
Global warming’ continues to be demonized by the IPCC, the MSM, and those hokey pop-scientists, yet heat has only-ever proved beneficial for life on our planet — it’s the cold that gets us.
EARLY-SEASON BLIZZARDS HIT AUSTRALIA + A POWERFUL POLAR OUTBREAK IN THE FORECAST
May 13, 2021 Cap Allon
In recent years, Australia’s climate has been changing — for the cooler and wetter. And early-season snows have become far more common. #GrandSolarMinimum
HISTORIC COLD SPREADS ACROSS THE U.S. BREAKING LOW TEMPERATURE RECORDS FROM THE 1800S
May 13, 2021 Cap Allon
Plus, Europe looks set for more unprecedented lows and historic late-May snows. Bundle up. Spring 2021 is a no show.
With the official start of summer less than 40 days away, an unseasonably cold air mass is currently gripping large areas of the United States, dropping temperatures some 25 degrees F below seasonal averages.
As reported by CNN weather, these temperatures are more in line with what you should expect in mid-March, not mid-May.
U.S. HAS SET 17,450 NEW LOW TEMPERATURE RECORDS THIS YEAR VS 13,886 HIGH + SINABUNG EXPLODES INTO THE STRATOSPHERE
May 17, 2021 Cap Allon
Furthermore, the U.S. ALL TIME records summary reveals that 223 new unprecedented, never-before-observed low temperature benchmarks have been busted this year, versus the solitary 1 for all-time record highs. This disparity between cold records and hot records has only been increasing in the month of May.
Told you so, 19 years ago… Nailed it.
FIVE MAJOR DATASETS SHOW GLOBAL COOLING, AS CARBON BRIEF IS CAUGHT LYING TO THE PUBLIC
May 17, 2021 Cap Allon
Climate Change headlines are built around narratives, not facts. Most sheeple are easily fooled by illogically-linear charts and phony correlations.
The Global Lower Tropospheric Temperature Anomaly has cooled 0.64C in 14 months, from an anomaly of +0.59C in February 2020 to only -0.05C in April 2021.
RECORD BREAKING COLD BLASTS AUSTRALIA AND CANADA: “GLOBAL” COOLING
May 20, 2021 Cap Allon
Arctic air continues to descend unusually-far south, while Antarctic air continues to ride anomalously-far north. The culprit is low solar activity, namely its weakening of the jet streams, and the upshot is COOLING across the lower-latitudes (where us humans reside).
Not since the year 1967 has Sydney experienced a colder streak in May.
In Kamloops and the Okanagan, British Columbia, record-breaking overnight lows for this date were logged.
DELHI, INDIA SUFFERS COLDEST MAY DAY IN 70 YEARS + EARTH HAS COOLED 0.8C SINCE 2016
May 20, 2021 Cap Allon
This COOLING trend is expected to accelerate over the coming months and years as the Sun continues its relative shutdown. Prepare for the Grand Solar Minimum.
RECORD COLD AND LATE-MAY SNOW SWEEPS THE WESTERN U.S. + COLD EUROPE + MORE MSM OBFUSCATION
May 21, 2021 Cap Allon
Accumulating late-May snow is pummeling the higher elevations of the Western United States — the latest inconvenient real-world observation to pour cold water on the hot mess that is AGW.
The picture is the same in Europe:
RARE AND HEAVY LATE-MAY SNOWFALL HITS KASHMIR, INDIA AND KAGHAN, PAKISTAN
May 25, 2021 Cap Allon
While northern Russia’s anomalous warmth is dominating the MSM headlines, the intense cold-blasts and unusually fierce snow-dumps currently ravaging vast portions of the planet are of far greater concern.
Over the weekend, twenty-one runners tackling a mountain ultramarathon in northwest China perished after freezing conditions hit the high-altitude race. Rescuers were only able to save 151 out of a total of 172 participants.
VIOLENT LATE-SPRING SNOWSTORM BLASTS SCOTLAND, BURIES THE HIGHER ELEVATIONS
May 25, 2021 Cap Allon
Scots are suffering a rare late-spring Arctic blast this week as an unusual chill continues to engulf the majority of the European continent.
GREENLAND JUST GAINED A RECORD-SMASHING AMOUNT OF SNOW AND ICE
May 26, 2021 Cap Allon
According to climate alarmists, Greenland should have melted into oblivion by now. Yet here we are, posting unprecedented GAINS:
NEW ZEALAND SUFFERS ALL-TIME RECORD COLD, AS GREENLAND SNOW & ICE GAINS HEAD OFF THE CHARTS [LITERALLY]
May 27, 2021 Cap Allon
Every key data point now indicates a cooling planet. How long will it be before the likes of the IPCC and their MSM lapdogs report on the facts?
MONTHLY LOW TEMPERATURE RECORDS FALL IN VANUATU, AS LATE-SEASON SNOW AND UNPRECEDENTED COLD SWEEP TORONTO, CANADA
May 29, 2021 Cap Allon
Plus: ‘Surprising Arctic Sea Ice Thickness is Good News for Polar Bears.’
NEW YORK CITY TIES 1884 RECORD FOR LOWEST-MAXIMUM TEMPERATURE THIS LATE IN THE SEASON
May 31, 2021 Cap Allon
Well below-average and record-breaking temperatures continue to grip swathes of the United States this Memorial Day weekend.
INTENSE COLD GRIPS SE AUSTRALIA, TOPPLES MULTIPLE MONTHLY COLD RECORDS + POWERFUL ANTARCTIC BLAST TO HIT NEXT WEEK
May 31, 2021 Cap Allon
The COLD TIMES are returning, the mid-latitudes are REFREEZING, in line with the great conjunction, historically low solar activity, cloud-nucleating Cosmic Rays, and a meridional jet stream flow (among other forcings). Prepare.
Global temperatures estimated to be +0.3C above the 1979-2000 average for the date today. NH +0.8C above average: https://climatereanalyzer.org/wx/DailySummary/#t2anom
The “great conjunction” didn’t come to much.
Nail:
Your U of Maine post appears to refer to model results.
Actual satellite measurements from the best source, Christy and Spencer at UAH, show continued cold through May.
Your “best source” continues to stubbornly show a rising trend of +0.14 C/decade, so inconvenient. But just ignore that if it doesn’t fit your world view. Or better still; correct it.
UAH Global Temperature Update for April 2021: -0.05 deg. C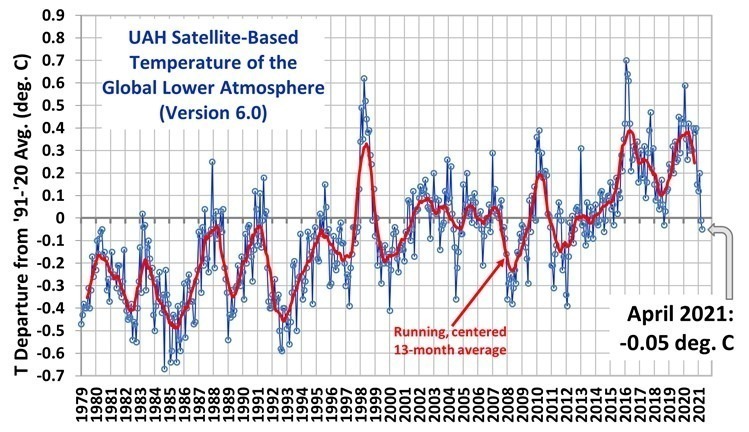
Still no hockey stick visible here.
INTENSE COLD GRIPS SE AUSTRALIA, TOPPLES MULTIPLE MONTHLY COLD RECORDS + POWERFUL ANTARCTIC BLAST TO HIT NEXT WEEK
May 31, 2021 Cap Allon
The COLD TIMES are returning, the mid-latitudes are REFREEZING, in line with the great conjunction, historically low solar activity, cloud-nucleating Cosmic Rays, and a meridional jet stream flow (among other forcings). Prepare.
EXCEPTIONAL SNOWFALL –THE BIGGEST IN OVER TWO DECADES– PUMMELS PATAGONIA
June 1, 2021 Cap Allon
Plus: Adelaide, Australia shivers through Coldest May Morning in almost 100 Years.
“Global cooling is happening, even as atmospheric CO2 concentrations increase.”
You are going to destroy faith in the IPCC carrying on like that.
Good! Their lack of credibility needs to be spread far and wide.
I know where I live isn’t the whole world, but it sure has been chilly this year. I don’t mind the slightly cooler temperatures. What I would worry about in a cooler world is the shortened growing season. Later Spring freezes and early Fall freezes could be very detrimental to a lot of people.
I hate having to rely on cooler weather to prove the alarmists wrong. But it’s not really up to us anyway, is it. Mother Nature is in the Driver’s seat by all indications.
RARE “LEVEL 5” SNOWFALL WARNING ISSUED IN SOUTH AFRICA: “THIS COULD BE LIFE-THREATENING”
June 2, 2021 Cap Allon
SAWS: “Danger to life and property due to hypothermia and the collapsing of infrastructure, widespread loss of livestock and crops [are expected].”
DELHI, INDIA SUFFERS ITS COLDEST JUNE TEMPERATURE EVER RECORDED
June 2, 2021 Cap Allon
India has been breaking low temperature records left, right and center this year; in fact, since August, 2020 Delhi has busted at least one major weather record each and every month.
COLDEST “SUMMER” WEEKEND ON RECORD IN ATLANTIC CITY
June 2, 2021 Cap Allon
A host of records have been toppled, in books dating back to 1874. Trends change (sorry IPCC). Welcome to the next cooling epoch.
I keep wondering what good is a model which assumes one number for the whole surface of Earth. Clearly the local ECS must vary tremendously given that parameters like temperature, humidity and angle of incoming solar radiation vary over this dirt ball.
I can imagine to get a different averaged feedback value depending how the effect of these parameters variation is integrated… of course at best only one of these ECS values is correct.
interplanetary Report 313252…the lifeforms on the studied planet, who refer to themselves as “humans” have an average of 1 testicle for reproductive purposes….
A histogram of all the ECS values reported in IPCC #5 ch. 9 is tri-modal and highly non-normal, so it is really incorrect to claim there is a single AR5 value; the average of all the models is meaningless.
I can’t remember the exact words or give a link, however, Gavin once said something like “None of the models are correct but the average of the models gives the right answer”.
What the frack?
I don’t believe that he said that.
It certainly sounds like climate science whether he did or not.
JF
You can make up anything you like.
Thanks but I prefer to leave the confection of fantasy fairytales to climate ‘science;.
JF
The exact quote is:
Link
(The original is missing or has been moved, so the Wayback machine comes to the rescue)
But I do recall him stating “gives the right answer” in a talk
Thanks
Emotionally unable to admit error means you have a personal bias conflict of interest severe enough to eliminate your comments from reasonable consideration.
Why don’t you just apologize and admit your error!?
What he said was perfectly sensible. It was nothing like
“None of the models are correct but the average of the models gives the right answer”
Just apologize!
I’m not offended by Nicks comment so no apology required
Averaging results can get a bit tricky.
For example, there are two eyewitnesses to an armed robbery. One eyewitness said that the man ran away. The other eyewitness said that the man escaped in a wheelchair and he had no legs.
The police are now looking for a one legged man.
True story, the American Air Force studied the anatomy of hundreds of pilots so they could cut down on accidents.
The end result:
The average human has one testicle
He actually said in 2007
“Climate models are amalgams of fundamental physics, approximations to well-known equations, and empirical estimates (known as parameterizations) of processes that either can’t be resolved (because they happen on too small a physical scale) or that are only poorly constrained from data. Twenty or so climate groups around the world are now developing and running these models. Each group makes different assumptions about what physics to include and how to formulate their parameterizations. However, their models are all limited by similar computational constraints and have developed in the same modeling tradition. Thus while they are different, they are not independent in any strict statistical sense.
Collections of the data from the different groups, called multi-model ensembles, have some interesting properties. Most notably the average of all the models is frequently closer to the observations than any individual model. But does this mean that the average of all the model projections into the future is in fact the best projection? And does the variability in the model projections truly measure the uncertainty? These are unanswerable questions.”
Gavins comments are very vague and in no way indicate that the average of the models is a good projection.
This was a justification to using the MMM. ( Multiple Model Mean) Which has been used in countless scary story papers and newspaper headlines of CAGW. Yet the observations are well below almost or all of the models.
All just guessing.
May be, after 100 years of observation we will know the feedback.
My educated guess, it is negative.
An extra square meter of cloud during daytime can reflect about 800 watts of sunlight back into outer space whereas the same square meter without cloud lets more than 1000 watts through to the ground. Sure, correct for cos /_ ….still a few minutes of cloud SW reflection makes up for all day CO2 forcing….
So does cloud feedback of zero or a little bit positive make any sense ? No, it makes more sense to seek answers to why the calculation is wrong.
As an EE with a modicum of experience feedback theory, I would advize caution in applying feedback theory that geared to mildly non-linear systems, to systems with exponential response to some parameter, such as saturation vapor pressure of water with temperature. With water vapor feedback, the “Bode feedback factor” will vary with water temperature. An example is that tropical storms need a sea surface temperature of at least 26C in order to maintain strength.
Willis’s thermo-regulatory hypothesis makes sense, though I would use the terminology of thunderstorms acting more as a limiter (e.g.metal oxide varistor) than a governor which is often used to describe a device that maintains a set up as opposed to a device the prevents exceeding a set point.
One other argument in favor of T-storm feedback is that the long term (>> 100,000 years), shows a pretty hard limit to peak temperature, but strong positive feedback in the low temperature case. That is the temperature drops during a glacial period, and the rises very rapidly at the end of a glacial period.
Yes! Fully agree. ECS is not a constant. It is temperature dependent, because of the exponential response of water vapor pressure, but also when combined with the fact that water vapor drives atmospheric circulation (wind) which is a secondary feedback, and wind drives wave action which increases the surface area for water evaporation, a tertiary feed-back.
And Willis’ hypothesis is a clear demonstration that, at water temperatures in the low to mid-20s, water-vapor feed=back turns negative.
ECS formula only correlates two values. Temperature and Forcing. The forcing is, of course, CO2. Apparently there can be no other explanation. I don’t care how famous the person is who calculates it.
Over the years the calculations have not been within 3-4% of each other. They have been 3-4 TIMES each other.
Who can believe that nonsense?
Just playing with numbers. Nothing to do with reality
My theory is that ECS is just another adjustable parameter inside the models, rather than something which falls out from running.
Rud,
It is a bit of a mess.
The basic variables for climate sensitivity to CO2 are, obviously, CO2 and temperature. Therefore, we need to be sure that these are measured accurately.
CO2 is often observed at Mauna Loa. There are other stations of note like Barrow (Alaska). Cape Grim (Tasmania) and the South Pole. While the results are comparable, they are not identical in variability or in averages, so there is a source of error. The observations are filtered to remove outliers, producing a lopsided distribution. There are many higher vales globally, whenever for example fossil fuels are burned, so the distribution has a long tail on the high side, but essentially no low values. Therefore, the observations that are used are not strictly representative of what goes on in the atmosphere. Consensus seems to be that it is acceptable to have these errors.
Temperature is usually observed 1-2 m above the land surface, in a screen that captures changes in the local air, to an extent. Temperatures recorded this way are affected by several known variables such as rainfall. Rain cools, but does not heat, leading again to a lopsided distribution. In particular, rain can account for some 30% of the variability of such measurements, but this is usually accepted and regarded as weather which aggregates to climate, so it must be OK.
However, when using equations from physics, such as Stefan Boltzmann, the real question arises for ECS whether the temperature should be adjusted to a basis of no rainfall or a stipulated rainfall. Further, since these screened observations usually differ from direct soil temperature measurements, another decision point is whether the screen observations should be scrapped and only soil T observations used. It is the soil (or bare rock, or ice) temperature that should be used over land for ECS calculation, since the soil is the main source of upwelling IR. These are fairly deep philosophical consideration which have attracted very little discussion in science literature. For some discussion, see bomwatch.com.au blog.
Coupled with this is a general reluctance of research bodies to calculate and publicise the real error of these routine daily measurements that are historically the main input into ECS calculations. Here is the last response, June 7th 2019, of several to me from the Australian BOM. Quote starts –
You have asked “If a person seeks to know the separation of two daily temperatures in degrees C that allows a confident claim that the two temperatures are different statistically, by how much would the two values be separated?”
The internationally accepted standard for determining if two measurements are statistically different is ISO/IEC17043. The latter covers the calculation of a normalized score (known as the EN score), which is a standard method for this type of question.
As previously communicated, the most relevant figure that we can supply to meet your request for a “T +/- X degrees C” is our specified inspection threshold (conservatively within +/- 0.3 ⁰C), but this is not an estimate of the uncertainty of the ACORN-SAT network’s temperature measurements in the field.
Quote ends.
Traditional science methods for calculating a relation between two major variables would routinely include estimates of error for each, carried through to the final combined estimate (of ECS in this case). Has any reader here seen (realistic) error terms for ECS? Geoff S
So it looks like it Bodes well!
The purely mechanical arguments above ignore the biology of the oceans. What has been the the response of ocean life to surface smoothing by oil or surfactant smoothing? Has dissolved silica run-off from the huge increase in farming since 1910 changed the spring blooms with diatoms (C4-like metabolism but silica shells) changing amount and isotopic composition of deep ocean export? Haber process nitrogen fixation has matched that carried out by all life. Novel chemicals e. g. Tide detergent challenge natural breakdown processes. Have these reduced the release of phytoplankton CCNs?
The key to climate change may be in ocean life – it’s Oceana who rules this planet, not Gaia. After a prolonged Azores high we flew from Portugal to Madeira and observed a fractured smooth for hundreds of miles. Was this a response to reduced nutrient stirring – by suppressing ripples by releasing lipids this would improve light levels lower down in the water column giving access to more nutrient-rich layers. Dunno.
Is NAAMESlooking at surface and run-off ocean changes?
JF
Julian,
Quite so.
These are more unmeasured errors that increase the fogginess of ECS.
Usually, formal papers are not offered for publication with known large or potentially large uncertainties still to be accounted for. Geoff S
Ocean wildlife releases their own oils and surfactants.
One of the methods to look for bait fish is to spot the surface slicks over the bait schools.
The very fact that a planet-full of genius-level scientists STILL can’t agree on the single most fundamental issue surrounding AGW tells ordinary guys like me all I need to know.
Science has not cracked ECS, yet is rolling out $multi-trillion campaigns as if they had.
What a monumental blag this all is. Someone prove me wrong. Oh hold on, you can’t, because nobody can even agree on ECS. With that failure of humankind in pole position everything else is just opinion.
Are we sure that 3.7W/m^2 would warm a surface at a mean 15°C, by a net +1.2°C?
No that would be about 0.7 degrees
https://klimaathype.wordpress.com/2018/03/24/localised-instant-climate-sensitivity-for-2xco2/
That’s exactly what I reckon Hans.
If it were all turned into a stable heat source it might warm the surface by .7 C. One of the big problems in climate science is they assume it is all turned into heat. There are many things that can happen to the energy in a very short time span. The biggest is the release of latent heat by water. You can also have immediate reradiation which leaves the surface unwarmed.
In addition, you need to factor in the amount of energy CO2 enhanced vegetation absorbs and subtract that away from the total.
How much energy does it take to accelerate the water cycle globally?
How much of any above equilibrium energy input goes into that, verses heat?
And is it not true that most any mechanical motion system requires exponentially more energy to get the same result? Certainly the climate models do not assume the climate system is 100 percent inefficient, and all above equilibrium energy input goes into additional heat?
I’ve looked at clouds from both sides now
From up and down, and still somehow
It’s cloud illusions I recall
I really don’t know clouds at all
Joni Mitchell
Singer/songwriter/climate scientist
That ought to be the Alarmists’ theme song.
I’m gonna take issue with the Land Use Albedo figure.
They are saying ‘minus 0.15 Watts per square metre’ are they?
OK
10% of Earth surface is farmland.
Say half of that is routinely ploughed/cultivated/tilled/ Arable land basically
Thus, while ploughed and in the bare soil state will present an Albedo of 0.15, for 9 months of the year
When green and growing will present an Albedo of 0.4 for 3 months of the year.
Most of that land will be centred about 40 degrees of latitude where I calculkate an average solar power of 350 Watts all across the year
Thus, working through all that for 5% of Earth’s surface, I get an extra power across the year of 65 Watts per square metre
Taking that over the whole Earth gives 6.5 Watts per square metre
They say Total Anthro Forcing of 2.29
I say bollox to that, from that very simple observation and calculation even a braindead muppet, drinking coffee, listening mindless dance music in a pub in Thetford could do inside 5 minutes.
Just as I have now 😀
IOW. Simply tilling and growing crop on 5% of earth surface, as we do at the latitude we do, gets a figure 3 times more then they do and even before we start building any cities – at the rate of One New London every two months as we do.
And burning 1.5 acres of Amazon Forest every second of every day to create more tilled land.
Meanwhile and due to this utter insanity, the price of house building timber rises (in UK) by 50% tomorrow while 20,000 tons of perfectly good wood is stuffed into Drax. Every f*****g day while Good Men sit around counting the dancing angels.
I ain’t good, hence the coffee.
A naive estimate and scalar simplification of a complex phenomenon.
Rud,
As a struggling, more-or-less newb, thanks for the summary with links.
Unlike many here I think Nick’s presence and posting is a great asset to WUWT, and greatly regret the tendency of some to make snide personal remarks and accusations. This stuff devalues the site.
Nick’s great value consists in two things.
One, his continued presence makes it clear that WUWT is a properly open forum, unlike for instance Ars, the Guardian or Real Climate, where anyone posting contrary to the party line is cancelled in short order.
The second is that he regularly posts comments which challenge the local orthodoxy and which prompt critical debate. We may disagree with his comments, but they are almost always reasoned and specific to the issue and understanding why we think them wrong, if they are, advances our understanding.
My suggestion to WUWT is that Nick should be invited to do a guest post expressing his views systematically. I’d like to hear him explain whether and why he thinks there is anything legitimately called a ‘climate emergency’, what its magnitude is, assuming he thinks there is one. And very specifically what policy measures he thinks are required, and by who, to remedy it.
My own view is that there is no evidence of any emergency, and that even if there were, what the alarmist movement advocates doing would have no effect on it. And that there is a curious gap, where they fail to advocate doing what their theory implies is necessary and would be effective.
But I would be interested to read Nick giving a systematic account of the opposite view.
Michel
Yes, without any contrarian discussion all topics become an echo chamber.
But there has to some civility to the process. Snark and pure ad hominem
should not be used but for egregious behavior. Personally I just skip the
demeaning back and forth – its uninteresting – or just lose interest in the thread.
I like Michel’s idea.
Or maybe someone at WUWT can do a “Steelman argument ”
for the consensus(alarmist) side while, say, Mr Stokes does one for the skeptics?
We might find that both sides agree on more than they think.
Rud Istvan, thank you for this essay.