From History of Geo-and Space Sciences
Hist. Geo Space. Sci., 12, 97–110, 2021
https://doi.org/10.5194/hgss-12-97-2021
© Author(s) 2021.
This work is distributed under
the Creative Commons Attribution 4.0 License.

The temperature–CO2 climate connection: an epistemological reappraisal of ice-core messages
Pascal Richet
Institut de Physique du Globe de Paris, 1 Rue Jussieu, 75005 Paris, France
Correspondence: Pascal Richet Received: 24 Jan 2021 – Revised: 21 Mar 2021 – Accepted: 11 Apr 2021 – Published: 26 May 2021
Abstract
As simply based on fundamental logic and on the concepts of cause and effect, an epistemological examination of the geochemical analyses performed on the Vostok ice cores invalidates the marked greenhouse effect on past climate usually assigned to CO2 and CH4. In agreement with the determining role assigned to Milankovitch cycles, temperature has, instead, constantly remained the long-term controlling parameter during the past 423 kyr, which, in turn, determined both CO2 and CH4 concentrations, whose variations exerted, at most, a minor feedback on temperature itself. If not refuted, the demonstration indicates that the greenhouse effect of CO2 on 20th century and today’s climate remains to be documented, as already concluded from other evidence. The epistemological weakness of current simulations originates from the fact that they do not rely on any independent evidence for the influence of greenhouse gases on climate over long enough periods of time. The validity of models will, in particular, not be demonstrated as long as at least the most important features of climate changes, namely the glacial–interglacial transitions and the differing durations of interglacial periods, remain unaccounted for. Similarly, the constant 7 kyr time lag between temperature and CO2 decreases following deglaciation is another important feature that needs to be understood. Considered in this light, the current climate debate should be considered as being the latest of the great controversies that have punctuated the march of the Earth sciences, although its markedly differs from the preceding ones by its most varied social, environmental, economical and political ramifications.
How to cite. Richet, P.: The temperature–CO2 climate connection: an epistemological reappraisal of ice-core messages, Hist. Geo Space. Sci., 12, 97–110, https://doi.org/10.5194/hgss-12-97-2021, 2021.
1 Introduction
Perhaps the most important feature evidenced by the history of science is how ideas that were unanimously accepted for very long periods of time have eventually been firmly rejected. Among innumerable examples, two of the most famous are the central position of the Earth in the universe and the theory of the four elements (fire, air, water and earth) mutually transforming through exchange of their four qualities (hot, cold, dry and wet). Both theories remained uncontested for 2 millennia in spite of shortcomings that were pointed out early on. For geocentrism, the 24 h rotation of the most distant fixed stars around the pole, for instance, flatly contradicted the firm rule that, from the 27.3 days of the moon to the 29.4 years of Saturn, sidereal periods of revolution markedly increase with the distances of celestial bodies from the Earth. Similarly, the four-element theory was already criticized by Theophrastus (4th–3rd c. BCE), who pointed out that fire is “unable to persist without fuel. Hence, it seems foolish to speak of fire as a first substance and original element.”
As robust and convincing as they may appear, theories are rarely immune to various kinds of flaws that appear more or less rapidly and serve as seeds for either major reformulation or for complete rejection, as exemplified by geocentrism and the four-element theory. With the reasonable premise that we are not any smarter than our predecessors, an intriguing problem is to identify which of the currently accepted theories might fall into oblivion in the future and make historians study why their demise did not take place earlier. The goal, then, consists of spotting practical or theoretical weaknesses and assessing whether they are actually significant or not. For this purpose, epistemological approaches are most valuable because they focus on fundamental principles without the need for delving into technical details.
A thesis for which such an approach can be followed is that anthropogenic emissions of CO2 and other greenhouse gases, such as methane, have dire warming effects on the Earth’s climate. Because CO2 emissions are considered to be the single most important factor currently affecting climate, unprecedented efforts are being formulated to achieve carbon-free societies within a few decades. In view of the major social, environmental, political and economic issues raised by such a transition, two points deserve special attention. The first concerns geochemical evidence available for the greenhouse effects of CO2 (and of CH4 as well) over periods of time long enough to encompass great climate cycles. The second deals with the actual heuristic value of climate simulations, which appears to be generally acknowledged without having undergone real in-depth analyses. Both points will, thus, be reviewed critically from an epistemological standpoint in the present study. In fact, the approach followed will be justified by serious weaknesses pointed out on both counts, which will, in particular, illustrate once more why models that are now so extensively relied on in many fields of science and in public policies can lack any real demonstrative value.
2 Background
Real attention to the greenhouse effect of atmospheric carbon dioxide is not at all recent, since it had already been drawn by Fourier (1827), Tyndall (1861) and especially Arrhenius (1896). The effects of ever-increasing anthropogenic CO2 emissions became a real concern only in the 1970s, however, because anthropogenic and natural gases cannot be distinguished in the complex exchanges that are continuously taking place between the atmosphere, hydrosphere and biosphere . At that time, Broecker (1975) coined the term global warming and stated, from a review of the literature data, that a doubling of the CO2 concentration with respect to preindustrial levels would result in a global temperature increase of 2.4 ∘C (the so-called climate sensitivity).
The global warming thesis apparently received strong geochemical support when investigations of ancient ice cores revealed that past temperature increases were accompanied by marked increases in atmospheric CO2 concentrations (Lorius et al., 1990). In this respect, the extensive geochemical analyses of ices cores in Antarctica (Petit et al., 1999; Lüthi et al., 2008) remain what seem to be the most compelling direct evidence for the climate effects of greenhouse gases over a large time interval of 800 000 years (800 kyr). In addition to local temperature and atmospheric CO2 concentrations at the time of snow deposition, CH4 concentrations or sodium and dust contents have also been measured accurately. These geochemical results, thus, represent a Rosetta stone of climatology through the continuous record of this set of key parameters that they provide.
The existence of past glaciations remained controversial for several decades after it was discovered by geologists early in the 19th century (see Hallam, 1989). After another long debate that lasted until the 1970s, the control of ice ages exerted by variations in the Earth’s insolation was, in the end, firmly established from determinations of climate-sensitive parameters in deep cores of the southern Indian Ocean, namely the oxygen isotopic compositions of the tests of planktonic foraminifera and the summer sea-surface temperatures estimated from radiolarian populations (Hays et al., 1976). During the cycles identified by Milankovitch (1913), the insolation varies with time as a result of complex gravitational interactions that cause periodic changes in the parameters of the Earth’s motion around the Sun, namely the eccentricity of the orbit (main period of 100 kyr), the angle of the tilt axis (the obliquity of the ecliptic) from 22.1 to 24.5∘ (main period of 41 kyr) and the top-like precession of this axis relative to the fixed stars (main period of 26 kyr).
Within the framework of Milankovitch cycles, the relationships between past temperatures and CO2 concentrations are generally interpreted in terms of an initial orbital forcing of temperature that is then amplified by CO2 forcing, which is, in turn, amplified itself by fast atmospheric feedbacks that are and will continue to act on present and future climate (e.g., Petit et al., 1999). It is in this way that the modern anthropogenic increases in atmospheric CO2 concentrations are thought to be the main cause of global warming, a conclusion that numerical simulations of the Earth’s atmosphere aim to support in a quantitative manner (IPCC, 2013).
Curiously, however, so much attention is now given to simulation models that the fundamental sources of information provided by the ice-core records have only been partially exploited. Although inferences on deglaciation processes have, for example, been drawn from the marked time lags observed between temperature and CO2 variations (e.g., Hertzberg and Schreuder, 2016; Broecker, 2018), such analyses have not been pursued in any detail. For example, Broecker simply noted that “the interglacial CO2 peaks are wider than those for the air temperature.” Hence, the first goal of this study is to analyze the nature of these relationships to ascertain whether or not CO2 is the real climate driver of the Earth.
In view of the claimed global nature of climate change, the essentially homogeneous concentrations of atmospheric CO2 (and CH4) make it sufficient to consider a single but accurate and comprehensive record of past temperatures and CO2 contents to determine the mutual relationship between these two parameters. For this purpose, the Vostok record is ideally suited because it adequately samples the fundamental features of glaciation–deglaciation cycles, which have represented, ever since the early 19th century, the most conspicuous evidence of climate change. Over the long enough time intervals considered, one can then neglect climate variations caused such by factors such as changes in solar activity and, even on timescales of thousands of years, differences between the freezing and melting dynamics of ice sheets and their dependences on local factors.
Thanks to this specific focus, a rigorous assessment of the ice-core data can rely on pure logic and, thus, on the fundamentals of scientific reasoning as early laid down by Aristotle in the 4th century BCE (Before Common Era). The conclusions derived should, thus, be particularly robust because they are directly drawn from the ice record itself. As such, they are not restricted to a specific geographical setting, and they depend neither on any physical mechanisms assumed to be at work in the complex Sun–Earth system nor on any particular climate models and values of their respective input parameters. As surprising as it might appear, the assumed forcing of climate by CO2 is inconsistent with both the major and minor features of the source data. Unless its fallacy can be proven or the ice records were shown to be fundamentally misleading, the present demonstration points instead to, at most, a minor greenhouse effect of atmospheric CO2 (and CH4) compared with that of water vapor throughout the last 423 kyr.
Consistent with inferences recently drawn from other evidence, this conclusion contradicts models that consider the CO2 concentration in the atmosphere as being the major driver of an ongoing climate change. In this light, the current debate appears to be a new episode in a series of protracted geological controversies entertained by the bewildering complexity of the Earth as a subject of physical enquiry. In addition, the present analysis points to well-defined 7 kyr time lags between temperature and CO2 decreases at the end of the warmest episodes to which little attention seems to have been paid. It also revives the issue of a predicted new ice age in a not-too-distant future, as discussed in the 1970s when the validity of Milankovitch theory became accepted.
3 The temperature–CO2 relationship
3.1 The ice-core analyses
The ice cores drilled down to a depth of 3310 m at the Russian Vostok station have yielded the first comprehensive climate record spanning the last 423 kyr (Petit et al., 1999). Including the current one, five great cycles of glaciation–deglaciation have been revealed. The four most ancient cycles lasted from 87 to 123 kyr each, during which Antarctic temperatures changed by about 10 ∘C and atmospheric CO2 concentrations varied between 180 and 300 ppmv (parts per million by volume; Fig. 1), with the lowest values having slowed down but not impeded photosynthetic activity (Gerhart and Ward, 2010). Another record extending back to 800 kyr was subsequently obtained at the Dome C site of the European Project for Ice Coring in Antarctica (EPICA), 560 km south of Vostok (Lüthi et al., 2008). The two series of analyses are very similar for their period of overlap. Between 400 and 800 kyr, the Dome C record reveals four more glacial cycles over a 200 m depth. Possibly because of perturbations and rearrangements of the accumulated ice, however, the older material exhibits warming–cooling episodes in the form of broader features. Although these additional cycles are valuable for studying transitions between glacial and interglacial conditions, they will not be considered here because their lower resolution prevents further information from being drawn on the temperature–CO2 relationship.

Figure 1 Temperature variations (ΔT) as the cause of the changes in atmospheric CO2 concentrations throughout the last 423 kyr of the Vostok record and their control by Milankovitch insolation cycles. All data from Petit et al. (1999) are replotted in chronological order from left to right, including the insolation variations in watts per square meter (W m−2) shown at the top and reported for a reference value in mid-June at 65∘ N. The thin vertical bars emphasize the steepness of the temperature and CO2 rises at the beginning of the cycles, for which the durations are indicated (cycle V excluded because of its missing beginning). The systematically narrower peaks for temperatures compared to CO2 concentrations are particularly well exemplified at the beginning of the cycles (where related temperature, CO2 and insolation peaks are indicated by thick horizontal bars) and by the temperature and CO2 peaks (signaled by solid dots) associated with the reduced insolation changes of characteristic recurring Milankovitch configurations (dots in insolation plots placed at the precise positions of the temperature doublets).
Download
It has been stated that the Vostok series of analyses “has become a compelling target against which other records and modeling efforts are tested” (EPICA, 2004). This is the reason why the present analysis is restricted to these results. With regard to the parameters investigated, this record may be considered as spectra composed of peaks of temperature, gas concentrations and other environmental variables whose magnitudes, shapes and widths carry important information. It is, thus, useful to give a short overview of these geochemical analyses here so that the relevant technical aspects will not complicate the discussion.
The temperatures of the initial snow deposition are expressed as differences, ΔT, with respect to the present Antarctic temperature at atmospheric level. They have been determined from the D/H and 18O / 16O compositions of the ice fragments investigated through a calibration that relies on the surface temperature of the precipitation site and on the temperature above the inversion level where precipitation forms (Jouzel et al., 1997). What matters primarily in this respect is consistency, such that any minor calibration error should be immaterial because the other measurements made on the same ice fragments are referring to the same temperature scale. The sample ages were deduced from the depths of the fragments analyzed and a model of ice accumulation and flow. With uncertainties estimated to be generally as low as 5 kyr (Petit et al., 1999), the original chronology has been kept, especially as it is consistent with both the astronomical data and a revised timescale established from four different ice cores of Antarctica and Greenland (Lemieux-Dudon et al., 2010).
The reported gas concentrations are those of the air bubbles that were trapped upon compaction of the snow into the pores of the solid ice. Because of the prevailing homogeneity of the atmosphere with respect to CO2 and CH4, the concentrations measured in ice pores should reflect those of the atmosphere itself at the time of pore closure. The finite time needed for the ice pores to become closed microsystems represents a source of uncertainties, but their estimated values of a few hundred years determined from volcanic event matching between four ice cores (Gest et al., 2017) are inconsequential for the present analysis.
For either gases or both hydrogen and oxygen isotopes, the ice record may have been perturbed by physical and chemical processes such as physisorption and chemisorption, separation by gravity, formation of hydrates or reaction with ice or even cracks forming upon drilling (Raynaud et al., 1993). Vertical diffusion of isotopes and entrapped gases from regions of higher to lower concentrations in the ice column would have caused broadening on both sides of the temperature and concentration peaks, respectively. Diffusion kinetics depend on concentration gradients through gradients of chemical potentials. For CH4, the observed narrow peaks probably resulted from very slow diffusion rates ensured by a big molecular size, very low concentrations and a low chemical affinity with H2O. Even for CO2, however, diffusion appears to have been generally unproblematic in the main peaks because the increases at the beginning of the cycles are as sharp for CO2 concentrations as they are for temperatures. But the steepest chemical potential gradients should have prevailed for hydrogen and oxygen isotopes, whose sharp relative variations resulted in the apparent noise and numerous temperature spikes apparent in the most recent data. Interdiffusion of hydrogen and oxygen isotopes could, thus, have been the reason why the noise and spikes are averaged out back in time in the record without having affected the overall patterns (Fig. 1). If differences in either CO2 contents and temperatures are found for the same period at different sites, the highest (and lowest) values should, thus, be considered to be closest to the original parameters since all subsequent perturbations of ice columns could have caused only some smoothing out of CO2 and isotopic gradients. In this respect, the great sharpness of the 300 ppm (parts per million) CO2 maximum of Fig. 1 makes this peak a case in point.
3.2 Geochemical inferences
With the obvious exception of the ongoing cycle I, which began 18 kyr ago, all others follow a common pattern whereby a sharp glacial–interglacial transition is followed by a series of warming–cooling episodes of smaller magnitudes (Fig. 1). Even without ever having heard of Milankovitch cycles, one would readily draw firm conclusions from the quasi-periodicity of these cycles and their common patterns. In logical order, these inferences are as follows:
- i.The major peaks were necessarily under astronomical control because no natural phenomena on Earth exhibit anything approaching, even very distantly, such observed regularities with periods of tens of thousands of years.
- ii.This astronomical control of glacial cycles was necessarily exerted through variations in the energy received by the Earth. This energy could have been emitted only by the Sun. At constant Sun power, its amount itself depends, in a complex manner, on a great many local and seasonal parameters, such as the extent of ice sheets.
- iii.In the absence of photochemical production of CO2 in the atmosphere, increases in the amount of heat transferred by solar radiations necessarily translate directly into either temperature increases or endothermic phase changes (e.g., ice melting) at the Earth’s surface.
- iv.Acting also first on temperature and ice volume, the opposite changes take place when the Earth’s net radiation energy budget becomes negative.
- v.The temperature variations themselves induce concentration changes of chemical species in the atmosphere; for example, CO2, through variations of its overall solubility in seawater and the temperature dependence of the concentrations of carbonate species, or CH4, through adjustment of biological activity.
- vi.Barring any exceptional event, such as the impact of a giant meteorite or a mega-volcanic eruption, whose occurrences are not apparent in the Vostok record, temperature changes were, thus, necessarily the triggering causes of all episodes. In accordance with geological evidence (Lane et al., 2013), the signature of even the most explosive volcanic event of the Quaternary, the Toba super-eruption 75 kyr ago, could not be found in the record.
- vii.As indicated by the jagged nature of the record, temperature and CO2 fluctuations constantly took place with a variety of intensities and timescales, with the shortest ones appearing as numerous spikes superimposed on the most recent temperature peaks.
- viii.Since there is no reason why temperature spikes would have been less frequent or less intense in the most ancient than in the most recent part of the temperature record, the contrast between the jagged temperature and smoother CO2 records was unlikely restricted to the most recent cycle. Instead, it existed in all cycles before the temperature record was progressively smoothed out back in time as noted above.
In terms of Milankovitch cycles, the particular latitude and time of the year most relevant for calculating insolation changes in the past have long been extensively debated (e.g., Imbrie and Palmer Imbrie, 1979). Much work has been done to determine, with spectral analysis, how the complex interplay of astronomical periodicities determines climate changes (e.g., Crucifix et al., 2006). The critical effect of the instantaneous solar radiation power during summer solstices has, in particular, been stressed as it correlates with the derivative of the ice volume (Edvardsson et al., 2002). But these features do not need to be reviewed here; to interpret the message carried by the ice record on the temperature–CO2 relationship over long timescales, to which this study is devoted, it will suffice to state that, for obvious consistency reasons, the insolation calculations reported by Petit et al. (1999) for mid-June and 65∘ N have been used (Fig. 1). Although obviously not perfect, the strikingly good match of the major temperature and CO2 peaks with the insolation maxima noted by Petit et al. (1999) in particular confirms the good accuracy of the ice-core dating.
4 Epistemological analysis
4.1 The atmospheric CO2 concentration: a plain temperature effect?
Despite the aforementioned inference (iii), the remarkable proportionality between the amplitudes of the increases in temperatures and CO2 concentrations at the beginnings of the glacial–interglacial transitions has led to ascertain which of these two parameters controlled the other (Petit et al., 1999). For the sharp initial rises, determining a time difference between the two series of observations is problematic, particularly because of the time needed to achieve ice pore closure. Further analyses and interpretations have indicated that CO2 increases lagged by less than 1 kyr behind the initial temperature increases (Fisher et al., 1999; Caillon et al., 2003; Vakulenko et al., 2004). Further work has pointed to still shorter time lags (Pedro et al., 2012) or even to a practical synchronicity (Parrenin et al., 2013). This close coupling is in agreement with the fast rates at which atmospheric CO2 adjusts itself to changes in the ocean surface temperature as observed in a study covering the 1980–2011 period (Humlum et al., 2013).
To investigate the temperature–CO2 relationships more closely, it is useful to adopt, from the spectroscopic literature, the concept of full width at half maximum of a given peak to quantify the time intervals of the glacial–interglacial transitions. For this purpose, the thin vertical bars marking in Fig. 1 the beginning of each cycle have been used to determine the minima of the CO2 and temperature peaks in an objective and consistent way. As indicated by the thick horizontal bars in Fig. 1, these full widths range from about 7 to 16 kyr for temperature and from 14 to 23 kyr for CO2. Regardless of the particular Milankovitch configuration to which they are associated, all other peaks are also narrower for temperature than for CO2, with the latter lagging behind the former by 1.3 ± 1.0 kyr (Mudelsee, 2001). In all instances, identifying the cause and the effect is, in principle, straightforward because an effect cannot last for a shorter period of time than its cause, whereas the converse can obviously hold true. If one assumes that CO2 increases were causing temperature rises, then the width differences in their respective signals would make one wonder why, after some time intervals, high CO2 levels or even further steps of CO2 increases (e.g., cycle II) would result instead in temperature decreases.
Very long ago, Aristotle (4th c. BCE) discussed such situations in his celebrated Metaphysics. As he pointed out, believing “the same thing to be and not to be” implies having “contrary opinions at the same time.” With his Principle of Non-Contradiction, Aristotle further stated that “the same attribute cannot at the same time belong to and not belong to the same subject in the same respect.” As he also explained, without having ever been contradicted since then in scientific studies, “it is for this reason that all who are carrying out a demonstration refer it to this as an ultimate belief; for this is naturally the starting point even for all the other axioms.”
The fact that the peak widths are systematically larger for CO2 than for temperature thus implies that the variations in CO2 concentrations were driven by temperature changes throughout all cycles and not only at their onsets. Of particular interest in this respect are the peaks signaled by one or two solid dots in Fig. 1. Because, in each instance, a single CO2 peak correlates with a temperature doublet, such features would again plainly violate the non-contradiction principle if variations in CO2 concentrations were considered as causes and temperature changes as effects.
Making physical sense of this conclusion is straightforward. The total amount of CO2 in the atmosphere is only a tiny fraction of that present in the ocean (Lee et al., 2019). Even though the acid base properties of CO2-bearing aqueous solutions and the biological role of carbonate and bicarbonate ions make the picture difficult to unravel quantitatively (see Michard, 2008), temperature rises cause an overall decrease in the CO2 solubility in the ocean and, correlatively, an increasing concentration of atmospheric CO2.
In this respect, the differences observed in the peak widths of Fig. 1 reveal an important timescale contrast in each cycle between the very strong initial glacial–interglacial transition and the subsequent episodes. With their relatively small temperature and CO2 variations, these episodes display reduced time lags of the order of 1 kyr only between these two parameters, which are similar to the timescales usually assigned to the global homogenization of the ocean. In these cases, exchange with the atmosphere thus appears to proceed nearly as swiftly as during the warming period, which is consistent with the rapid atmosphere–hydrosphere equilibration (Humlum et al., 2013). For the strong glacial–interglacial transitions, the widths of the temperature peaks widely vary from 7 to 16 kyr (Fig. 1), but their differences with the widths of the CO2 peaks nonetheless have the same large value of 7 kyr. If not coincidental, this common time lag suggests much longer timescales than usually assumed for thorough homogenization of the ocean after large temperature decreases. Such timescales have been related to changes in the land ice coverage and buildup of the terrestrial biosphere (Fisher et al., 1999). Contrary to the suggestion made by these authors, however, these modifications would not depend on the duration of the preceding warm period.
4.2 The CO2 feedback
The simple temperature–CO2 relationship described in the previous section is not commonly considered, however, because it ignores greenhouse effects. To conform to the Arrhenian paradigm, Petit et al. (1999) took over the idea that the initial rise in the atmospheric CO2 concentration (induced by temperature increases at the onset of a Milankovitch cycle) in turn amplifies the initial orbital forcing and is itself amplified by atmospheric feedbacks. Epistemologically, such a four-step process must be examined in the light of the principle of parsimony, which was also first stated by Aristotle in his Topics. “It is also a fault in deduction when a man proves something through a long chain of steps, when he might employ fewer steps.” To be justified, therefore, such additional steps require unquestionable evidence.
Feedbacks are indeed possible, where a cause alternatively becomes an effect and an effect a cause. By definition, however, such a mechanism implies the synchronicity of causes and effects to within the timescales of their mutual interactions. In the Vostok case, the CO2 feedback would reinforce temperature increases during the warming periods but also, reciprocally, temperature decreases during the cooling stages of the Milankovitch cycles. From the dual way in which the feedback would work, temperature decreases and increases should thus be similar for the same concentrations of greenhouse gases regardless of the residence times of these gases in the atmosphere.
Now, the synchronicity of causes and effects is well respected only during the warming periods, where the time lag between the temperature and CO2 increases is very small. As already emphasized, in contrast, synchronicity clearly breaks down during the cooling periods, and this is most clearly so when temperatures sharply decrease while CO2 concentrations remain high (Fig. 1). This feature is most obvious in the glacial–interglacial transition of cycle III, where the temperature peak is narrow and symmetrical whereas the CO2 peak exhibits the large shoulder representing the aforementioned 7 kyr time lag. The feature is also clearly seen in cycle II, where the large jagged CO2 peak contrasts with the rapidly decreasing magnitude of the temperature peak. Hence, the fact that temperature decreases do not depend in any noticeable way on CO2 concentrations in all cycles clearly demonstrates that the synchronicity required by the feedback mechanism is lacking.
The CO2 feedback mechanism is, in addition, contradicted by the marked contrasts between the broad maxima in CO2 concentrations and doublets of sharp temperature peaks signaled by solid dots in Fig. 1. As indicated by the data for cycle IV, these contrasts are unlikely due to a resolution difference between the two parameters. That they are not coincidental is revealed by their systematic observation only in those parts of Milankovitch cycles where insolation changes are the smallest (Fig. 1). Also striking is the fact that, as shown by the dots included in the insolation plots at the top of Fig. 1, the temperature doublets are found, each time, at similar places within insolation cycles. Put differently, the dotted peaks of Fig. 1 again demonstrate that temperature is sensitive to insolation changes but not to CO2 concentration, a conclusion also consistent with the contrasting the jagged–smooth contrast of temperature and CO2 records.
Regarding CO2 feedback, the CH4 concentrations raise yet another difficulty that may be even more fundamental. Like those of CO2, their variations could not be directly caused by changes in the solar energy transferred to the Earth’s atmosphere. They necessarily resulted from temperature changes. If CO2 contents had exerted a noticeable feedback on temperatures, then the peak widths of the reported CO2 and CH4 concentrations should be highly correlated. Such a causal correlation is actually nonexistent because, in marked contrast with the CO2 contents, the CH4 concentrations show no time lags whatsoever with respect to temperatures. Instead, these CH4 concentrations correlate remarkably well with temperatures, as made clear by the fact that these two parameters have nearly the same peak widths (Fig. 2). More recent data have even revealed closer still correlations (e.g., Buizert et al., 2015). Ironically, this clear synchronicity might make CH4, and not CO2, a potential match for a feedback mechanism. But CH4 concentrations ranged from only 0.4 to 0.7 ppmv, which were about 500 times smaller than those of CO2 (Fig. 1) and from 3 to 4 times lower than the current values. If really significant in the past, a methane feedback would then cause today’s temperatures to be considerably higher than observed. Therefore, the ice-core data conversely also rule out any noticeable influence of methane.

Figure 2 The remarkable correlation between the variations in temperatures and atmospheric methane concentrations in the Vostok record. Data from Petit et al. (1999) are replotted in chronological order from left to right.
5 Implications
5.1 The CO2 conundrum
As a rule, correlation does not necessarily imply causality. In marked contrast, a lack of correlation resolutely rules out any causality. Reconciling the driving role of CO2 assigned by climate models with the opposite conclusions drawn from the ice-core record thus seems fraught with considerable difficulties. Hence, the ice-core results shift the burden of proof of any CO2 influence on temperature to the proponents of the feedback mechanism and make, in addition, any climate sensitivity determinations problematic.
Current climate models are, in practice, not open to falsifiability in Popper’s (1959) sense because they are so complex, involve so many physical parameters, rely on so much data for their design and assessment, lack proper error propagation estimations and suffer from the fact that the observations they aim at reproducing cannot be changed at will to check their responses under widely different conditions. Instead, models are claimed to be reliable thanks to their sound physical basis, which is not supported by the present analysis, whereas recourse is also made to the subjective notion of consensus to assert their validity. Whether or not such a consensus prevails here does not need to be discussed at length because this notion is epistemologically irrelevant. As already alluded to, the history of science is nothing more than a long stroll through the cemetery where ideas that were overwhelmingly accepted are now resting in peace.
For the present issue, the point has been remarkably well exemplified in the late 19th century and then again in mid-20th century by the consensus successively reached for, then against and, finally, for the astronomical control of ice ages. As stated for the latter period by Imbrie and Palmer Imbrie (1979), “during the 1930s and 1940s, most European geologists were won over by the Milankovitch theory” and “the majority of scientists continued to favor the astronomical theory as late as 1950. But the early 1950s saw a dramatic about-face since, by 1955, the astronomical theory was rejected by most geologists.” The case against became particularly strong when the new technique of 14C dating “revealed a pattern of climatic change that was at variance at almost every point with the astronomical theory.” Shortly before Hays, Imbrie and Shackelton published their landmark study (Hays et al., 1976), it followed that, according to Imbrie and Palmer Imbrie, “by 1969, the majority of scientists were sufficiently impressed with the radiocarbon evidence against the Milankovitch theory to eliminate the idea as a serious contender in the ice age sweepstakes.”
In contrast to climate simulations, the present analysis is open to falsifiability since its fallacy, if any, could be pointed out without ambiguity. In this respect, one may stress that the approach followed here directly integrates, with the appropriate weights, all factors relevant to the problem and that it is totally independent of any assumed physical mechanisms, interactions surmised between climate variables, considerations on the CO2 cycle, statistical analyses of selected sets of data assumed to be representative of the problem and any other simulation features.
A cardinal rule in science is to reject a hypothesis that clearly contradicts the experimental findings it is supposed to account for, especially if it also contradicts the most fundamental tenet of science, the principle of non-contradiction, which is “the most certain of all” in Aristotle’s words. If the present analysis cannot be refuted, one should then reject the Arrhenian paradigm and conclude (i) that changes in the concentration of atmospheric CO2 up to 300 ppm had minor effects at most on temperatures during the past 423 kyr, (ii) that, as described in Sect. 4.1, the concentration of atmospheric CO2 simply adjusted during this period to the prevailing temperature conditions at the Earth’s surface, whose variations were mainly determined by insolation changes during Milankovitch cycles, and (iii) that significant contributions of CO2 and CH4 to temperature changes at the Earth’s surface remain unsubstantiated by direct, independent evidence.
Entertaining the possibility that temperature rises along Milankovitch cycles could have been triggered by increasing CO2 concentrations is in fact surprising as it would violate fundamental thermodynamics. As known since Planck’s work, radiation represents not only energy but also entropy. Regardless of the particular ways in which radiation entropy is transferred to the Earth’s surface and atmosphere, or lost from them, the basic fact is that temperature and entropy are the intensive and extensive conjugate variables of thermal energy, respectively. Under all circumstances, any temperature (or, more generally, enthalpy) changes of a system are thus necessarily driven by an entropy change (see Richet, 2001). This is another way of stating that greenhouse gases can affect climate only via thermal changes. As such, their effects would manifest themselves in any temperature record, which must be considered in this respect as thermograms in thermal analyses.
Obviously, one could alternatively claim that other factors than CO2–temperature interactions are involved in the very complex climate problem; if so, however, an important aspect would be that changes in atmospheric CO2 contents of tens or even hundreds of parts per million certainly could not directly affect ice volume or tipping points related to patterns of oceanic circulation, to name a single important feature, but could act only through thermal changes as described above. The conclusion, thus, remains that it would not make sense to place so much emphasis on the effects of CO2 in either climate models or on emission reductions in environmental policies.
For ice cores, a first key factor that ensures reliable assessments of temperatures with respect to CO2 and CH4 concentrations is the determinations of the three parameters for the same ice fragments of known ages. A second factor is the fact that the temperature variations of up to 12 ∘C during climate cycles observed in polar regions are much greater than the 2–3 ∘C that affected the entire Earth, which accounts for the much higher resolution of the polar records. And a third factor is the large timescales of these observations, which are more than 1000 times longer than those of climate simulations and of available measurements of atmospheric temperatures and gas concentrations. Of particular importance is also that the 423 kyr considered here are long enough to encompass four complete glacial cycles, for which short-term fluctuations can be neglected, but short enough to not be affected by other factors, such as changes in continent positions, that play an important role over very long timescales. In addition, the lack of correlations that support CO2 forcing is immune from the inevitable biases that arise when unrelated sets of data are used for different parameters, especially when some are derived indirectly from proxy studies or when investigations deal with short periods of time.
In the atmosphere, the maximum CO2 concentration of 300 ppm found in the Vostok record was reached again in the 1910s. The main effect of such high concentrations was simply to increase considerably the subsequent CO2 time lag behind the temperature leads, without significant effects on past climate. Hence, it is doubtful that any significant global warming could have been caused by human emissions during most of the 20th century as a result of the additional 50 ppm CO2 increase observed until the 1980s. Given the lack of evidence for feedback mechanisms particularly well demonstrated by the CH4 record, it in fact remains to be determined from which level, if any, CO2 concentrations would begin to become relevant and to ascertain the dire consequences of current CO2 levels. The principle of parsimony thus points to any current warming as being just one of the recurrent fluctuations clearly recorded as spikes in the last two climate cycles, which have not yet been averaged out in the Vostok record (Fig. 1) and, surprisingly, seem to be overlooked in discussions of short-term temperature variations. As often noted, it would in fact be an arbitrary assumption to posit that a system as chaotic and as highly heterogeneous as the Earth, which must be described in terms of complex sets of coupled nonlinear equations, would always evolve in a smooth manner over long periods of time.
Probably the most in-depth geochemical discussion of glacial cycles and climate effects of CO2 has been published by Broecker (2018), who pointed out that some important features of past climate could not be accounted for in terms of CO2 variations. Broecker nonetheless stated that “the geologic record makes a strong case that CO2 has been instrumental in driving past climate changes”, adding that “as made clear by the record for the last 150 kyr”, CO2 “has not acted alone” because insolation cycles, ocean circulation or reorganization and latitudinal temperature gradients also contributed. Although less important than insolation cycles, the other factors mentioned by Broecker certainly have to be taken into account in more detailed pictures of climate change. Overall, however, the fundamental importance of the Antarctica records rests on the fact that glaciation–deglaciation cycles are the most conspicuous features of climate changes and that the ensuing sea level variations necessarily affect the whole planet. Of particular interest in this respect is the synchronicity of the episodes of warming and cooling found over long timescales between Greenland and Antarctica (Pedro et al., 2011). In addition, the remarkable synchronicity of temperature and methane variations points to a lack of major latitudinal time lags, since the methane budget appears largely controlled by tropical sources and sinks (Loulergue et al., 2008) and not by interactions with seawater (Reeburgh, 2007).
5.2 The threat of circular reasoning
Petit (2013) asserted that the amplifying role of CO2 on climate change was first demonstrated by the Vostok analyses and added that these results were then “very rapidly taken into account by IPCC, which recently concluded that human activities are responsible for the current climate warming.” The importance of the Vostok results has, thus, been central in the current debate, even though it is now commonly emphasized that global warming is demonstrated instead from a quantitative understanding of the physical mechanisms through which temperatures and CO2 concentrations are related in advanced climate models.
Regarding their Vostok analyses, Petit et al. (1999) stated that “results from various climate simulations make it reasonable to assume that greenhouse gases have, at a global scale, contributed significantly (possibly about half, that is 2–3 ∘C) to the globally averaged glacial–interglacial temperature change.” That this statement is clearly contradicted by the present analysis in turn invalidates those climate simulations from which it derived. The CO2 feedback supposedly shown by the ice-core results thus appears to exemplify a rather common situation whereby a preconceived notion of causality has led to the misinterpretation of the data – perhaps also because these results were not plotted as a function of time but of depth, which may carry the illusion that CO2 peaks systematically precede temperature peaks. This situation illustrates the peril of transposing theoretical concepts to a very complex system when the observational support is incomplete or when an independent, rigorous assessment of the validity of the procedure is lacking. In other words, interpreting the CO2 and temperature records of ice cores in the light of climate models has represented an incorrect methodological leap. Ironically, any claim that models accurately reproduce the reported climate evolution since the late 20th century would rather illustrate their spurious nature, and not prove their validity, if the temperature rises of this period are not caused by increases in CO2 concentrations.
There is, additionally, a great epistemological weakness in climate models because the timescales of 150 years at most they consider with direct or indirect observations are tremendously short with respect to those of even the shortest fluctuations exhibited by the climate record (Fig. 1). The situation is analogous to that one would face in attempts made at understanding the basic physics of tides through focusing on a single ripple at the water surface and not on entire ebbing and waning cycles of variable amplitudes. The reliability of climate models should thus be ascertained on the basis of their ability to match at least the main features of the latest glacial cycles, beginning with the sharp glacial–interglacial transitions. Given the fundamental role assigned to greenhouse gases, any specific model cannot be considered valid as long as the width differences between temperature and CO2 peaks are not accounted for quantitatively.
As a matter of fact, current models suffer from the circular nature of the reasoning behind their assumed feedback mechanism whereby, in the last analysis, the predicted influence of CO2 simply conforms to the posited effects in a situation where the anthropogenic increases in CO2 concentrations happen to accompany those of temperatures. In a kind of reductio ad absurdum, a similar situation would be encountered if the quantitative correlation observed between the recent increases in atmospheric CO2 contents and the geographic displacement of the magnetic north pole (Fig. 3) were interpreted as a causality relationship – which could of course not be considered seriously in view of a complete physical implausibility!

Figure 3 The strongly accelerating displacement of the magnetic north pole (after Witze, 2019). Similar distances were traveled from 1900 to 1980 and from 2000 to 2020, correlating quantitatively (but of course coincidentally), during both periods with a ∼40 ppm increase in atmospheric CO2 concentration (Hawaii Observatory, 2019).
In a well-known statement, the Latin writer Macrobius (fl. early 5th c. BCE) long ago illustrated such a circularity when he explained why the place of the Earth was at the center of the world. As he asserted, in a way reminiscent of complex feedbacks, “those reasons are truly incontrovertible which are mutually confirmed, the one substantiating the other and each arising from the other, never abandoning each other’s support.” Then, Macrobius concluded that “with such bonds nature has held the Earth fast: all things tend toward it since, being the middle, it does not move; again, it does not move because it is at the bottom; finally, it must be at the bottom since all things tend towards it.”
5.3 Earth sciences – a pitfall factory
To an Earth scientist, the ongoing climate debate is a reminder of the long series of controversies to which geology has been especially prone (see Hallam, 1989). The huge size, very long timescales, complexity and large number of parameters that need to be considered for the Earth system as a whole have more than once clearly misled eminent scientists too committed to their own physics. The claim repeatedly heard that science has settled, for good, the climate problem particularly reminds the observer of two famous debates. Regarding continent motion, the greatly influential mathematician and theoretical geophysicist Jeffreys (1929) was right when he claimed that, in a rigid Earth, “secular drift of continents relative to the rest of the crust, such as have been maintained by Wegener and others, are out of the question.” But he was nonetheless quite wrong because he did not envision convection in a highly viscous mantle, which was proposed at the same time as a viable mechanism by Holmes (1928).
Also relevant is the climax of the long controversy on the antiquity of the Earth at the end of the 19th century. At that time, an age lower than 100 million years was apparently demonstrated with the utmost rigor, i.e., without any fit parameters, in four completely independent ways, namely from the cooling history of the Earth from an initially molten state, from the age of the Sun, as constrained by the first law of thermodynamics, from the time needed by the world ocean to acquire its saltness and from the time at which the Moon separated from the Earth, as calculated from astronomical considerations (see Richet, 2007). Tait (1885), a well-known physicist and close friend of Kelvin, then exemplified the theoretician’s self-confidence by claiming, “We say – So much the worse for geology as at present understood by its chief authorities, for, as you will presently see, physical considerations from various independent points of view render it utterly impossible that more than ten or fifteen millions of years can be granted.”
Perhaps even more relevant was the clear consensus that was reached in the 1890s when geologists evaluating the age of the Earth found ways to comply, at least partially, with the physicists’ requirements; by adjusting their estimated thicknesses of the stratigraphic column and average rates of sedimentation, they did arrive at ages ranging from 26 to 100 million years. Hence, the great irony of the situation was that this consensus, spontaneously reached – i.e., without any funding, social or political pressures – to conform to the newly prevailing physical paradigm, was shattered into pieces not even 2 decades after Tait’s utterance when radioactive dating began to point to an age of billion years instead (see Richet, 2007).
In contrast to the context of previous debates, new fundamental principles unlikely need to be discovered to improve climate understanding. As indicated by the limitations of current climate models pointed out over the years (e.g., Lindzen, 1997; Christy et al., 2018; Lewis and Curry, 2018; McKitrick and Christy, 2020; Mitchell et al., 2020), the issue at hand is rather to determine which of the basic assumptions made and calculation procedures used are either too approximate or even incorrect and what factors and interactions have been omitted or not been properly taken into account in simulations.
The question is in no way new, since various suggestions have already been made in this respect. Without needing to discuss here the validity of such approaches, it will suffice to state (i) that the constantly lagging effects of CO2 concentrations with respect to the rate of change of the global ice have already been pointed out (e.g., Roe, 2006); (ii) that the radiative forcing of CO2 and CH4 has been found to be several times smaller than changes in solar insolation at climatically sensitive zones and latitudes (Soon, 2007); (iii) that doubling the current concentrations of CO2 and CH4 would increase their forcings by a few percent, according to recent calculations made for the five most abundant greenhouse gases from a comprehensive set of over 333 000 rovibrational bands (Van Wijngaarden and Happer, 2020); (iv) that the greenhouse mechanisms usually assumed have indeed been strongly called into question (e.g., Chilingar et al., 2008; Allmendinger, 2017; Hertzberg et al., 2017; Nikolov and Zeller, 2017); (v) that climate change has been little investigated from the fundamental thermodynamic standpoint of entropy production in the atmosphere (Delgado-Bonal, 2017); (vi) and that the overall picture has also been disputed on a broader perspective (e.g., Hertzberg and Schreuder, 2016; Fleming, 2018; Frank, 2019). Following, for example, Blaauw (2017), it would be particularly interesting to ascertain whether simpler models free from greenhouse gas effects would yield more reliable results for time spans longer than those currently considered.
5.4 Toward a new ice age?
As noted above, an important feature that must be accounted for in terms of dynamical responses is the constant 7 kyr time lag between the temperature and CO2 peaks at the interglacial–glacial transitions (Fig. 1). It is much longer than the equilibration times for CO2 intake by the world ocean, but its constant value points to processes of an overall reproducibility that could have not been expected.
In terms of Milankovitch cycles, another problem of special importance is to find a quantitative explanation for the observed 1:2 ratios of the temperature peak widths between cycle III and cycles II and IV. The current transition I in Fig. 1 made the invention of agriculture possible and led to the beginnings and expansion of civilization. At 13 kyr, however, the full width at half maximum of its temperature peak is already much greater than the 7 kyr of cycle III and is approaching the 15–16 kyr of cycles II and IV, which seriously raises the issue of the next ice age.
When the validity of Milankovitch cycles was beginning to be acknowledged, it was commonly assumed that temperatures had been decreasing since the late 1930s (see Imbrie and Palmer Imbrie, 1979). That cooling lasted much longer than warming in great climate cycles was ascertained from his loess studies by Kukla (1970), an author who was also a proponent of the cooling thesis. Hence, Kukla and Matthews (1972) suggested, from expanding snowbanks around Baffin Island, peak ice hindering navigation around Iceland or warmth-loving animals retreating southward, that “the natural end of our warm epoch is undoubtedly near when considering a geological timescale.”
In the current context of global warming, such fears of a new ice age are retrospectively taken very lightly. According to a model based on a relationship between boreal summer insolation and CO2 air concentration, the current interglacial period would probably last for 50 000–100 000 more years, depending on the amount of anthropogenic CO2 emissions (Ganopolski et al., 2016). Even if CO2 forcing is assumed, however, then the reliability of such a model should first be established from its ability to reproduce quantitatively the respective durations of past ice ages.
As long as such an assessment is lacking, one can assume, instead, that the high sensitivity of climate to minor features of Milankovitch cycles (Fig. 1) makes it a priori unlikely that the present warm period should last considerably longer than the former ones. In this respect, the important difference between now and the situation in the 1970s is that the succession of eight major glacial cycles during the last 800 kyr is so well established that the precise chronology yielded by the ice-core records (Fig. 1) suggests that an onset of global cooling might be observed within less than a couple of millennia from now. By then climate models may be expected to have reached the level of confidence needed to make accurate predictions. It, nonetheless, remains that the threat to be faced with a new incoming ice age would be of the extraordinary magnitude already envisioned in the 1970s and would make current fears of global warming look quite insignificant.
6 Postface
Regardless of any particular interpretation of the climate record, it seems appropriate to give the last word to the famous naturalist Georges-Louis Leclerc, Earl of Buffon (1749). Himself a mathematician by training, Buffon (1749) voiced a strong warning very early on about the misuses of what are now called models by expounding in the Initial Discourse of his monumental Natural History the “difficulties one finds when attempting to apply geometry or calculations to physical subjects that are too complicated.” As he noted, one has “to strip the subject from the majority of these qualities, to produce an abstract being that no longer resembles the actual being” and, after much reasoning and calculation, one projects an “ideal result onto the real subject, and this is what produces countless falsehoods and errors.” Hence, Buffon concluded, “the most delicate and most important point in scientific studies” is “to distinguish well between what there is of the real in a subject from that which we add to it arbitrarily as we consider it: to recognize clearly which properties belong to the subject and which properties we only imagine it to have.”
Data availability
No data sets were used in this article.
Competing interests
The author declares that there is no conflict of interest.
Disclaimer
The author has never had any professional relationship with oil, gas or coal companies, nor has he had any private interest in them, and he has never requested or received funding from any environmentally related agency or organization. The present study simply represents the outcome of an old-fashioned search for truth – something that “is sunk in the depths”, as aptly understood 2.5 millennia ago by Democritus (5th–4th c. BCE), the celebrated Greek atomist.
Acknowledgements
The author gratefully thanks Kristian Schlegel and Giovanni Gregori for their interest in this study, Martin Hovland, Richard Lindzen and two other anonymous HGSS reviewers, for their constructive and thoughtful positive comments on the paper, and also Roland Hellmann, Wayne Nesbitt and colleagues much too numerous to be listed here, for the fruitful discussions, critical examination of the arguments and helpful comments on the paper. Thanks also goes to the late Wally S. Broecker, whose papers put him on the right track, and the technicians, engineers and scientists involved in ice-core research for their outstanding geochemical achievements.
Review statement
This paper was edited by Giovanni P. Gregori and reviewed by Richard Lindzen, Martin Hovland, and two anonymous referees.
References
Allmendinger, T.: The refutation of the climate greenhouse theory and a proposal for a hopeful alternative, Environ. Pollut. Climate Change, 1, 19 pp., 2017.
Aristotle: Metaphysica [translation: Ross, W. D.: Metaphysics, in Aristotle Complete Works, edited by: Barnes, J., vol. II, Princeton University Press, Princeton, 1552–1728, 1984], 4th c. BCE.
Aristotle: Topica [translation: Pickard-Cambridge, W. A.: Topics, in: Aristotle Complete Works, edited by: Barnes, J., vol. I, Princeton University Press, Princeton, 166–277, 1984], 4th c. BCE.
Arrhenius, S. V.: On the influence of carbonic acid in the air upon the temperature of the ground, Phil. Mag., 41, 237–276, 1896.
Blaauw, H. J.: Global warming: Sun and water, Energy Environ., 28, 468–483, https://doi.org/10.1177/0958305X17695276, 2017.
Broecker, W. S.: Climate change: Are we on the brink of a pronounced global warming?, Science, 401, 460–463, 1975.
Broecker, W. S.: CO2: Earth’s climate driver, Geochem. Perspect., 7, 117–196, 2018.
Buffon, G.-L.: Leclerc, count of Histoire naturelle, Premier discours, English translation of the excerpt, p. 352, 1749.
Buizert, C., Cuffey, K. M., Severinghaus, J. P., Baggenstos, D., Fudge, T. J., Steig, E. J., Markle, B. R., Winstrup, M., Rhodes, R. H., Brook, E. J., Sowers, T. A., Clow, G. D., Cheng, H., Edwards, R. L., Sigl, M., McConnell, J. R., and Taylor, K. C.: The WAIS Divide deep ice core WD2014 chronology – Part 1: Methane synchronization (68–31 ka BP) and the gas age–ice age difference, Clim. Past, 11, 153–173, https://doi.org/10.5194/cp-11-153-2015, 2015.
Caillon, N., Severinghaus, J. P., Jouzel, J., Barnola, J.-M., Kang, J., and Lipenkov, V. Y.: 2003. Timing of atmospheric CO2 and Antarctic temperature changes across termination III, Science, 299, 1728–1731, 2003.
Chilingar, G. V., Sorokhtin, O. G., Khilyuk, L., and Gorfunkel, M. V.: Greenhouse gases and greenhouse effects, Environ. Geol., 58, 1207–1213, https://doi.org/10.1007/s00254-008-1615-3, 2008.
Christy, J. R., Spencer, R. W., Braswell, W. D., and Junod, R.: Examination of space-based bulk atmospheric temperatures used in climate research, Int. J. Rem. Sens., 39, 3580–3607, 2018.
Crucifix, M., Loutre, M. F., and Berger, A.: The climate response to the astronomical forcing, Space Sci. Rev., 125, 213–226, 2006.
Delgado-Bonal, A.: Entropy of radiation: the unseen side of light, Sci Rep., 7, 1642, https://doi.org/10.1038/s41598-017-01622-6, 2017.
Democritus: Testimony D.K. 68 B117/184a [translation: Taylor, C. C. W.: The Atomists Leucippus and Democritus: Fragments, A Text and Translation, Univ. Toronto Press, Toronto, 1999], 5th–4th c. BCE.
Edvardsson, S., Karlsson, K. G., and Engholm, M.: Accurate spin axes and solar system dynamics: Climatic variations for the Earth and Mars, Astron. Astroph., A384, 689–701, 2002.
EPICA: community members: Eight glacial cycles from an Antarctic ice core, Nature, 429, 623–628, 2004.
Fisher, H., Wahlen, M., Smith, J., Mastroianni, D., and Deck, B.: Ice core records of atmospheric CO2 around the last three glacial terminations, Science, 283, 1712–1714, 1999.
Fleming, R. J.: An updated review about carbon dioxide and climate change, Environ. Earth Sci., 77, 13 pp., 2018.
Fourier, J.: Mémoire sur les températures du globe terrestre et des espaces planétaires, Mém. Acad. Sci., 7, 569–604, 1827.
Frank, P.: Propagation of error and the reliability of global air temperature projections, Front. Earth Sci., 7, 223, https://doi.org/10.3389/feart.2019.0223, 2019.
Ganopolski, A., Winkelmann, R., and Schellnhuber, H. J.: Critical insolation-CO2 relation for diagnosing past and future glaciation, Nature, 529, 200–203, 2016.
Gerhart, L. M. and Ward, J. K.: Plant responses to low [CO2] of the past, New Physiol., 188, 624–695, 2010.
Gest, L., Parrenin, F., Chowdhry Beeman, J., Raynaud, D., Fudge, T. J., Buizert, C., and Brook, E. J.: Leads and lags between Antarctic temperature and carbon dioxide during the last deglaciation, Clim. Past Discuss. [preprint], https://doi.org/10.5194/cp-2017-71, 2017.
Hallam, A.: Great Geological Controversies, Oxford Univ. Press, Oxford, 1989.
Hawaii Observatory: Atmospheric CO2 at Mauna Loa Observatory, available at: https://www.esrl.noaa.gov/gmd/odop/mlo/ (last access: January 2021), 2020.
Hays, J. D., Imbrie, I., and Shackelton, N. J.: Variations in Earth’s orbit – pacemaker of ice ages, Science, 194, 1121–1132, 1976.
Hertzberg, M. and Schreuder, H.: Role of atmospheric carbon dioxide in climate changes, Energ. Environ., 27, 785–797, https://doi.org/10.1177/0958305X16674637, 2016.
Hertzberg, M., Siddons, A., and Schreuder, H.: Role of greenhouse gases in climate changes, Energ. Environ., 28, 530–539, https://doi.org/10.1177/0958305X17706177, 2017.
Holmes, A.: Radioactivity and Earth movements, Trans. Geol. Soc. Glasgow, 18, 559–606, 1931 [N. B. address delivered in 1928].
Humlum, O., Stordahl, K., and Solheim, J.-E.: The phase relation between atmospheric carbon dioxide and global temperature, Glob. Planet. Change, 100, 51–69, 2013.
Imbrie, J. and Palmer Imbrie, K.: Ice Ages. Solving the Mystery, p. 117, 119, 121 and 141, McMillan, London, 1979.
IPCC: Working group I: Contribution to the IPCC Fifth Assessement Report (AR5), Climate change, The Physical Science Basis, IPCC, Geneva, 2013.
Jeffreys, H.: The Earth, Its Origin, History and Physical Constitution, Cambridge, Cambridge Univ. Press, 2nd Edn., p. 305, 1929.
Jouzel, J., Alley, R. B., Cuffey, K. M., Dansgaard, W., Grootes, P., Hoffmann, G., Johnsen, S. J., Koster, R., Peel, D., Shuman, C. A., Stievenard, M., Stuiver, M., and White, J.: Validity of the temperature reconstruction from water isotopes in ice cores, J. Geophys. Res., 102, 26471–26487, 1997.
Kukla, G. J.: Correlation between loesses and deep-sea sediments, Geol. Fören. Stockholm Förh., 92, 148–180, 1970.
Kukla, G. J. and Matthews, R. K.: When will the present interglacial end?, Science, 178, 190–191, 1972.
Lane, C. S., Chorn, B. T., and Johnson, T. C.: Ash from Toba supereruption in Lake Malawi shows no volcanic winter in East Africa at 75 ka, P. Natl. Acad. Sci. USA, 110, 8025–8029, 2013.
Lee, C.-T., Jiang, H., Dasgupta, R., and Torres, M.: A framework for understanding whole-earth carbon cycling, in: Deep Carbon, Past to Present, edited by: Orcutt, B. N., Daniel, I., and Dasgupta, R., Cambridge Univ. Press, Cambridge, 313–357, 2019.
Lemieux-Dudon, B., Blayo, E., Petit, J.-R., Waelbroeck, C., Svensson, A., Ritz, C., Barnola, J.-M., Narcisi, B. M., and Parrenin, F.: Consistent dating for Antarctic and Greenland ice cores, Quaternary Sci. Rev., 29, 8–20, 2010.
Lewis, N. and Curry, J.: The impact of recent forcing and ocean uptake data on estimates of climate sensitivity, J. Clim., 31, 6051–6071, 2018.
Lindzen, R.: Can increasing carbon dioxide cause climate change?, P. Natl. Acad. Sci. USA, 94, 8335–8342, 1997.
Lorius, C., Jouzel, J., Raynaud, D., Hansen, J., and Le Treut, H.: The ice-core record: climate sensitivity and future greenhouse warming, Nature, 347, 139–145, 1990.
Loulergue, L., Schilt, A., Spahni, R., Masson-Delmotte, V., Blunier, T., Lemieux, B., Barnola, J.-M., Raynaud, D., Stocke, T. F., and Chappellaz, J.: Orbital and millennial-scale features of atmospheric CH4 over the past 800,000 years, Nature, 453, 383–386, 2008.
Lüthi, D., Le Floch, M., Bereiter, B., Blunier, T., Barnola, J.-M., Siegenthaler, U., Raynaud, D., Jouzel, J., Fische, H., Kawamura, K., and Stocker, T. F.: High-resolution carbon dioxide concentration record 650,000–800,000 years before present, Nature, 453, 379–382, 2008.
Macrobius: Commentarii in somnium Scipionis, book 9, Ch. XII [translation: Stahl, W. H.: Commentary on the Dream of Scipio, Columbia Univ. Press, New York, 1966], early 5th c. CE.
McKitrick, R. and Christy, J.: Pervasive warming bias in CIMIP6 tropospheric layers, Earth Space Sci., 7, e2020EA001281, https://doi.org/10.1029/2020EA001281, 2020.
Michard, G.: Can we explain atmospheric carbon dioxide oscillations during the past 400,000 years?, Geosciences, 340, 483–494, 2008.
Milankovitch, M.: Uber ein Problem der Warmeleitung und dessen Anwendung auf die Theorie des solaren Klimas, Z. Mathem. Phys., 62, 63–77, 1913.
Mitchell, D. M., Lo, Y. T. E., Servious, W. J. M., Haimberger, L., and Polvani, L.: The vertical profile of recent tropical temperature trends: Persistent model biases in the context of internal variability, Environm. Res. Lett., 15, 1040b4, https://doi.org/10.1088/1748-9326/ab9af7, 2020.
Mudelsee, M.: The phase relations among atmospheric CO2 content, temperature and global ice volume over the past 420 ka, Quaternary Sci. Rev., 20, 583–589, 2001.
Nikolov, N. and Zeller, K.: New insights on the physical nature of the atmospheric greenhouse effect deduced from an empirical planetary temperature model, Environ. Pollut. Clim. Change, 1, 1000112, 2017.
Parrenin, F., Masson-Delmotte, V., Köhler, P., Raynaud, D., Paillard, D., Schwander, J., Barbante, C., Landais, A., Wegner, A., and Jouzel, J.: Synchronous change of atmospheric CO2 and Antarctic temperature during the last deglacial warming, Science, 339, 1060–1063, 2013.
Pedro, J. B., van Ommen, T. D., Rasmussen, S. O., Morgan, V. I., Chappellaz, J., Moy, A. D., Masson-Delmotte, V., and Delmotte, M.: The last deglaciation: timing the bipolar seesaw, Clim. Past, 7, 671–683, https://doi.org/10.5194/cp-7-671-2011, 2011.
Pedro, J. B., Rasmussen, S. O., and van Ommen, T. D.: Tightened constraints on the time-lag between Antarctic temperature and CO2 during the last deglaciation, Clim. Past, 8, 1213–1221, https://doi.org/10.5194/cp-8-1213-2012, 2012.
Petit, J. R.: Interview by F. Cristofol, Jean-Robert Petit, une vie antarctique, available at: https://www.echosciences-grenoble.fr/articles/jean-robert-petit-une-vie-antarctique (last access: January 2021), 2013.
Petit, J.-R., Jouzel, J., Raynaud, D., Barkov, N. I., Barnola, J.-M., Basile, I., Bender, M., Chappellaz, J., Davisk, M., Delaygue, G., Delmotte, M., Kotlyakov, V. M., Legrand, M., Lipenkov, V. Y., Lorius, C., Pépin, L., Ritz, C., Saltzmank, E., and Stievenard, M.: Climate and atmospheric history of the past 420,000 years from the Vostok ice core, Antarctica, Nature, 399, 429–436, 1999.
Popper, K. R.: The Logic of Scientific Discovery, Hutchinson and Co, London, 1959.
Raynaud, D., Jouzel, J., Barnola, J. M., Chappelaz, J., Delmas, R. J., and Lorius, C.: The ice record of greenhouse gases, Science, 259, 926–934, 1993.
Reeburgh, W. S.: Oceanic methane biogeochemistry, Chem. Rev., 107, 486–513, 2007.
Richet, P.: The Physical Basis of Thermodynamics, chap. 1, Plenum Publishing, New York, 2001.
Richet, P.: A Natural History of Time, transl. from the French by J. Venerella, The Univ. Chicago Press, Chicago, 2007.
Roe, G.: In defense of Milankovitch, Geophys. Res. Lett., 33, L24703, https://doi.org/10.1029/2006GL027817, 2006.
Soon, W.: Implications of the secondary role of carbon dioxide and methane forcing in climate change: past, present, and future, Phys. Geogr., 28, 97–125, 2007.
Tait, P. G.: Lectures on Some Recent Advances in Physical Science, with a Special Lecture on Force, Macmillan, London, 169–170, 1885.
Theophrastus, De Igne: [translation: Coutant, V.: Theophrastus De Igne. A Post-Aristotelian View of the Nature of Fire, Royal Vangorcum Ltd, Assen, 1971], 4th–3rd c. BCE.
Tyndall, J.: On the absorption and radiation of heat by gases and vapours, and on the physical connection of radiation, absorption and conduction, Phil. Mag., 22, 169–194 and 273–285, 1861.
Vakulenko, N. V., Kotlyakov, M., Monin, A. S., and Sonechkin, D. M.: Evidence for the leading role of temperature variations relative to greenhouse gas concentration variations in the Vostok ice core record, Doklady Earth Sci., 396, 686–690, 2004.
Van Wijngaarden, W. A. and Happer, W.: Dependence of Earth’s thermal radiation on five most abundant greenhouse gases, arXiv [preprint], arXiv:2006.03098v1, 4 June 2020.
Witze, A.: Earth’s magnetic field is acting up, Nature, 565, 143–144, 2019.
“In agreement with the determining role assigned to Milankovitch cycles, temperature has, instead, constantly remained the long-term controlling parameter during the past 423 kyr, which, in turn, determined both CO2 and CH4 concentrations, whose variations exerted, at most, a minor feedback on temperature itself.”
Nothing new there. Yes, temperature varied according to Milankovitch cycles, CO2 followed, and had a feedback effect on temperature. That is all standard. What it does not imply is
” If not refuted, the demonstration indicates that the greenhouse effect of CO2 on 20th century and today’s climate remains to be documented, as already concluded from other evidence.”
The demonstration is nothing new. CO2 did not drive temperature in that period, because nothing was driving CO2. Now we are driving CO2, and that will cause warming. Unprecedented.
The paper is rubbish.
”…nothing was driving CO2.”
So what caused CO2 levels to rise in the past if it were not driven Nick?
I’ll repeat the quote
“In agreement with the determining role assigned to Milankovitch cycles, temperature has, instead, constantly remained the long-term controlling parameter during the past 423 kyr, which, in turn, determined both CO2 and CH4 concentrations, whose variations exerted, at most, a minor feedback on temperature itself.”
But that doesn’t answer the question why we are experiencing the same fluctuation now as in the past, the ice core data clearly shows that.
“we are experiencing the same fluctuation now as in the past”
We are not experiencing the same fluctuation. This is what makes the difference:
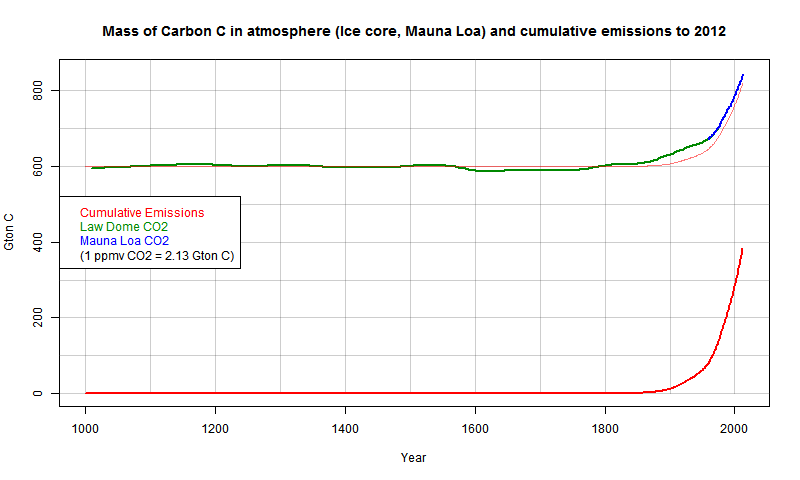
That shows total C (as CO2) in the air, and the total we have burned. The earlier level of 280 ppmv (800 GtC)was about the maximum it reached over that period. In colder times, the seas would dissolve more, so the fraction in the air would drop and rise as the head graph shows. But now we are substantially boosting the amount in circulation (400 GtC). That hasn’t happened before.
What happened prior to 1000 years ago Nick?
See the head graph.
You posted a graph for the last 1000 years Nick. Why?
The graph for the last 400,000 years is at the top of the page (and Fig 1). Mine shows in better resolution the effect of our activities.
It seems to me you are comparing apples and bolts, Nick. Please substantiate the relationship of resolution, precision and accuracy between the different methods of obtaining results between the sources in you 1000 year figure and the 400.000 year figure this article is using.
They are both ice core samples. The difference is only that one (Law Dome) is rapid accumulation, so good recent resolution, while the other (Vostok) is very slow. There are intermediates. I’m not aware of anything different that they show.
Meanwhile this chart in the link shows that CO2 isn’t driving temperature change:
6a010536b58035970c0120a75431d3970b-pi (1179×858) (typepad.com)
Ooops there goes your argument, CO2 isn’t a climate driver at all.
“Meanwhile this chart in the link shows that CO2 isn’t driving temperature change”
Wearily, it shows that CO2 wasn’t driving temperature change during that period. Total CO2 in the air wasn’t changing, and something else caused the temperature changes.
It’s changing now.
”…and something else caused the temperature changes.”
Your full of sophistry Nick
“Total CO2 in the air wasn’t changing…”
Ignore the rise and fall of ice age CO2 in sight of your lying eyes.
“Total CO2 in the air wasn’t changing”
Oops – I meant total CO2 in circulation wasn’t changing. It does of course move from air to sea as temperature cools.
‘I meant total CO2 in circulation wasn’t changing.’
It did. It became less and less. What would you consider the minimum amount of CO2 in the atmosphere to support life on this planet ?
http://www.biocab.org/Geological_Timescale.jpg
CO2 in the ocean has no impact on climate Nick. More sophistry from you
Ha ha,, what a feeble answer you made, apparently even with 10,000 years of ZERO evidence that CO2 drives climate changes according to the chart you come up with a dead on arrival reply to it.
There were LARGE temperature swings in the chart while CO2 barely changed at all, if CO2 isn’t driving temperature changes for 10,000 years then it isn’t doing it today either.
CO2 as a molecule hasn’t changed at all, neither has the various gas laws, the something that caused all those large temperature swings for 10,000 years haven’t left either.
“if CO2 isn’t driving temperature changes for 10,000 years then it isn’t doing it today either”
Imagine:
If you drive your car into that wall, it will stop.
No, in 40 years of driving, when my car stops, it happens when I apply the brakes. It wasn’t stopping because I drove into a wall, then it isn’t doing it today either.
Why are you making absurd dead in arrival statements?
10,000 YEARS in long enough to show that CO2 isn’t a climate driver, you can dance around this FACT all you want but it is a fact nevertheless.
why the utter failure on your part to make a credible challenge to this statement?
Meanwhile you ignored this part completely, are you being desperate in your empty replies to create a safe exit?
You’re using the same magical thinking that Michael Mann postulated when he said “something” happened around 1960 that changed the way Briffa’s larch trees responded to temperature.
You’re violating Occam’s razor, and you’re doing exactly what the article suggests, creating a circular reason for the conclusion you desire. For your own sanity, I humbly suggest that you need to find a new line of work, Nick. Science just doesn’t seem to be your forte.
Nick, the chart shows no such thing. Even it what you say is true, how do you know that the “something else caused the temperature changes” is not the same thing causing temperature changes now? You don’t. How many times must you be told, correlation is not causation? Your argument is silly. Unless we know what caused far higher temperature changes in the past, we can’t know what is causing temperature changes now.
Besides, per the latest UAH satellite data, the Earth is cooling and CO2, despite the lockdowns and a large reduction in fossil fuel emissions by Man, is still rising and was all through the lockdowns.
Maybe it’s something else causing CO2 to rise and not Mankind? That would be the logical conclusion.
““something else caused the temperature changes” is not the same thing causing temperature changes now? You don’t. “
We do. The orbital effects have particular time scales with defined frequencies and phase. None of them are applicable to our present situation.
But we do definitely know that a whole lot of CO2 has been burnt and put in the air, and that this has never happened before. And the GHE is real.
“And the GHE is real.”
So is the dynamic re-equilibration of the hydrological cycle.
So according to your graph Nick, CO2 doesn’t cause warming nor prevent GST to drop. Otherwise what caused the MWP 960 to 1250 plus how did the GST drop 1940 to 1980 with all that growing concentration of CO2 in the atmo. Seems to me that CO2 at 400 parts per MILLION is not the monster in the closet or the bogeyman under the bed after all.
What a totally dishonest graph. Putting two entirely different metrics on the same graph as if the fantasy flat line had any physical meaning except the amount of grant money being got.
They are not different metrics. They are both Gt C. One measures cumulative emissions, the other the tonnage in the air.
Nick
now show the graph that has CO2 at 7000 ppm.
The point is that in the past warming caused CO2 to rise, the AGW crowd wants us all to believe the opposite. Since the warming caused CO2 to rise there is zero evidence that CO2 is a danger other than theory. As RGB said many times, if we can have run away warming why has it never happened before?
If CO2 is so powerful then the warming that caused a release of CO2 would have a dramatic accelerating affect on the warming, what would stop it? If it was the CO2 that caused the warming then there wouldn’t be this problem. No matter how you slice it this study is very damaging to the AGW theory.
Of course CO2 didn’t drive changes in temperature back in history, and of course CO2 drives changes in temperature now!
I mean, they didn’t have cars back then for CO2 to drive in the first place. Seriously, the lack of scientific and historical knowledge around here…
CO2, the magical gas, simply GREW. And then was carried down the mount to the believers below.
Prey tell, why have you not answered my previous point as to why during a global ice-age there was 19+ times as much CO2 in the atmosphere a few millions years back, if CO2 is the “climate driver” it is claimed to be, i.e. a warming gas? Also, why is it that the ONLY solution to evil wicked mankind’s free-enterprise capitalism is the adoption/imposition of a one-world globul guvment which will then own ALL the world’s resources, so that they can be metered out as the one-world guvment sees fit? The people who want such a ghastly happening have the same mentality as those who rule in the EU, un-elected, un-democratic, un-accountable, & worse still, un-sackable bureaucrats making & imposing laws & edicts as they see fit, to control Human behaviour. EU Commissioners are in charge of everything yet responsible for absolutely nothing may the good Lord help Europe with its European army, “Oh no the Russians are pouring over the borders in their thousands, what are we going to do? Don’t worry we’re having a get together in Cancun to discuss our tactics, we’ll have a military response ready in about a month! More champagne & caviar now please!!!” Sorted! 😉 Thank goodness Britain is out of it!!!! What on Earth (literally) are ET & his buddies going to think when it takes days/weeks/months to get a response out of anybody??? 😉
Un-sakable bureaucrats. The key.
You in the UK have a big advantage over the US. In a parliamentary system, a new government can TOTALLY change the laws of your country. All it takes is political will.
If a truly conservative PM has a truly conservative majority, he could clean house by reversing all the laws that have created the un-sakable bureaucracies.
As I have mentioned here on other threads, the US, and in this case the UK, need to undo over 100 years of ever expanding government laws.
The US constitution has a provision that military spending cannot be for more than 2 years. The founders were very afraid of a military takeover. The mistake was not seeing the non-military bureaucratocracy taking over the government and country. Our constitution needs to be amended to include the 2 year limit on ALL spending authorizations, which would end all “entitlements” since they would need to be reauthorized every 2 years and either house or a president could stop the spending cold. Your country needs conservative government that will eliminate MOST of the bureaus/departments.
Get back to the purpose of counties’ central government. Military defense, international treaties and secure the borders.
Why do we think politicians have any power ? These are just puppets in the hands of those who print the money that has corrupted the system. Follow the yellow brick road. Politicians just have to obey. That is why it doesn’t matter who you vote for.
Robertvd,
Politicians don’t have to obey. They choose to obey for money for their campaign coffers and for their personal bank accounts.
The traditional argument is that the rise in temperature caused by Milkankovic cycles produced a rise in CO2 levels. This then led to further rises in temperature. This in general is the only way one can get around the objection that causes must precede effects and so CO2 rises cannot have caused previous rises, since they followed them.
As far as it goes the argument is logically sound. Just as Ptolemy’s argument was logically sound. To make the comparison, we suppose the planets move in circular orbits. We then find that if we plot them some of the time they do weird things, like move backwards, that don’t seem compatible with circular orbits. We save the circularity hypothesis by supposing that on their circular paths they also indulge in small circular movements, epicycles. The theory works, it allows us to predict planetary positions as observed.
The thing that defeats Ptolemaic accounts, and the thing that defeats most salvaging of scientific theories which take this ad hoc approach, is not usually that the resulting theory fails in predictions. Its that its more complicated than a much simpler one (in this case elliptical orbits) and that it doesn’t correspond to reality. In the present case for instance we can observe the paths of the planets from orbiting satellites and can see directly that there are no epicycles.
If I am correct, over the next 50+ years something similar will happen in global warming theory. We will see cooling, and this will be followed by a fall in CO2 levels. And at that point people will start looking in earnest for the cause of the temperature cycles, and find one that means that we do not need the CO2 feedback hypothesis. Instead we will conclude that CO2 concentrations fluctuate with and are caused by temperature fluctuations.
I think we are going to conduct this crucial experiment because no matter what the activists want, I don’t believe there is any chance the planet as a whole is going to act to reduce global CO2 emissions. Whether Shell stops, whether the US stops, is immaterial. The rest of the world, China in particular, is going to carry on emitting and growing emissions, so we shall all find out together. At least, those of us who are young enough to live long enough will.
“This in general is the only way one can get around the objection that causes must precede effects and so CO2 rises cannot have caused previous rises, since they followed them.”
No, the standard argument is that Milankovitch caused temperature rise which caused CO2 rise, and they happened in that order. There is some feedback as well, but that does not affect the order. I’ll repeat the AR4 quote I gave below:
FAQ 6.1 What Caused the Ice Ages and Other Important Climate Changes Before the Industrial Era? They said:
“Great progress has been made in understanding the causes and mechanisms of these climate changes. Changes in Earth’s radiation balance were the principal driver of past climate changes, but the causes of such changes are varied.”
…
“Global climate is determined by the radiation balance of the planet (see FAQ 1.1). There are three fundamental ways the Earth’s radiation balance can change, thereby causing a climate change: (1) changing the incoming solar radiation (e.g., by changes in the Earth’s orbit or in the Sun itself), (2) changing the fraction of solar radiation that is reflected (this fraction is called the albedo – it can be changed, for example, by changes in cloud cover, small particles called aerosols or land cover), and (3) altering the longwave energy radiated back to space (e.g., by changes in greenhouse gas concentrations). In addition, local climate also depends on how heat is distributed by winds and ocean currents. All of these factors have played a role in past climate changes.”
…
“These examples illustrate that different climate changes in the past had different causes. The fact that natural factors caused climate changes in the past does not mean that the current climate change is natural.”
“These examples illustrate that different climate changes in the past had different causes. The fact that natural factors caused climate changes in the past does not mean that the current climate change is natural.”
An assertion without evidence.
Alarmists are bad about that.
Nick, you skipped over this bit – both CO2 and CH4 concentrations, whose variations exerted, at most, a minor feedback on temperature itself.
The question is how these gases once had a minor feedback and now threaten the end of the world as we know it.
Good luck.
The answer is as obvious to Arrhenius as it is now. For all those years there was a fairly fixed amount of carbon circulating between sea surface, air and biosphere, and it moved around as temperature varied. Now we are digging up vast amounts of fossil carbon and pumping it into the air. That is what is unprecedented, and will drive warming.
Nice try Nick but give us some numbers for the highs and lows of CO2 levels on a geological time scale.
After all if 400ppm is now going to cause a catastrophe then you will need to explain why higher levels did not do so in the past.
The numbers are in the head graph. Between about 180 and 280 ppm, with a brief peak at 300. And that covers pretty much the period of human development.
Rubbish, try before a million years ago.
Oops. Geological time scales Nick. Unless you believe the earth was created 6000 years ago.
Your Jedi mind tricks will not save you from your own attempts at obfuscation and misdirection.
Just in case you missed the word. GEOLOGICAL.
Let’s stick to the time interval covered by the paper. There are good reasons for that; the ice cores give much better data than further back. Also over many millions of years a lot changes; The processes of rock breakdown etc really can change the amount of carbon in circulation. And continents drift, Passages open etc.
But its not just about the human time period , its the geological time period ,that it seems you refuse to be drawn upon.
If co2 is a climate driver then its not linear ,as we are lead to believe, simple weather drivers or climate regional drivers are overwhelmed by eg la nina events,the CAGW simply disappears,
It would seem CAGW is selective and seasonal at best not linear
And is more of a religious/political statement,,when we hit days above 20c,
Its fairly obvious that you nick appear when there is a threat to your religion /agenda.
What is the optimum concentration level of CO2 in Earth’s atmosphere?
Why do plants prefer higher CO2 levels of up to 1000ppm?
aussicol,
It’s higher than that. Commercial greenhouses use up to 1300ppm. Earth has experienced far higher levels of CO2 in the past and all life thrived when it did.
Why and How to Supplement CO2 in Indoor Farms
https://university.upstartfarmers.com/blog/why-how-supplement-co2-indoor-farms
Besides, NOAA proved out-going longwave radiation to outer space has been increasing, not decreasing, as the CAGW theory of CO2 states, thus, negating the Greenhouse Gas Theory.
Evidence that CO2 emissions do not intensify the greenhouse effect
http://bit.ly/2N5ry9d
At 180ppm, all life on Earth was close to extinction. At 150ppm, life dies– all life as we know it. We dodged a bullet. You should be celebrating fossil fuels, not trashing them.
Please use the correct term, it’s CO2 NOT carbon. No-one knows what concentration of CO2 he experimented with in a closed jar in a lab.
The answer is as obvious to Arrhenius as it is now.
The fallacy of Arrhenius was as obvious to Angstrom as it is to us now.
Also note that the Climate Fascists ALWAYS conveniently forget the ONE thing Arrhenius truly got right – he said that if we could manage to warm the climate, it would IMPROVE the climate, not be a “disaster.”
The selective Arrhenius boot-licking always leaves out this inconvenient part – he at least understood that a warmer climate is better, not worse, for life on Earth!
Nick, no need to get your panties all in a bunch. The effect of CO2 on the additional radiative forcing is known to be logarithmic. The increase from 180 to 280 ppm had about ~ .85 the increase in radiative forcing as the increase from 280 to 410 which resulted in about 1 degree K of warming. That’s consistent with the latest estimates that have the climate sensitivity at 2 to 3 degrees K for a doubling of CO2. Therefore, the total temperature feedback from the range of CO2 concentration seen during the entire glacial cycle is less than 1 degree K, out of a total temperature change of 10 degrees K. The CO2 concentration increase did not make a significant contribution to the very wide temperature swings seen during the glacial cycle, and will not cause catastrophic warming now.
“Therefore, the total temperature feedback from the range of CO2 concentration seen during the entire glacial cycle is less than 1 degree K, out of a total temperature change of 10 degrees K. The CO2 concentration increase did not make a significant contribution to the very wide temperature swings seen during the glacial cycle, and will not cause catastrophic warming now.”
Yes, as I’ve been saying endlessly (though 10K is a bit much). Except for the last bit. Our added CO2 indeed makes about the same change as all the CO2 removed in glaciation. But we are going to add a whole lot more.
The effects of that added CO2 are logarithmic (and small). Don’t pretend that you don’t know what that means, Nick. You’re trying to make a mountain out of a mole hill. WHY?
I don’t think you know what logarithmic means. My calculation there was log. 420ppm is 1.5*280, and 180ppm (the glacial low) is about 280/1.5.
If we accept the theory, and we reference Arrhenius, then we should also use his ECS value of 1.2 deg C per doubling; which would mean that ALL the models today are incredibly wrong (as the actual data shows). And that there will be no climapocalypse.
Or, we can create an ECS out of thin air, that is not Arrhenius-sourced, and make models that don’t match actual data but show the End Of The World.
So – if you’re going to reference Arrhenius, then let’s go with 1.2 deg C ECS and plug that into the models and see – not a whole lot. Almost no effect from CO2 (as it has too little of a change for a doubling of CO2 concentrations to be of concern). Side effect is the models are now closer aligned with data – and that shows no issue at all.
So – which is it? An appeal to Arrhenius, or a denial of his data?
“then we should also use his ECS value of 1.2 deg C per doubling”
Arrhenius’ ECS value was 4 C pre doubling.
https://wattsupwiththat.com/2021/05/09/why-models-cant-predict-temperature-a-history-of-failure/
He revised his ECS after he realized his error. I wonder if climate catastrophists will be as honest.
Your link has been revised.
Facts are difficult things and hard to erase, Nick.
Svante Arrhenius (who was related to Greta & developed the ‘hothouse theory’) amended his view in 1906 and decided that warming would top out about 1.5 degrees C and that warming would be beneficial! Read about it here: http://ow.ly/mm1p50wOOKp
See my comment above and follow the links. He did not do that (and is not related to Greta).
How come you hang onto a 125 year old paper that is long out of date and way too high, when we have many much newer published papers showing far lower per doubling values than your favorite out of date scientist?
Only 130+ published papers listed showing far lower per doubling values:
130+ Papers Find Extremely Low CO2 Climate Sensitivity
A very simple question for Nick Stokes: can you provide a means of falsifying your convoluted, over-complicated hypothesis?
Stokes’ hypothesis requires the invocation of several arbitrary, extrinsic factors (e.g. climatic processes today differ from those in the past), and thus fails Occam’s Razor. The Null Hypothesis (CO2 has no effect) explains ALL the observations comprehensively and parsimoniously.
Nick, all that carbon in fossil fuels was once in the atmosphere. Then, Earth took it out of the atmosphere and put it into fossil fuels. There has been no change in total CO2, so if it didn’t cause runaway warming when it was in the atmosphere before, it’s not doing it now.
NICK,
Why do you Alarmists never quote the rest of what Arrhenius said?
Svante Arrhenius (who was related to Greta & developed the ‘hothouse theory’) amended his view in 1906 and decided that warming would top out about 1.5 degrees C and that warming would be beneficial! Read about it here: http://ow.ly/mm1p50wOOKp
All untrue
The only part of CO2 that matters to climate is what’s in the atmosphere at any one time. In the ice record the CO2 cannot be the cause of temp change because the width of rise/fall of CO2 is 2x that of temp. If temp rises and falls at a higher frequency than CO2 then it can ONLY be that temp drives CO2, not the other way round
“Nick Stokes
The paper is rubbish.”
Your comment is rubbish. You think CO2 at ~415ppm/v and at CH4 ~1.8ppm/v is doing anything to the climate? Prove it!
This paper is brilliant. And Nick is wrong again. This is basic logical analysis and an understanding of cause and effect. As the paper points out, it does not need to rely on the specific complex physical issues but simply on the agreed and supported data from the ice cores. That, and good consistent philosophically correct reasoning, something sorely missing from the alarmists’ arguments which depend on circular reasoning and invented physics.
If the paper is rubbish, then all the paper’s citations it was drawn from and the reviewer’s knowledge is rubbish too.
Rubbish is rubbish. Rubbish follows cause and effect too.
Yes Nick, you have a valid point there, but a lot of rubbish too.
First, I agree with you totally in your conclusion assessment;
The paper is a total rubbish.
Nothing new there.
Apart from wrongly claiming or implying that AGW or manmade climate change hypothesis claims that CO2 was a climate driver prior to modern times.
And reinforcing also wrongly the so much hailed “indisputable” Milankovitch cycles driving effect on climate.
The Milankovitch cycles it is indeed a climate theoretical mechanisms trying to explain climate.
But still it is a theoretical radiative one.
The AGW hypothesis and it’s failure in consideration of science, observation and the data of the latest modern period,
plus the;
GCM simulation results,
do refute and falsify the radiative theories as climate explanations, including Milankovitch cycles one.
GCMs basically do a simulation of the radiative impact-effect on the Earths surface-atmospheric thermodynamic coupling.
The very clear and sharp divergence of GCMs simulations with reality at
the given CO2 atmospheric height,
stands as a firm refutation or falsification of
radiative theorizing effect on climate.
cheers
Milankovitch cycles are basically to do with the 3 astronomical cycles, precession, obliquity and eccentricity and until about 1 million years ago the glacial inter-glacial cycles were v. well aligned with obliquity (approx. every 41,000 years) – no one knows as yet why this is now changed to on average a 100,000 year cycle.
The main reason the the lag in CO2 level increase after temperatures increase is well understood if one understands that all gases dissolve more in cold water as opposed to warm – so when coming out of a glacial more CO2 comes out of the oceans and it takes thousands of years for the glaciers to melt into the sea.
By the way many years ago the info. in this article was known and a Macquarie UNi scientist pointed it out and lost his job (of course other reasons were given for his removal)
Still a radiative theory.
Regardless of what CO2 does or not.
And alignment there alone is not enough.
Fails, according to it being a radiative theory, regardless of any supposed alignment.
The very biased pre overvalue assigned to Milankovitch cycles as a climate driver,
has very much ‘negatively’ impacted-driven the paleo climate data process.
That is the only driver factor of Milankovitch cycles in climate issue.
Gas emissions are simply basically a result of thermal gradient(s).
Regardless of any ‘intellectual’ acrobatics or innuendos, like Nick’s.
cheers
not really radiative theory is solely or mostly about just the suns radiative balance and yes but it takes a long time to explain how different types of evidence back up his theory. I wasn’t giving a lecture o that thank you.
For example, way back in the ’70’s after
Milankovitch theory fell into disrepute – very well supported evidence from deep sea sediment data cores was found to back it up – but this takes a whole book to understand
You got some linkable data for that astro-Milankovitch theory?
If so, I would dearly love to see it. One of my pet wonderifs.
yes heaps but here’s a start – should still be available if you search this blog;
New research shows Earth’s tilt influences climate change
Anthony Watts / 21 hours ago December 15, 2015
Thanks, but not quite what I’m looking for. I think, if you knew what I meant, you would have known what I meant.
It’s worth noting also that we cannot explain the 100 kyr ice age cycles with Milankovitch cycles alone since the power of orital forcing resulting from the 100 kyr eccentricity is too low to explain the magnitude of the 100 kyr climate signal.
Probably because it’s getting colder…
true
I think the current thought is that the obliquity issue results from that cycle being made up from a number of other cycle influencers causing the obliquity cycle to be a composite showing periods of strength and weaknesses.
Nick, I have often supported you here, and I was looking forward to your comments. But I don’t really understand your point at all. Such a curt dismissal is not sufficient (and, I think, not right).Your statement is exactly what this article challenges. Are you not going to push back at all?
Moth,
I was curt because this paper really annoyed me with the pomposity of language and stuff like
“If not refuted, the demonstration indicates that the greenhouse effect of CO2 on 20th century and today’s climate remains to be documented, as already concluded from other evidence.”
contrasted with the thinness of the actual new science in it. This is well summarised at the end
Data availability
No data sets were used in this article.
He just looked at some graphs that have been discussed for well over twenty years, and totally missed what people had made of them. It was Petit, among others, who he cites, who last century noted that CO2 lagged temperature. And this paper is no more advanced than all the people who since have said – Ooh look, this disproves AGW!
Nick,
“Remains to be documented” means evidence. Do you have any or are you implying that the GCMs are evidence?
Greetings Mr Stokes…
With all due respect to your point of view, I have a curious observation regarding figure 1.
There does appear to be a lock step agreement between temperature and CO2 concentration at the scales indicated in the figure 1 graph.
However, at that scale, the additional CO2 load added from mankind’s industrialization places the top of CO2 120 points higher than the graph that tracks the 120 point difference between historic Low and High concentrations (double the graph height)
Temperature on the other hand has only risen by 1.2 deg C in the same span of time. Keeping the graph scaled as it is for the last 450,000 years to match, …
Why hasn’t CO2 driven temperatures to an equal extent (12 degrees C)?
“Why hasn’t CO2 driven temperatures to an equal extent (12 degrees C)?”
Because you are reversing causality. The graph shows a CO2 response (solubility) to external T forcing (Milankovitch). We don’t now have that T forcing; it takes thousands of years. What we do now have is direct forcing of CO2 causing temperature rise. We have shifted ppm CO2 by a lot more, and seeing the direct effect of that.
Well praise Jesus and pass the collection plate, time to tithe to the Prophets of the IPCC.
We shall never again have to worry about the “Ice Age Commeth” as all our glorious CO2 will keep away Nanook’s nasty mile high Laurentide Ice Blanket and CO2 can increase plant growth in regions that couldn’t support life before.
We just need to make a few adaptations
Yet another strawman the paper doesn’t dispute that.
The paper says, portentously
“If not refuted, the demonstration indicates that the greenhouse effect of CO2 on 20th century and today’s climate remains to be documented, as already concluded from other evidence.”
But if CO2 drives temperature why would Greta Thunberg want to have less of it ? Why would she want to live under 2 miles of ice ? What is wrong with a warmer Earth ? If I’m not mistaken are the recent 3 Ma the coldest of the last 200 Ma. How bad was life during those 197 Ma prior to the Earth plunging into an Utopia Ice Age ?
We see cooling and warming. And only correlation of temperature/CO2 increase leads to the presumption of causation. 5 year warming peaked 2019, cooling is close to 40 year average based on global sea ice extent (5 days below the 40 year average). Annual change in insulation is due to heating/cooling of northern hemisphere land. 223 w/m² in winter to 260 in the summer. Consisting of 0.7 watts per gram of air of entire atmosphere mass (0.160 (surface heat), 0.240 (Solar input) , 0287 (ideal gases).
The Pavlov response in all its glory.
Nick, it is probably correct that human activity is driving some or all of the recent rise in CO2 levels.
However the question is whether there is any evidence in the historical record that rises in CO2 levels, for whatever reason they have occurred, lead to rises in the temperature of the planet.
Or whether, based on the past record, something else has happened: a rise in temperature has caused a rise in CO2 levels, and a subsequent fall has caused a fall in CO2 levels.
If we cannot show CO2 to have been the control knob in the past, then there will be no reason to conclude it is today, and so the current rises will be harmless or maybe even beneficial. If this is correct we should at some point see temperatures turn downward, and CO2 levels fall.
The fact that we have raised CO2 levels ourselves is irrelevant to this issue. The question is whether the record shows CO2 changes, however caused, acting as the control knob. The paper is arguing that it does not.
Your point doesn’t refute their argument.
Michel,
“Your point doesn’t refute their argument.”
My point is that their argument is a strawman. Yes, the past changes shown were due to temperature movements causing CO2 changes (with feedback). I have replied to your comment below on this, in more detail, quoting the AR4. That is longstanding knowledge.
CO2 did not drive temperature then, because nothing was driving CO2. No new carbon was being added to the system. Now there is.
It doesn’t make sense to me. Where the CO2 comes from makes no difference. The theory is that any rise in atmospheric CO2, no matter how caused, should raise the temperature. Same rise in one, same rise in the other.
Are you arguing that the previous rises in CO2 which were caused by rising temperatures will have different effects from the recent ones, caused by human activity?
Makes no sense. Whether anything other than temp is driving CO2 rises is immaterial to their effect. It had no permanent effect then, why should it now?
I guess you could argue that when and if temps fall the level of CO2 in the atmosphere will not fall as it did previously.
We shall see. If you are right, its an unprecedented situation so the past is no guide. If you are right we should not expect the addition of human released CO2 to decline in response to falling temps.
I have always read in places like Real Climate an argument like the one I gave. People get very indignant if you point out that the CO2 rise came after the rise in temps. So they claim that the CO2 rise was still causal, but that the lag is explained by invoking the temp rise followed by CO2 rise followed by this CO2 rise causing the main temp rise.
The effect will be the same – more CO2 causes warming – but in previous periods there was no independent driver of CO2 concentration except temperature. Whatever controlled the long term temperature cycle ultimately controlled CO2 concentration.
That is not the case today. Today there is a driver of CO2 concentration that is completely decoupled from long term temperature cycles. CO2 will continue driving warming as long as we keep injecting it into the atmosphere (and then for a while hence). The onset of an insolation regime conducive to ice sheet growth is not going to draw down CO2 levels.
Don’t misunderstand me, the only weekly rise we see is the reise in the stupidity of your comments, sorry.
“That is not the case today. Today there is a driver of CO2 concentration that is completely decoupled from long term temperature cycles.”
That decoupled concentration of CO2 didn’t do anything for the temperatures from 1940 to 1980. CO2 was steadily increasing during this time yet temperatures were falling, to the point that climate scientists in the 1970’s thought the Earth might be entering another ice age.
The observed trends in temperature are the combined sum of radiative forcing from CO2 + other natural and anthropogenic forcings + internal (unforced) variability. It should be common sense that at times the second two terms can variously be larger or smaller than the first without implying that the first term equals zero.
Ultimately, major changes need an external driver (unless runaway, which hasn’t happened yet). For glaciations, it was orbital changes (Milankovitch). They were periodic and bounded, and did what they did (changed T, and so CO2).
Now the external driver is our direct addition of carbon into the air (change CO2, and so T). That is not periodic, and is bounded by the total amount of carbon available for mining. That bound will be uncomfortably hot.
Where is the hockey stick?
Nick, nothing going on with the climate today is in any way, shape, or manner unprecedented. CO2 is on the rise, but it wasn’t CO2 that caused past warming episodes.
In the past, the same 2000 or so Gtons of C circulated between air, sea and bio. Without changing that, nothing is driven by CO2. Now we have added 600 Gt C. That is unprecedented.
Unprecedented perhaps during the time of Mankind but certainly not unprecedented geologically speaking. CO2 has been significantly higher than it is today and No Runaway Hot House Earth or we would still be in hot house
“we have added 600 Gt C. That is unprecedented.”
You missed my point.
Perhaps that is true, but nothing unprecedented is going on with today’s climate. You don’t know that whatever natural forcings that caused past warmth, poorly understood though they may be, are not the forcings that are causing today’s modest warmth. The only observable effect from increasing CO2 is the greening of the planet. Do you think that is a bad thing? I do.not.
In order to claim that, you must also know the total population of termites and phytoplankton as well as the total number of volcanic eruptions in the past vs now. So what were they?
Otherwise, your statement is unsupportable with actual data, which makes it armwaving.
”Now we have added 600 Gt C. That is unprecedented.”
But we haven’t though. The CO2 we produce burning fossil fuels has always been there in the ground, which once was in the atmosphere. It is not ”unprecedent at all.
Nick. Warming by CO2 and by
changes in solar insolation are not equivalent. The later warms the oceans deeply. The former is much more fleeting and barely warms the oceans at all.
Conveniently ignoring that the Earth experienced glaciation with 10 times the current atmospheric CO2 level. CO2 does not “drive” Jack Sh!t.
“Ultimately, major changes need an external driver (unless runaway, which hasn’t happened yet)”
Yet, he says! As if that might happen? Due to human activity?
The Earth at one time had a CO2 concentration in the atmosphere of 7,000ppm as compared to 415ppm today, yet no runaway Greenhouse occurred at 7,000ppm, but you are hinting that it might yet occur?
Humans couldn’t pump 7,000ppm of CO2 into the atmosphere if they tried. About the most humans could put in the atmosphere if they burned all fossil fuels at one time would be less that 1,000ppm.
Earth is not in danger of suffering a runaway Greenhouse from human CO2 activity. It’s absurd.
The “Immaculate Contribution” would be seen if it existed – once the (excuse me) REAL cause of the rising temperatures ended, then as long as CO2 levels continued to rise, temperatures would continue to rise, at a reduced rate – that reduced rate being that alleged “contribution” or “feedback” the Climate Fascists keep braying about.
But that is not what happens – instead, at each change from warming to cooling or from cooling to warming we get an extended period of reverse correlation, which tells anyone capable of logical thought that CO2’s supposed “effect” on temperature to be nil.
Nick, please explain how “nature” can tell the difference between “old carbon (dioxide)”, absorbed by plants from the atmosphere, stored for a while, then released again to the atmosphere through decay and fire, and “new carbon (dioxide)” which was absorbed by plants from the atmosphere, stored for a longer while, then released (in very small proportionate amounts) again into the atmosphere by man-made fire. Did “nature” never burn, or oxidize, peat, coal, and oil until we showed her how?
hiskorr,
The explanation goes like this.
In the past there were episodes of warming and cooling, which were driven by something other than CO2, and which caused fluctuations in CO2 levels. The rises in CO2 levels did not have any material effect on the warming phase of the cycle. There was only minimal feedback.
However, the present environment is totally different and the past is no guide to what is in store. We have injected quantities of CO2 into the atmosphere.
At this point I have to guess a bit at how Nick’s argument will be, if fully fleshed out.
Its different from the argument that I am used to seeing on sites like Real Climate, where I am used to seeing the claim that the previous cycles were started by some other cause but then the substantial cause of CO2 based warming kicked in, because the initial warming caused a rise in atmospheric CO2.
This argument at least had the merit of, if valid, showing that there was a precedent for CO2 driven warming. It seems to me that Nick’s version is a lot weaker, since it essentially is arguing that the present and future warming is going to be unprecedented.
You might think to defeat Nick’s argument by claiming that the same mechanism which has led to cooling in the past will lead to cooling now. You might also think that the same way that cooling in the past led to drops in CO2 levels, it will do so again in the future.
But (here is my construction of the argument) this will not happen, because our own emissions are so great they will overwhelm the natural sinks that absorbed the CO2 in the cooling phase in the past. Therefore what will happen is that this CO2 will remain in the atmosphere and produce further warming.
There never will be a cooling phase, like there was in the past.
I think this step is required to make Nick’s argument logically conclusive.
Well, its an argument. I don’t see the evidence, though. I don’t see the evidence that natural sinks are limited in the way the argument claims. There is also a hidden argument that the cooling force, whatever it is, will be overwhelmed by the warming effect of the added CO2 – assuming we accept that the natural sinks will be overwhelmed.
What is the evidence for that? Considering we do not know what caused the cooling phase of the cycles of the past?
Whatever, if we live another 50 years we will find out together. China and India etc are going to keep on emitting and growing their emissions like crazy. The West may reduce a bit, but not enough to make any material difference. So we will have rising emissions, and either there will be a cooling phase and a fall in atmospheric CO2 levels as a result, or Nick will be right, and there will be no cooling, but a continuing rise in both CO2 and temperatures.
We’ll find out together. Or the younger among us will.
“because our own emissions are so great they will overwhelm the natural sinks that absorbed the CO2 in the cooling phase in the past”
No, there is nothing about overwhelming sinks. There has been, for a long time, about 2000 Gt C, roughly equally partitioned between air, sea and bio. It moves around depending on temperature, hence the head graph. We have added 600 Gt C. When that settles down, it boosts each partition by about 30%. The air component is where warming comes from.
There is of course a lot more carbon in the deep sea. But it is bound as carbonates, and requires an acid/base shift to become mobile. Also, diffusion is slow.
I love how you consistently assert alleged “facts” that are nothing more than “estimates.” CO2 has never been empirically shown to drive the Earth’s temperature. Without such evidence, there is no basis to believe it will now.
“Did “nature” never burn, or oxidize, peat, coal, and oil until we showed her how?”
Indeed, nature did not oxidise coal and oil. That’s why it is still there for us to dig up.
Your point?
There is an age old theory that God put it there for humans to dig up and use so they could become fruitful and multiply.
Falsify that. Be sure to show your work.
You are very wrong, Nick. Fires from both natural gas and coal, both nature-made and man-made have been going on for thousands of years and some for millions of years. CO2 from these fires has been going into the atm. long before man got behind the wheel of a car.q b
The fires are almost impossible to extinguish.
10 Natural Eternal Flames You’ve Never Heard Of https://listverse.com/2013/08/15/10-natural-eternal-flames-youve-never-heard-of/
Combustion metamorphic events resulting from natural coal fires
Author(s)
Ellina V. Sokol ;
Nina I. Volkova
Doi:
https://doi.org/10.1130/2007.4118(07)
How does Nick’s idea about CO2 not cause a runaway hothouse effect?
The Earth’s oceans warm up thanks to Mother Nature, and this causes outgassing of CO2 from the oceans into the atmosphere that increases the warming higher than the inital warming by Mother Nature, and this increased warming causes more CO2 to outgass which raises the temperatures further, which causes more warming, which raises the temperatures higher and on and on. A runaway Greenhouse effect.
It’s like a perpetual motion machine. Where does it stop?
According to GCM simulations,
that perpetual linear exponential motion “machine” will stop once the max thermal capacity of Atmosphere achieved.
Which according to the bright- brilliant electrolyte minds there,
it will be the new climate equilibrium,
the manmade one,
which even when still consisting as an equilibrium, it will be catastrophic, weirding, disruptive, end of the world as we know it… etc…etc.
cheers
No, Nick’s argument will not lead to a runaway effect. It would lead to fluctuations around a higher mean than before human emissions.
His argument is that previous fluctuations led to movement of a constant level of CO2 between biomass, sea and atmosphere.
The argument is, at least I think it is, that the thing that kept temps more or less constant was that this total amount of carbon was constant.
There was, the argument goes, a huge amount of carbon buried in the earth, sequestered, and having no role in these cycles.
The cycles of warming and cooling happened from causes having nothing to do with CO2 levels, and were not amplified or materially influenced by them.
However, we have now raised the amount of free carbon. That is, if we added the total available to move between sea, biomass and atmosphere, it would be much higher now than it was in AD 1000. And its rising. This means that when the heating/cooling cycle occurs it will be around a higher mean than in 1000.
Its obvious as soon as you spell it out like this that there is something missing. Why, if the previous rises in CO2 did not have a material effect on temperature, should the present ones have such an effect? If there was no feedback from CO2 rises in the past, why should there be any effect from a rise in CO2 now?
“Why, if the previous rises in CO2 did not have a material effect on temperature, should the present ones have such an effect?”
Your summary so far is good. But there were no previous rises in total CO2, or at least nothing big. The only way to turn the CO2 control knob is to increase the mass of C in circulation. On the millennial time scale, this means either an increase in volcano output, or digging up sequestered carbon. Volcanic output varies, but there is no evidence of a secular change. There is, though, a once only change in mining.
Ignoring, all the while, that CO2 is no such “control knob,” since there is zero evidence of that.
“Volcanic output varies, but there is no evidence of a secular change. There is, though, a once only change in mining.”
You do understand that as a carbon based lifeform YOU are a Carbon Sink? Everything you ingest of flora and fauna becomes your Carbon. The Global Human Population has more than doubled since the 1950s. The Earth is far greener than just 30 years ago and Flora and Fauna Food Crops have multiplied that are all Carbon Sinks and Water Sequestrations. Earlier I pointed out how history shows warming periods increased Biomass and cooling periods cause stunted growth and extinctions. Warming also creates more Atmospheric Water such as the Medieval Warming that during cooling like the LIA it becomes added ice to Glaciers, that warming releases trapped CO2 as do warming surface water – that most short sighted graphs only start in the 1850s to create a narrative of it being “unprecedented warming” with their “Since Recorded Temperatures” ignoring the science that our Earth has had a long history and created a mass indoctrination of ignorance.
Logic and reason don’t compute with Climate Fascists.
CO2 was driven by temperature
It was. Not now. It’s driven by us.
So what?
Starting around 3.5 billion years ago, some bacteria began producing oxygen as a byproduct of photosynthesis. Until then, there had been little or no oxygen. Maybe we also should fight O2. Why would this planet need complex animals .
Forget about “us”, that’s just your propaganda. You’re admitting back then temperature was driven by temperature but saying that now temperature is driven up only by human emitted CO2. Not impossible, but exclusive of the accelerated warming concept. So no need to panic.
Based on “estimates” of the carbon cycle, not any measurements. Which means based on nothing.
Oh Nick, I just attended a conference held by the Geol. Soc. Of London. Every single invited speaker presented that the only control knob of geological temp changes is CO2. If I give you their names would you like to email and tell them they are wrong, that it’s only now that CO2 is driving temps?
Some evidence that we are driving the Earth’s climate would be nice. You should include that with your unsubstantiated claim and then it would no longer be unsubstantiated. But this requires evidence. Something we both know, you do not have.
“CO2 did not drive temperature then, because nothing was driving CO2. No new carbon was being added to the system. Now there is.”
History shows Super Volcanoes and massive fires from fossil records added massive amounts of CO2 and aerosols to our atmosphere. While the aerosols caused local to global cooling, the CO2 remained in the atmosphere or was absorbed by colder surface water and trapped in ice that was slowly released as the Earth warmed that increased the atmospheric CO2 far faster than we have added CO2 from fossil fuels. The CO2 increases followed the warming in every case after a lowering of the atmospheric CO2 during Glaciations. Biomass extinctions of flora and fauna are well noted during those Glaciations and the increases of Biomass took thousands to millions of years to grow after the warmings to equal those Pre-Extinctions. Every Extinction causes a sequestration of Carbon that as fossil fuels and Biomass that become stone fossils can never return to create more flora and fauna unless more volcanic activities in limestones or humans activities create it by burning fossil fuels, cement manufacturing, etc. The Carbon Budget was far greater after the “Snowball Earth” and has decreased with every mass extinction of Biomass. While this shows up in Earth’s History as temperature fluctuations, succeeding Hothouse’s begin with lower amounts of Carbon to create Carbon Dioxide and yet the global temperatures still created Icehouse and Hothouse conditions proving that CO2 is not the “driver” of climates.
Our Holocene Interglacial is no different with its fluctuations of temperatures that began hotter during the Holocene Climate Optimum that with every warming has been cooler than the previous one, as the CO2 has increased as Biomass has increased since the “Last Ice Age ‘ended'” – that is a misnomer because an Interglacial means we are still nearer a Glaciation than a Hothouse temperature. With every Holocene Warming Biomass has increased as Biomass dies or is stunted during the Cooling’s like the LIA as CO2 decreased in the LIA and has increased during the Modern Warming before the use of Fossil Fuels became extensive, so has farming globally, that creates more surface water evaporation and Biomass creation of CO2. But, without the added CO2 from Fossil Fuels and Cement Manufacturing to provide that Carbon that creates Biomass, crops would be stunted and Fauna would not procreate nor be larger now than just a few centuries ago…as history has also shown.
That CO2 has greatly increased since the 1950s the Global Temperature has only increased by fractions of a degree and the “Hiatus” has gotten longer. Again showing that CO2 is not the “Driver of Climate Change” as it would show up as a Temperature Increase.
What was the worldwide population of termites and phytoplankton then, vs now?
You must know that in order to make your statement. Otherwise, its armwaving.
Nick, apparently not.
EIA: U.S. CO2 Emissions Declined 11% in 2020 – No Change in Rising Atmospheric Carbon Dioxide
https://bit.ly/3tZwjRE
4/16/21
“…But here’s the rub.
This big CO2 emission reduction experiment from traditional fossil fuel energy sources so often demanded from climate change alarmists resulted from the global economy being essentially crippled for months, and yet did not matter at all in the grand scheme of global carbon dioxide concentrations, said to be the “control knob” for climate change. Even with that reduction, combined with a 17% upwards shift towards wind and solar, the Earth’s atmosphere didn’t notice – global atmospheric CO2 concentrations continued upwards, unabated in 2020.”
Maybe there are, as before, natural drivers at work raising CO2 levels? Maybe these guys were busier than usual while we were all locked down?
Termites Emit More Greenhouse Gases than Coal Plants
https://godfatherpolitics.com/termites-emit-greenhouse-gases-coal-plants/
Where would this carbon come from? Outerspace?
This is the reason he will not argue with you. This is what it’s all about and why it’s a fallacy
Well, no.
The fact that the deep ocean’s temperature controls the level of atmospheric CO2 should not be controversial. It’s basic science.
link
The usual alarmist response to the above is some kind of misdirection based on surface temperatures or on the temperature of the top layer of the ocean. Because of the pressures in the deep ocean, CO2 solubility is exquisitely sensitive to temperature. A temperature change of 0.1C changes the CO2 solubility enough to completely explain the modern increase in atmospheric CO2.
I haven’t read the whole paper yet and it might or might not be rubbish but your argument doesn’t prove it so.
The oceans are currently taking up CO2 from the atmosphere, so cannot possibly be the source of the observed rise (in fact something like half of the CO2 we’ve emitted has been taken up by the oceans and biosphere).
At the same time we are told oceans are warming. Can’t be warming and taking up co2 !
There is Henry’s Law which describes the equilibrium between the amount of gas dissolved in a liquid and the partial pressure of that gas in the atmosphere above the liquid.
Because of the immense amount of CO2 in the ocean, the partial pressure of CO2 in the atmosphere is determined by the solubility of CO2 in the ocean, not vice versa.
In light of the above, we could put a lot more CO2 into the atmosphere without actually changing the concentration of CO2 in the atmosphere. The ocean will absorb or emit the CO2 necessary to maintain equilibrium with the partial pressure of CO2 in the atmosphere.
Certainly the ocean/atmosphere will regain equilibrium once we stop emitting CO2, but this adjustment time will not be instantaneous.
How much of your payday are you willing to donate toward the Green New Deal?
“In light of the above, we could put a lot more CO2 into the atmosphere without actually changing the concentration of CO2 in the atmosphere.”
It has been changing plenty in recent decades.
The fact that it’s been changing doesn’t prove that it was caused by humans. How do you explain the fact that we started emerging from the Little Ice Age a couple of hundred years ago? Why wouldn’t that be associated with a slight warming of the deep ocean and a concomitant change in CO2 solubility?
Concomitant, yes. As Ferdinand endlessly pointed out, concomitant means about 10ppm per degree C. It has risen about 130 ppm.
No.
You did exactly what I said you were going to do. That’s sad.
This paper describes the solubility of CO2 at the pressures and temperatures found in the deep ocean.
As I previously pointed out, a 0.1C change in the temperature of the deep ocean would change the CO2 solubility enough to completely explain the modern rise in atmospheric CO2.
“This paper describes”
We’ve been through this before, and I pointed out that in the very first sentence, he points out that he’s talking about solubility in pure water. And very high partial pressures of CO2, which are not relevant to sea water.
Most CO2 in sea water is bound as bicarbonate (or carbonate), so none of this is relevant to practical solubility. But anyway, there is no sign of a 0.1C rise in deep ocean. And even if there were, the CO2 released, still in solution, would take decades to get to the surface.
I would say that you haven’t understood how CO2 behaves at the very high pressures and low temperatures found in the deep ocean. Partial pressure is irrelevant. The solubility of CO2 in those conditions is almost entirely determined by pressure.
Solubility at depth means the ability to switch in or out of gas phase – ie form bubbles of CO2 where gas is in equilibrium with dissolved. This does not happen at any depth in the sea, so is irrelevant to the behaviour of dissolved CO2 there. The partial pressure of CO2 does not rise much as depth increases. The amount dissolved is the amount in equilibrium with a gas phase partial pressure of about 40 Pa. That paper is talking about gas in equilibrium with MPa.
At the pressures involved, CO2 can not exist in its gas phase. Period.
So how is insolubility expressed? Droplets of liquid CO2 in the sea? Solid?
So what?
The Baltic Sea is following studies a net CO2 source.
“This paper is rubbish”.
Translation: This paper threatens my whole Worldview, and I can’t rebut it, so I’ll insult the integrity of the authors instead.
His usual modus operandi is find some small point in an article and nitpick it; this one is serious enough that he chose to go up a level for a general overall nitpick.
Nick
The demonstration is nothing new. CO2 did not drive temperature in that period, because nothing was driving CO2. Now we are driving CO2, and that will cause warming.
Nothing was driving CO2? Then why was it increasing and decreasing in lockstep with but a few millenia after temperature? Can the word “driving” only be used for CO2? In climate science, does only CO2 have a “driver’s license”?
What you are saying is not mainstream climate science.
You say that over the Pleistocene temperatures rose and fell for other reasons but recent higher CO2 levels from human input, are now driving climate warming.
That is not the position of mainstream climate science.
Instead they revisit every single change in climate of the past and tortuously attribute it to CO2.
For example Shakun’s twists and turns and exploitation of interhemispheric bipolar seesawing to argue that CO2 preceded the warming of the most recent Holocene glacial termination.
The clear implication of his paper is that all previous glacial terminations were also CO2 driven.
This is flat out refuted by the facts which – to repeat for the 10,000th time, show that CO2 always follows temperature, not the other way around.
The cause does not follow the effect, it should precede it.
That’s a problem for CO2-centric climate belief just as profound as the astronomical contradictions of the Ptolemaic epicycles theory.
Likewise it is accepted as dogma that the 252 million year ago end Permian extinction was caused by CO2 warming, even though this contradicts geological evidence that the extinction occured during a glaciation with sea level regression:
Timing of global regression and microbial bloom linked with the Permian-Triassic boundary mass extinction: implications for driving mechanisms | Scientific Reports (nature.com)
Likewise the attempts by Sooreghan et al 2019 to explain the late Palaeoene ice age by CO2 driving result in excruciating contortions and denials of evidence that Co2 was not a climate driver at all:
The cult of carbon dioxide is leading palaeo-climate research on a road to nowhere – Odyssey (wordpress.com)
Increasing – not decreasing – CO2 is seen during the inception (not termination) of the end-Ordiovician glaciation and indeed at glacial inceptions generally.
https://www.sethallenyoungphd.com/uploads/8/5/6/5/85653054/young_et_al._2008.pdf
“Nothing was driving CO2? Then why was it increasing and decreasing in lockstep with but a few millenia after temperature?”
In the context, it was obvious, but I meant that nothing but temperature was driving CO2. For CO2 to drive temperature, you must have an independent source adding it to the system (that would be us).
“What you are saying is not mainstream climate science.”
Yes, it is. I quoted AR4 above. If you think otherwise, please quote.
I quoted Shakun and Soreghan. Plus I generalised a bit. (Let’s leave Mark Twain out of this.)
“you must have an independent source adding it to the system (that would be us).”
Solar Cycles melting Ice globally and warming of surface waters would increase Atmospheric CO2 as more Biomass is releasing CO2 and natural weathering of heating soils do too. Add a volcano or two or a Super Volcano to the mix and our use of Fossil Fuels pale to this.
We have a direct causative effect between a solid paper and paid propagandists declaring it to be rubbish, sans real science. Closing with Danger Warnings of coming “unprecedented” warming. Beware the Hobgoblins.
Nick needs to keep the chillun frightened and when somebody cites a solid paper he can say something to the effect of “don’t listen to that rubbish its been refuted” (based upon his comment apparently) and That is the report that the Propaganda Press will go with.
Your assessment is rubbish. Until you can explain that the natural forcings (whatever they were, nobody knows for sure) that caused past warmth much greater than what we are experiencing today (mid-Holocene, Roman & Medieval Optimums) are not responsible for current modest warming, then the belief that anthropogenic CO2 is responsible for modern modest warming has no merit.
What is worse David is the Nick Stoke propagandists, imply with their nonsensical pseudo-science, that simply controlling the populations use of fossil fuel would place a control knob on the climate without ever addressing what caused climate change pre industrial era, 2 Generations of children have been raised to believe that, were it not for man burning fossil fuel, by default the climate would remain static and optimal.
I “learned” in my Earth Science college course in 1974 that earth was on the verge of a coming ice age only to read in Time magazine 15 years latter that the worm had turned and the globe was warming. Today nobody in the propaganda ministry recalls that ice age scenario. To Orwell’s point “who controls the past controls the future.”
My moment of clarity came with the realization that no matter what was happening in the world around us, the government funded Bureaucratic community was going to report it as catastrophic and in immediate need of government control. It is a lot more about Government funding and job security than impending doom but then you already know that.
“… and had a feedback effect on temperature.”
You don’t know that, Nick, and neither does anyone else.
In court we would have a legitimate objection called “facts not in evidence.” LMAO.
The logic pretzel twisting become truly acrobatic, doesn’t it? CO2 didn’t drive temperature in the past, but now it does. You can’t make this sh!t up.
“CO2 did not drive temperature in that period, because nothing was driving CO2.”
If there ever was a demonstrated inability to physically reason, that statement is it.
Indeed.
So what do you think was driving CO2?
Dissolution/resolution of CO2 from the Oceans as a result of temperature changes. Why do you have difficulty in understanding this?
How can temperature changes be driven by “Dissolution/resolution of CO2 from the Oceans as a result of temperature changes“?
where have I ever suggested temperatures are a function of CO2? That’s your contention.
I have absolutely no idea why temperatures change. I don’t need to. All I know is that they are not a function of CO2.
Nick is trying to divert the discussion away from his embarassing mistake, Graeme. Don’t go for it because the intent is to bog you down in irrelevancies.
Another diversionary question, Nick.
According to your GH theory, changing CO2 should air drive temperature no matter what. No matter whether CO2 itself is driven or not.
It’s the old distinction between forcing and feedback. If warming outgasses CO2 which causes more warming, that is not an independent forcing. It is feedback. And a rather weak one, as Richet said, and I quantified here.
Feedbacks are drivers, Nick. You can’t escape your wrongness. Try as you will.
“Now we are driving CO2, and that will cause warming. Unprecedented. The paper is rubbish.”
Nope, your statement is rubbish because the geologic temperature-CO2 alignment is the whole basis for supposing that CO2 drives temperature. When clearly seeing that it was temperature that drove CO2, then the link is broken — no longer any reason to suppose that CO2 will drive temperature.
You seem to be saying that man made CO2 is some how different from natural CO2, if CO2 didn’t drive temperature then, it doesn’t drive temperature now. The laws of physics haven’t changed
It’s not the paper that is rubbish.
“You seem to be saying that man made CO2 is some how different from natural CO2”
No, it just adds to it. Formerly there had been basically the same amount (about 2000Gt) of C, moving between air, sea and bio. We’ve added 600 Gt and counting. It isn’t different, but it’s new.
The amount of “gigatons” being essentially pulled out of someone’s nether region. Show us the carbon cycle measurements. Oh wait!
What is rubbish is what I call “The Immaculate Contribution” – that supposed “feedback effect on temperature” of yours, which is not shown to exist anywhere but in the fever dreams of alarmist Eco-fascists. Hundreds of years of reverse correlation at every change from warming to cooling and from cooling to warming conclusively shows your “Immaculate Contribution” to be non-existent.
Oh dear Pascal. Dear, dear, dear. You see, what you have done is produce proper science. Thoroughly-researched, data-driven, thoughtful science. No doubt that nice Mr Stokes will be along in a minute to explain why all your data, thought processes and scientific reasoning is completely wrong.
But that’s not the worst thing. Because Pascal, my dear, brave, investigative scientist, you now have to be cancelled. Any work which demonstrates the over-arching effect of Milankovitch cycles leads directly to the scientific cancelling of its proponent. Even worse, if that work is based on sound data, accompanied by a humble explanation of cause and effect, then the author must be excoriated and thrown out of scientific societies and institutions.
Poor, brave Pascal. You thought that pure science would lead to a greater understanding of the physical processes that create conditions on our planet that have evolved over millennia. No Pascal, no. That sound you can hear is not the swell of applause from a scientific community enraptured by the thoughtful, painstaking research of a fellow scientist. It is the rumbling of the tumbrill. The guillotine awaits. Nick Stokes will patiently explain why you must be excised from scientific society…..
This isn’t “science” it’s a doubt-mongering op-ed and a lousy one.
Thanks Loydo. When people like you, Nick Stokes and Griff disparage something it is a clear indicator that the something is on the right track.
Forrest, you’re absolutely right. This is a brilliant paper. Pascal, thank you, and I apologise for the cretins who are upset from the tone of your paper as that shows they can’t handle the subtleties that appear when a translation to English is made.
“This isn’t “science” it’s a doubt-mongering op-ed and a lousy one”, Loydo explained.
Show your work please.
Another Pavlov response. A see a theme developing here.
Yes, this isn’t science: it is “epistemology”, something that you don’t understand, that you don’t know what it is and what is its scope. Something which is needed to evaluate and perfection any scientific pursuit: something that your brains are too small to understand.
OK for your writing the word science between quotation marks: because, as your comments show, science is something that you cite, a word that you use, without undestanding its meaning.
I was quoting John V. Wright, he used the word “science” or “scientist” 10 times in 15 lines. He shouldn’t have.
How so? Refute it with evidence before bitching about it?
“doubt-mongering op-ed and a lousy one.”
Precisely your expertise, Loy’doh!
The paper doesn’t address the current AGW hypothesis.
The paper points out that the Greenhouse Effect is well known and not a problem. A minor issue compared with the big drivers of the climate. This was the consensus from Callender (Arrhenius?) until 1987.
In 1987 Margaret Thatcher discovered that fossil fuel emissions now overwhelmed the natural reservoirs and were now dominant. Thus making the destruction of the UK coal industry and causing mass unemployment in an anti-Union crusade, a good thing.
The paper does not address whether the reservoirs are now actually overwhelmed.
Although the annual outpouring from the oceans on the turn of the seasons does make that exceedingly unlikely, the current AGW hypothesis is still that we are only just able to re-absorb the seasonal variation as the reservoirs are overwhelmed by man’s emissions.
And we got lucky in 2020 when the emissions dropped from lockdown because that was balanced by an unknown magic that occurred in that year only.
Yes, this is essentially Nick’s reply to me. This time its different, and one source of the difference could be overwhelming of natural reservoirs by the human driven increase.
Well, we will see, because the world is not going to reduce. So when the next temperature downturn comes, either atmospheric CO2 will fall, or it will not.
Some of us may not be around to see the result, but that is the crucial experiment we are conducting.
I remain skeptical. I think within 50 years global warming will have vanished as a topic of concern, and will play a role mainly as a chapter in an updated book of the history of human mass hysteria. But we shall see.
My opinion is the same is yours. But our opinions may be wrong. We’ll find out in 50 years time or so.
But it doesn’t change the fact that this paper is supporting an hypothesis that was abandoned 40 years ago and doesn’t address what replaced it or why it was replaced.
Abandoned by whom? Climate modelers?
Please send a copy to Al Gore, you may need to write a few additional explainations using everyday images he will understand, like carts and horses.
On a personal note I am a bit concerned about the kind of winter coat I will need in three thousand years time. I have concluded, I will cross that frozen bridge when I get to it….
All very well for the long term scenario but with levels now above 400ppm we really need to stop accepting ice core measurements as a sound indicator of short term variability in atmospheric CO2.
it is increasingly likely that large short term variations occur that never make it into the ice core record.
Exactly! What Nick Stokes and others ignore is that their graphs of the last few decades mean nothing. The time resolutions of the two different types of measurements DO NOT allow simple splicing together. What Nick needs to do is to find the average of the last 1000 to 10000 years to splice onto the long record. The last 150 years isn’t even a spot on the graph.
Agree.
Even an ice age won’t shut up the climate doomsters.
Right, but an ice age would be clear proof that warming causes cooling.
Nothing will silence the doomsayers. I often ask doomsayers what, if anything, would have to occur for them to stop doomsaying. I’ve never had a coherent answer.
Whilst all very impressive and full of data charts and learned references, and some fairly wrong philosophy which fortunately subtracts little, applying the principle of parsimony or Occams razor to all this, it really can be expressed in one sentence:
“The lack of tight temporal correlation between CO2 variation and temperature, both in ice cores and the modern record, refutes the proposition that CO2 changes drive temperature, and suggests that the reverse is more true, and utterly refutes the proposition that the most significant driver of modern climate change is CO2″.
Modern climate change theory is easily subject to Popperian refutation, has been and has failed to show sufficient correlation.
How is this statement to be justified?
It is so easy it isn’t true.
What the physics says, is that CO2 forcing, is proportional to the log of CO2 concentrations, and losses are proportional to the fourth power of absolute temperature… for wide variations in CO2 we need to preserve the log in our calculations, but for the expected small variations in absolute temperature, we can assume a linear approximation to the slope of the fourth power curve
So, neglecting other factors, the basic ‘equation of climate change’ becomes
ΔT=λ.k.log(ΔCO2)+[other stuff]
Or in words, the change in temperature is proportional to the log of the CO2 concentration, times a constant k (derived from the physics) times a ‘feedback factor’ which is given the name ‘lambda’.
[other stuff] includes all the other things that we know affect the climate, like solar insolation, cloud cover, ocean current cyles , volcanoes and so on. As well as things we dont know that may affect the climate. like cosmic rays and so on.
Now the proposition that the only significant driver of modern climate change is CO2, means that we can more or less relegate [other stuff] to ‘noise’ on the main signal of interest – namely ΔT=λ.k.log(ΔCO2).
This is where climate change started. The value of k is determined from the physics. And λ.k.log… is normally expressed as ‘climate sensitivity – that is, the expected change in temperature for a doubling in CO2.
If I remember correctly it’s about one degree C for each doubling of CO2 for a lambda value of unity – no feedback present.
However the ‘scientists’ and I used the world advisedly – found that the temperature changes they were seeing in the record were actually too large to be explained by
ΔT=k.log(ΔCO2).
That is the unamplified effects of CO2.
At this point they had a philosophical choice of which way to modify the hypothesis. They could have abandoned the proposition that CO2 is the only significant driver of modern climate change and made [other stuff] be causing the changes, coincidentally with the rise in CO2. The ‘natural variations’ theory, but of course that doesn’t leave much room for further study. Nor justify a draconian legislative approach to coal burning….
…so they introduced dear old lambda. A mathematical curve matching trick that multipled the physical (as in ‘physics’) effect of CO2 by a given amount and allowed a fair match to be made over temperature rises in the 1970s and 1980s.
ΔT=λ.k.log(ΔCO2) could be made to fit the modern curve! And best of all, if true gave exceptionally scary predictions about future climate change, and with a cursory glance at Vostok ice records, which at a glance showed to a very crude approximation that CO2 and temperature varied together and were correlated, a “Yee Hah!” moment resulted and the Cyan t*ts saw huge grant money, fame and fortune, in their personal horoscopes…
This greater than unity lambda factor is te infanous ‘positivce feedback’; which made the curves fit and made AGW really scary, but was based on assumptions about water vapour feedback that proved to be utterly wrong – Willis ‘thunderstorms are thermostats’ is a FAR better match to reality than ‘muggy humidity makes it even hotter’ …
The science was settled, and around 1990 I like many others felt that at a cursory glance the science was settled and I moved to a house 300′ higher in altitude. Yes. I really did. I was living below the level of the local river, and only 200 yards from it. And levees break.
Roll forward 20 years to around 2010, and two things had happened. Temperatures had pretty much stopped rising through the whole noughties and the coldest winter since the 1960s had destroyed my Escallonia bush, and we were fighting to save an exceptionally beautiful landscape from being destroyed by windmills.
So I went looking for reason to discredit wind power. Since the real reasons “it’s ugly and noisy” wasn’t cutting much ice. To cut a long story short, that led to the development of the Gridwatch site and a fairly deep research into the statistics of wind and solar power, to reach the conclusions that whatever the reason people might have for deploying them, reducing CO2 emissions was not one of them.
Because if that was your aim nuclear power was cheaper and far far better, and the obvious choice…and I wrote that up.
..and that’s when I encountered the political aspect of climate change as I was then denounced as a ‘well known climate denier’ – when all I had said was ‘renewable enrgy is not a very good way to reduce CO2’ And as for ‘well known’, I had broken the habit of two decades and actually used my real name for the first time ever on the Internet. So how could I be ‘well known’?
Obviously someone was lying to defend climate change, which I hadn’t attacked at all.
Why?
And that is when I went looking for the ‘science’ and nowhere found what is and must be but is never stated as such, the “equation of man made climate change”
Namely
ΔT=λ.k.log(ΔCO2)
Now the science – the physics – leaving out people who don’t understand it ‘there is no downwellling radiation’ blah blah – is in fact settled. That equation, with suitable values of lambda, does in fact describe climate response to atmospheric CO2, but it does of course (largely) leave out [other stuff] which is justified by the metaphysical proposition that CO2 is the only important driver of modern climate change.
And yet by 2010 we were well into what we know as the ‘pause’. The importance of the pause cannot be overstated – it is in itself a statistical anomaly that refutes the statistical anomaly that led to the climate change amplification hypothesis in the first place!
And as the pause rolled out through the teen years – 2010 to present – the problem for alarmists got worse and worse.
ΔT=λ.k.log(ΔCO2) could only be made to fit the overall 1970-2020 period with drastically reduced and non scary values of lambda. Even worse, the fit was pretty poor. You can’t make a straight line fit what was patently a rise followed by a plateau.
Look at the attached graph from NOAA at mauna loa. This is the input to the above equation.
(late edit. It seems you cant actually insert graphs into the text properly – sorry)
The ΔCO2 part of it. Look at how smooth it is steadily showing inceases that are allegedly due to human activity.
I wanted to find a graph of global temeperature but as you know, raw data no longer exists. The ‘pause’ has been written out.
But until the last few years of frantic temperature adjustment it was clear that no single value of lambda was going to allow a decent curve fit between CO2 and temperture rise.
In short, behind all the obfuscation and paramaterisation and modelling paraphernalia, the proposition that ΔT=λ.k.log(ΔCO2) was no longer sustainable as the single most dominant driver of modern climate change.
It might well be part of it – Judith Curry’s position is that it is, and its important, but just how important, is what she is trying to establish, and it’s certainly not Greta Thunberg or Extinction Rebellion important.
The fact of the pause meant to real scientists, that the relegation of [other stuff] to second order effect, was a mistake. Whatever was driving climate was more powerful than CO2 .
And you can see this in the year on year fluctuations in temperature. we have hot years and we have cold years. All of which totally override any CO2 effects, but these are written off as ‘just weather’ …no, long terms changes in weather ARE climate.
And if it had been merely an academic theory, that is where it would have ended. Nice theory, but not, in the end, of any real relevance.
Too much was riding on it. The problem of how to resurrect it boiled down to one thing. Temperatures had to be – either because you utterly believed the proposition, or because your job, career, reputation, income stream, product justification, political existence depended on that proposition being accepted as correct – rising in a way that matched the rise of CO2. The Pause had to go. And magically it has disappeared from all the temperature records. As has the LIA, the MWP, the RWP, the HO…
ΔT=[Serious other stuff]…. + λ.k.log(ΔCO2)
was what the pause said was a better equation, to real scientists.
If true, it makes the whole political social and economic issue of man made climate change supremely irrelevant. Climate may change, but since we aren’t causing it and we don’t know what is, we have no hope whatsoever of changing it.
Man made climate change was refutable, and the Pause refuted it. By erasing the pause from temperature records, scientists moved man made climate change from a scientific hypothesis into the realms of a metaphysical dogma.
It has proved to be, as someone once said, “a most convenient lie”.
And now we are caught in it, no one actually believes it – well not real scientists or politicians anyway – but no one knows quite how to escape from it either.
“It turns out we have been lying to you, often quite deliberately and knowingly, for the last 30 years for political power and profit” doesn’t cut it really, does it?
Leo, I thought the paper was good but your comments are brilliant. I will print it out and frame it. I will keep it on a memory stick and show (if I may) to any alarmists who want an arguement.
Leo, your explanation that there is a lot of “other stuff” that affects climate (Milankovich cycles, sunspots, El Nino/La Nina, ocean currents, etc.) besides CO2 concentration is excellent, but the whole idea that
dT = k ln [CO2]
is a farce in itself, by the simple nature of the equation, whether or not k is multiplied by some feedback amplifier “lambda”. Set the CO2 concentration to zero, and dT goes to negative infinity, but physically, the minimum possible temperature for anything is absolute zero. Physically, if all the CO2 were removed from the air, the “warming” due to IR absorption by CO2 would go to zero, not negative infinity.
Similarly, this erroneous Arrhenius equation also has no limit on the upside, save what would be predicted if the atmosphere was pure CO2 ([CO2] = 1,000,000 ppm). In reality, the amount of IR radiation emitted from the ground is limited based on the Planck function, and once all that radiation (in the wavelengths where CO2 absorbs it) is absorbed, adding more CO2 to the atmosphere would not increase the radiation absorbed, it would only shift that absorption to a lower altitude.
In his defense, Arrhenius was a chemist, and from thermodynamic identities, he derived similar relationships for chemical processes. For example, the rate of reaction for a first-order reaction is frequently represented as
r = K exp(-E/RT) [C]
where
r = reaction rate
K = a constant
E = activation energy
R = ideal gas constant
T = absolute temperature
[C] = reactant concentration
If the reaction rate for a concentration C1 at a temperature T1 is the same as that for a concentration C2 and a temperature T2, then it can be shown that
T2 – T1 = (T1T2R/E) ln (C2/C1)
For a small temperature difference, T1T2 is roughly equal to T1^2 (nearly constant), and the above equation has the same form as that used for climate change.
It is possible that Arrhenius (in 1896) thought that warming due to increased CO2 in the atmosphere was a chemical reaction, and that equations valid for chemical reactions would be valid for absorption of IR radiation. How well-known was the Planck equation for radiation intensity as a function of temperature and wave number, or the Beer-Lambert equation for absorption of radiation, or even quantum theory at that time? This was 9 years before Einstein’s first paper on the Special Theory of Relativity.
But climate modelers since the 1980’s should be aware of the advances in physics since the time of Arrhenius, that emission and absorption of radiation do not obey the same equations as chemical reactions, and the more accurate equations (Planck, Beer-Lambert, quantum theory) should be used in climate models, not an antiquated non-applicable model that was debunked decades ago.
The entire concept of “climate sensitivity” to a doubling of CO2 concentration is totally non-physical to anyone with a basic understanding of radiation emission and absorption, so why has the IPCC been using the same wrong equation in their models for over 40 years? Just because Arrhenius was a good chemist didn’t make him an expert on radiation!
Steve
Why do we talk as if only radiation moves heat in the atmosphere?
What happened to convection?
Ultimately there is no convection in outer space, so radiation is what defines heat loss of the overall system.
Howver convection has an interesting part to play. Cf Willis’ thunderstorms. Convection can carry heat well above most of te atmosphere and its CO2, resulting in greater heat loss unhampered by greenhouse gasses.
Steve, whether or not my equation is correct, or whjat the alarmists use (which are not necessarily congruent, the main point stands
let me rewrite it as ΔT=λ.k.f(ΔCO2) where f is an arbitrary linear function.
The massive variations in global temeparuter year on year show that in the limit there is no conceviable form of f that can create that behaviour. I mean as you ponted out with CO2 held stable (and it only varies slowly year on year) there are massively large fluctuations in global temperature.
The thesis that we cannot just multiply the greehouse effect by some arbitrary feedback still holds, we need [other stuff] to be added to it.
And the effect of [other stuff] has to be way more significant to match the observed data.
And that refutes the central claim of the alarmists. Modern climate change cannot be dominated by (ΔCO2).
And in that case we are wasting time and money acting as it it was.
A very enjoyable comment. Thanks.
Leo
Awesome. “Trapped in their own lie”.
Reminds me of the research by the late biologist Steven Jay Gould into the Piltdown Man fraud. A group of scientists created the fraud for a laugh, but it went too far and got accepted. Then WW1 started, some participants died. One survivor (Teilhard du Chardin) could not bring himself to admit the fraud. It became established science for half a century.
A fine example of how “accepted” or “settled” or “consensus” of so-called “scientists,” especially once they have latched on to a pet hypothesis and admitting its flaws and failures would be a big hit to their egos, means absolutely nothing.
If it’s supposed to be “science” present your evidence. The CO2 fetishists have none, and should have been sent packing decades ago. Eisenhower is proven right by this fiasco.
Wow! You don’t often see a reference to Aristotle himself in papers on atmospheric science.
Or Theophrastus, or Buffon, or Nikolov and Zeller, or Pat Frank.
Considering the scientific incompetence of your referencers, Nick, their silence is an honor I am happy to receive.
Congratulations, you made the honor list.
“…. their silence is an honor I am happy to receive.”
Good, as you will continue to receive that honor until you snap out of it. Interestingly, Andy May was recently awed by the number of peer reviewed papers authored by someone, and the number of citations/paper received. How’z that werkin’ out fer ye with on your bombshell error propagation paper…?
You never lose an opportunity to be foolish here, bob.
Nick
nor references to “12 years to human extinction” XR or “climate is collapsing” Greta Thunberg either. Or “photosynthesis? What photosynthesis?” David Attenborough? What happened to due diligence?
The paper alludes to the second thing I have always found inexplicable in climate science.
The first thing is why practitioners think it reasonable to take a series of models most of which are demonstrably failing correctly to predict temperatures, then average them with the few that do correctly predict, and call forecasts derived from this average more reliable than ones for the few models that have been verified to be accurate. Willis Eschenbach more or less made this point in his recent post.
The second thing I have always found inexplicable is the account, or rather lack of one, of the role of CO2 fluctuation in the fall of temperatures after previous warming episodes. To show that CO2 is the control knob you not only have to show that rises in it produce warming. You also have to show that falls are what produces the subsequent declines that we see in the record.
So it is a reasonably plausible hypothesis that a small amount of initial warming due to Milankovich could cause a rise in CO2, which could then lead to more warming.
However, this account needs to explain why the warming cycle ended and was succeeded by a cooling. To prove CO2 is the control knob, you would have to show both that rises in it preceded the warming, and that falls in it produced the cooling.
You can get over the difficulty with the time lag by the Milankovich hypothesis. But if you are then obliged to come up with some other ad hoc explanation of the cooling, on the lines of, the cooling happens because of some external cause, this then produces a fall in CO2, and this then leads to further cooling….?
This is like Ptolemaic epicycles, invented to account for the observed motion of the planets while keeping the assumption that the orbits were circular. At some point it becomes clear that the correct explanation is that the orbits are not circular but elliptical.
Similarly in the present case. You have to invoke two separate independent triggers (one as far as I know unspecified so far) to get CO2’s supposed role going and account for the observation that warming and cooling precede, and do not initially follow, movements in CO2.
it gets far more plausible that causation is going the other way, that the warming is causing the rise in temperature, that the cooling is causing the fall, and that we do not need the alleged secondary causal role of CO2 at all.
The inability to account for the cooling at the end of warming periods in terms of CO2 concentration falls is thus a fundamental problem with global warming theory as currently proposed. One ad hoc explanation, for the warming, is survivable.
But like Ptolemy, they are trying to account for the warming and the cooling in terms of CO2 movements, but in order to do that have to suppose some extra mechanism to get both the CO2 rise and fall started.
The paper is correct, its a fundamental epistemological problem with the current theory. Its much more plausible when you get to this point to conclude that temperature drives CO2, not the reverse.
“But like Ptolemy, they are trying to account for the warming and the cooling in terms of CO2 movements, but in order to do that have to suppose some extra mechanism to get both the CO2 rise and fall started.”
Who tries to do that? I applaud Willis’ advice – quote their exact words. Who are they? In fact they don’t, and that is the fallacy of this paper. It’s explanation of the ice core record is old but true – Milankovitch drives temperature, which drives CO2, which feeds back a bit on temperature. We knew that. CO2 could be a control knob, but no-one was applying torque. Now we are, by mining and burning carbon.
The AR4 had a specific box on this topic titled:
FAQ 6.1 What Caused the Ice Ages and Other Important Climate Changes Before the Industrial Era? They said:
“Great progress has been made in understanding the causes and mechanisms of these climate changes. Changes in Earth’s radiation balance were the principal driver of past climate changes, but the causes of such changes are varied.”
…
“Global climate is determined by the radiation balance of the planet (see FAQ 1.1). There are three fundamental ways the Earth’s radiation balance can change, thereby causing a climate change: (1) changing the incoming solar radiation (e.g., by changes in the Earth’s orbit or in the Sun itself), (2) changing the fraction of solar radiation that is reflected (this fraction is called the albedo – it can be changed, for example, by changes in cloud cover, small particles called aerosols or land cover), and (3) altering the longwave energy radiated back to space (e.g., by changes in greenhouse gas concentrations). In addition, local climate also depends on how heat is distributed by winds and ocean currents. All of these factors have played a role in past climate changes.”
…
“These examples illustrate that different climate changes in the past had different causes. The fact that natural factors caused climate changes in the past does not mean that the current climate change is natural.”
That is what “they” are really saying.
The AR4 link has changed; the FAQ page is here
Yes, thanks. But if we admit that rises and falls in temperature can happen without any CO2 effect, and that CO2 rises and falls have historically been consequences of the temp rise and fall, then the argument for disaster and a causal relationship from the present CO2 rise is much weaker.
Its never happened before, but its going to happen now. That needs a higher and different level of evidence from the argument that its happened before and will happen again in spades.
“Its never happened before, but its going to happen now.”
The key is that the amount of carbon in circulation has not changed in the past on the multi-millennial time scale, so a change in CO2 could not drive change in temperature. It is changing now, because of our mining. This is unprecedented.
Nick,
Back to Figure 1, above. CO2 ranging from 180 to 280 ppm and temperature from -8 K to +2K. We’re “torquing” away at 400+ ppm now – where’s the commensurate warming?
Fig 1 shows the response of T to Milankovitch. That is where the 10K comes from. If it was caused by CO2, the ECS would be about 20. It wasn’t. But now we have CO2 forcing of T but not Milankovitch.
No, Nick. Fig. 1 shows that Milankovitch drives T, and T drives CO2. Note the direction of causality.
Exactly what I said.
So, increasing T increases CO2 (180 => 280 ppm) but the additional CO2 doesn’t have any additional impact on T. However, increasing CO2 (280 => 400 ppm) by “mining” will cause a deleterious increase in T. Got it, thanks!
And a glaciation at 4,000ppm means nothing, because we’ll just refuse to consider that. LMFAO.
Which you would know how, given no measurements of the “carbon cycle” even today?! LMFAO.
Your referenced guesswork, estimates and assumptions are not facts or evidence.
If rising temperatures caused CO2 to be released from the oceans, and that it turn generated more warming, then there would be runaway warming whenever the temperature rose, for any reason at all!
This obviously has never happened, or the current temperature would be much higher, which utterly destroys that conjecture. I don’t understand why an even moderately intelligent and moderately educated person can’t understand this.
Or alternatively, if Milankovitch triggers an interglacial, CO2 outgasses and then acts as a multiplier for the warming, how do you get back to an ice age once the CO2 is in the atmosphere? Surely the all powerful CO2 is now overwhelming Milankovitch?
Looking forward to NS explaining why the CO2 spike width can be twice the temp width and still have CO2 control temperature. How can temp be falling whilst the CO2 stays high?
“If rising temperatures caused CO2 to be released from the oceans, and that it turn generated more warming, then there would be runaway warming whenever the temperature rose, for any reason at all! ”
That’s what I was thinking.
Thank you very much for plainly clarifying the point Nick.
For all the rest;
It is pretty obvious:
The moment the radiative theorizing of Milankovitch Cycles driving climate stands falsified,
the entire premise of AGW or manmade CC falls.
Both already falsified by the modern data and observations, plus the GCM simulation results.
CO2 atmospheric concentration keeps going up steady, temperature clearly decoupling and not following.
Usually science and scientific endeavor is not driven, appreciated or depending on the size or smartness of the thermometer… or the price for that matter.
cheers.
You get the Billy Madison award for that post
Dr.
Come on.
That is a very cheap and very blant ‘feedback’.
Dr.Sarangeti. (is not it)
Or shall it better be;
“Dr. Madagascar”, for better accuracy and precision!
How the zebras doing doc. !
cheers
“CO2 could be a control knob, but no-one was applying torque. Now we are, by mining and burning carbon.”
Ok Nick. So assuming “we” have supplied torque on the order from 280 to 400 ppm nothing much has happened, even if we accept the data tampering of the historical records. Please tell us why you think the GCMs should be believed.
The temperature has risen about 1 C, which is what GCMs suggested.
So Nick, you are persuaded by computer models. Brave man. What will persuade you that you are wrong?
How do you know that was caused by CO2? YOU DON’T.
Thank You!
But it’s even worse than that – each time the temperature “trend” switched from warming to cooling or from cooling to warming, there is a period (with a similar time lag) of REVERSE correlation – which tells anyone but the logically challenged that CO2 doesn’t “drive” Jack Sh!t.
The fact that temperatures consistently start to RISE when atmospheric CO2 is FALLING, and near its LOW point, and consistently start FALLING when atmospheric CO2 is RISING, and near its HIGH point, just puts the exclamation point on it!
The thing that links temperature with atmospheric CO2 is ‘Soil Bacteria’
Bacteria are extremely temperature sensitive things, especially that they, quite abruptly, switch off below 5 Celsius.
(Its why your fridge works at the temperature it does)
How long have humans been around?
2 Million years?
Isn’t it strange that Ice Ages have been happening, regularly, for the last 1 million of those years?
Would you or would you not concede that the Default Vegetation on this Earth is = Forest?
Grasses are mostly annual plants, trees are perennials.
Grass does not grow under trees. In clearings yes. But not under perennial forest.
Would you or would you not concede that forests are hopeless places for the likes of Humans to find anything to eat.
We don’t climb very well nor do we fly very well compared to myriad other critters. If anything good did appear near the top of a tree, any number of birds/animals would eat it first.
So, we learned to cut and burn the trees. To make fake clearings.
This allowed the annual grasses to grow and lo-and-behold, Large Herbivores appeared to eat those grasses.
Large herbivores are nice to eat, cannot fly away, don’t climb trees and even better, they come to us. We don’t even need to chase them.
What Is Not To Like
But cutting trees, optionally burning them, lowers the (local at least) Albedo
It gets warmer out on the grasslands than in/under the forest.
At which point, the soil bacteria kick up a few gears – they accelaertae their decomposition of anciaent plants material, esxpired fungi that had been eating cellulose & lignin and also their own dead ‘bacterial relatives’
When they do, they create CO2. Insanely large amounts of it. They might have 3 metre depth of ‘stuff’ to consume.
But when their ‘food’ depletes because of their increased appetite, the soil they live in gradually dries out. All that cellulose and lignin retained massive amounts of water – and water – having massive Heat Storage Capacity regulated the daily and annual temperature cycles.
Things got even hotter
Bacteria worked even faster, creating CO2 and drying out the landscape.
Then suddenly, the bacteria found there was nothing left to eat – they’d eaten that 3 metre depth of stuff and all that was left was dust, sand and rocks and – No Water
Sounds like desert to me – whadda ’bout you?
Deserts are, because they are dry, are in fact cold places. There may be high (daytime) temps but there is no energy storage.
So, not only does the high temp dissipate/radiate away the incoming solar as fast as it ‘incomes’ – temps plummet at night.
Thus and as Greenland is now discovering, The Ice creeps south, just a few miles every year until it covers the desert. It may cover an entire hemisphere as far south as (maybe) 40 degrees latitude.
I’d call that: “Ice Age”
At which point. the bacteria are frozen into dormancy, CO2 production effectively ceases and atmospheric levels fall – as it dissolves into the ocean, is snowed out into the ice or used up by the remaining plants around the Tropics.
But the Humans are equally frozen out so they retreat to the Tropics where they continue slash & Burn.
But, The Polar Vortex and associated Jet Stream follows them. Because it is now so cold ‘ooop Norf,’ and the landscape so flat boring and barren (ice sheet) the surface winds can reach very very high speeds (laminar flow) ##
When they do, they pick up huge amounts of dust soot smoke from man’s continued slashing/burning/desert-making and carry that ‘dust’ back up North – which lowers the ice’s albedo and, after a while, the ice crumbles.
But it takes A Long Time – 80 or 90 thousand years, compared to the 10 thousand it took to make the ice
That is CO2. That is Ice Ages, Interglacials and the timings thereof
Not Dancing Faeries. Not Phlogiston . And no-one with any guts or ‘character’ or personal integrity gives a Flying Fig about what the Emperor is waering
## In’t that a funny thing, Climate Science says high temps make high speed winds.
While they drive around in an SUV with a huge plastic air-dam under the front bumper, patently clueless as to why its there or what it does.
We Are Doomed
It take guts and (personal) integrity to admit you are wrong, epic guts.
And NO-ONE now on this Entire Planet has got any – they were flushed down the toilet attached to the metabolites of sugar, alcohol and cannabis
Double Doom
Please could someone explain to me what this means?
Because, in terms of how the climate is modelled, it sounds like rubbish.
P. Richet is referring to the fundamental equation of thermodynamics dU = -p dV + T dS, also known as Gibbs equation. It can easily be derived from the first law dU = 𝜹W + 𝜹Q by using the definition of entropy dS = dQ/T. The idea of the theorem is, that in a closed system the change of the internal energy U can be expressed as a product of an intensive quantity (p,T) and an extensive quantity (V,S). An intensive quantity does not change its value when the volume of the considered system is altered. P. Richet wrote a textbook on thermodynamics!
We were headed to a new ice age
And then we were not.
We are headed to a new global hothouse
Only we aren’t.
Look around you….
Pascal, the ferocity of the response from the usual suspects means that you are right over the target. Well done.
It seems strange that Nick seems to ignore that fact that temperature, not only leads the rise in CO2, BUT, the length of each temperature spike is approximately half that of CO2.
Could CO2, from any cause, be leading the temperature when the CO2 spikes are nearly twice as long as Nick’s temperature spikes?
Seems like a tall order to believe temperature is overwhelmingly driven by CO2 when the lead/lag AND spike width of both, are taken into account.
“Seems like a tall order to believe temperature is overwhelmingly driven by CO2 “
I don’t know how you can have failed to notice that I have been saying, over and over, that at that time T was being driven by Milankovitch forcing, not CO2.
NS says “at that time T was being driven by Milankovitch forcing, not CO2.”
So at what time did CO2 decide it would force T? AFAIK, its generally agreed the laws of physics aren’t changing with time.
So was it, like, CO2 got to the 20th century, woke up and decided “I think I’ll do some temperature forcing today”?
If the global temp in the ice core record in Cycle II can drop 8 degC whilst CO2 remains almost constant around 270 ppm, the effect of Milankovich must be far more significant than CO2. Note that from around -106Kyr to -100Kyr temp rises 4 degC but CO2 is hardly changing at all and is still on its general downward trajectory to a glacial.
CO2 must be a bit player and, even with some positive feedback from CO2 it can’t be anything other than very modest. On those downswings, CO2 is clearly lagging temperature. That means Milankovitch must be overwhelming any positive feedback from CO2.
“[…] the history of science is nothing more than a long stroll through the cemetery where ideas that were overwhelmingly accepted are now resting in peace.”
Well said. There’s been an open grave in that cemetery for ages, waiting for the theory of anthropgenic global warming, and it’s high time it gets filled.
the theory of anthropogenic global warming
Represents a new age, the age of the zombie theory. Each and every refutation and falsification is met with fervent belief bordering on the [now socially acceptable] psychotic.
Heresy is punishable by cancellation and, where possible, by public burning at the stake on social media.
I think it is a mistake to compare the failure of some pre-modern non-scientific theories, such as the geocentric model, to something like the GH effect were the fundamental physics is well understood and well accepted. The problem we have now is trying to understand how the GH effect plays out in our overall climate when there is a forcing change. People are trying to use climate models for this, but because of the complexity and chaotic nature of the overall climate, they don’t work very well, and perhaps not at all. It’s an entirely different problem than a failure to understand basic physics.
“GH effect where the fundamental physics is well understood and well accepted.”… utter rubbish … the effect of a greenhouse gas in a jar is well understood … the GH effect of the planet is not …
I refer you to a recent post by Willis Eschenback wherein he said this:
“This downwelling radiation resulting from the atmosphere is what is known as “greenhouse radiation”.
This “greenhouse radiation”, the downwelling radiation from the atmosphere, leaves the surface warmer than it would be if there were no greenhouse gases—if there were no GHGs, the upwelling surface radiation would go straight to space and be lost. But instead, the upwelling surface radiation is absorbed by the greenhouse gases in the atmosphere about half of it is returned to the surface.
(Important note: the above is all well-established science. The downwelling radiation from both the atmosphere and the clouds has been measured, not modeled or estimated, by thousands of scientists around the planet for decades. There’s an entire network of observing sites around the US called SURFRAD, which as the name implies do nothing but measure the radiation flows, both shortwave radiation (sunshine) and longwave radiation (thermal radiation) to and from the surface. Here’s a typical 24-hour measurement of the downwelling infrared (longwave) “greenhouse radiation” from one of the SURFRAD stations.”
That is what I meant.
For me, there is one very simple, key point in the paper. And it neatly sidesteps the controversial issue of lags. If CO2 controls temperature how can the width of the initial temperature spike rise/fall at the start of the interglacial be approximately half the width of the corresponding CO2 spike?
And, in the words of Mr L. da Vinci “simplicity is the ultimate sophistication”. If you lag the data sets with respect to each other to align at the start of the rapid interglacial onset, how can temperature drop so quickly afterwards whilst CO2 stays high if CO2 is a dominant control?
Expect lots of convoluted back to front reasoning to follow as the data is tortured to fit the model.
“how can temperature drop so quickly afterwards whilst CO2 stays high if CO2 is a dominant control”
The CO2 changes look dramatic, but are not large relative to the amounts needed to really affect temperature. They are a few tens of ppm; we have added 130 ppm, and the worry is about adding a whole lot more. The smallish CO2 changes just reflect solubility changes. Temperature is going its own way.
Er, I said the temperature changes quickly downwards while CO2 stays high eg cycle IV or cycle II in the Figure 1. Its very clear in Cycle II – CO2 almost constant, while temps go down very quickly. That’s the opposite of what you just said.
So why are you trying to answer something I didn’t ask?
How can the width of the temperature spike be half the width of the CO2 spike if CO2 controls temperature?
“if CO2 controls temperature?”
I’ll say it yet again, CO2 is not controlling temperature here. Something else is. Smallish changes in CO2 result (solubility). If the CO2 remains high, that just means that the temperature effect on CO2 was weak, not the converse. It could be a measurement issue.
Of course Nick, its not the model that’s wrong its the data! It could be a measurement issue! ROFL! Of course it could, because that’s the warmest way. Blame the data when it doesn’t fit the model! HaHaHa! ROFL! All data is correct BUT ONLY IF IT FITS THE MODEL. Feynman is now laughing his socks off at you! And so am I. I heard that kind of nonsense at the Geol. Soc climate conference I attended for the last 2 days. Whenever something doesn’t fit, its the data wot must be wrong. Couldn’t possibly be the model.
So in Cycle II CO2 stays at an almost constant level of 270 ppm for nearly 13000 yrs, but temp crashes precipitously by over 8 degC.
So just remind me how CO2 controls temp and “something else” controls it as well. What is the “something else”? Fairy dust? Unicorns?
Still waiting Nick. What’s the magic “Something else”?
The “something else” as has been spelt out ad nauseam by Richet among others, is Milankovitch forcing (orbital).
“Blame the data when it doesn’t fit the model!”
You just don’t seem to get your head around the basic here. The AGW model is not involved. This is CO2 responding to temperature via solubility. I don’t have any attachment to that effect, and I don’t know why there may be some apparent slowness in parts. I think it is at the limit of resolution. It has nothing to do with the GHE.
Resolution? LOL. So there are detailed samples of the CO2 response over 21 samples over the peak of Cycle II and the same number in the temperature data…..and the temperature drops off very rapidly whilst the CO2 stays constant. How can temperature be controlled by CO2? So then you say its Milankovitch controlling the drop in temps – which means the magnitude of the effect of Milankovitch MUST BE many times greater than any CO2 control on temperature.
Or does CO2 only control temperature when it feels like it?
NS says “This is CO2 responding to temperature via solubility”
So where’s the evidence linking CO2 as a causal effect on temp?
As far as I can see, you can demonstrate that point from ices cores by (a) lag and (b) width of peaks. Lag is contentious but the general evidence possibly suggests temperature leads CO2. But width seems to be completely unambiguous..
How can the width of the temperature spike be half the width of the CO2 spike if CO2 controls temperature?
“So where’s the evidence linking CO2 as a causal effect on temp?”
I give up. I’ll just quote from about three comments ago
“I’ll say it yet again, CO2 is not controlling temperature here”
Nick gives up! Is this is a first?
“CO2 is not controlling temperature here”.
If its not controlling temperature here, why not? And what’s then the evidence that it could ever do that?
Blimey!! The Great Stokes is beginning to accept what is obvious to any non-scientist, that cause must precede effect?
Lets also remember there are people who have built their careers on saying that CO2 is the “accelerating sauce” in the ice records, and that Milankovitch is a but player.
Are they wrong Nick?
Thinking scientist
”CO2 is the “accelerating sauce” in the ice records”
do you have a citation please?
Earth’s orbital eccentricities periodically (millennia) increase insolation at high latitudes (up to 100W/m2 ) and it is this that raises GMTs ‘naturally’, in the process atmospheric CO2 increase (ocean outgassing) follows with a lengthy lag. All commensurate with natural carbon in it’s cycling between land sea and air.
Temperature rise led and CO2 followed as a FEEDBACK.
Ergo CO2 was not the driver. Not the “Control Knob”
Now CO2 added to the carbon cycle by us via the burning of locked-away fossil carbon is driving T rise and is therefore (currently) the “control knob”.
increased CO2 in the atmosphere will lead to reduced cooling of the planet whether it drives or is a feedback, comes first or second, by virtue of it being opaque to terrestrial IR.
No simpler than Nick’s explanation – just different.
And it cannot be made simpler.
So if not understood – something else must be amiss.
Nick, CO2 levels rose 20 ppm from 1750 to 1900 whilst cumulative emissions were just 5 ppmv over the same time period. Presuming that this was in large part caused by land usage, how much of the CO2 rise since the turn of the century (1900) would you attribute to land usage and why? Further, how much confidence can we put in your answer? (could it be that we just don’t know?)
Thanx in advance. Nice to see you dominating a carbon thread rather than that dingbat ferdinand. (at least there’s the hope of rational discourse with you)…
Speaking of irrational discourse, has any one heard from mosh of late? (don’t tell me — covid got ‘im!) Anyone else miss our resident english major ‘sides me?
“Presuming that this was in large part caused by land usage, how much of the CO2 rise since the turn of the century (1900) would you attribute to land usage and why? Further, how much confidence can we put in your answer? (could it be that we just don’t know?)”
There is data, and this is analysed here. The difference is accounted for by land usage. Here is a plot of the relevant period.

I always found Ferdinand (and Mosh) totally rational.
(thank you nick for the link and i’ve dealt with you & i’ve dealt with ferd — ain’t even close… 😖)
Why was there never any runaway warming in Earth’s ancient past?
https://tallbloke.files.wordpress.com/2010/07/agw-an-alternate-look-part-1-details-c.pdf
“Conclusion
Beyond 200 ppm, the Leckner curves indicate that there is a negligible change in emissivity and hence a negligible change in forcing. That is: Above 200 ppm atmospheric concentration of CO2 there is no increase in the greenhouse affect due to CO2, and changes to human emissions of CO2 will have no affect on climate. “
************
And why won’t it happen today with our contributions to the CO2 level in the atmosphere?
https://wattsupwiththat.com/2020/10/26/study-suggests-no-more-co2-warming/
“[A]t current concentrations, the forcings from all greenhouse gases are saturated. The saturations of the abundant greenhouse gases H2O and CO2 are so extreme that the per-molecule forcing is attenuated by four orders of magnitude…””
*********
So I guess that I am wondering why it matters where the CO2 is coming from today. The above studies suggest that it doesn’t.
If solar activity continues to be as low as indicated by galactic radiation, the current “hiatus” may prove to be longer than the previous one.
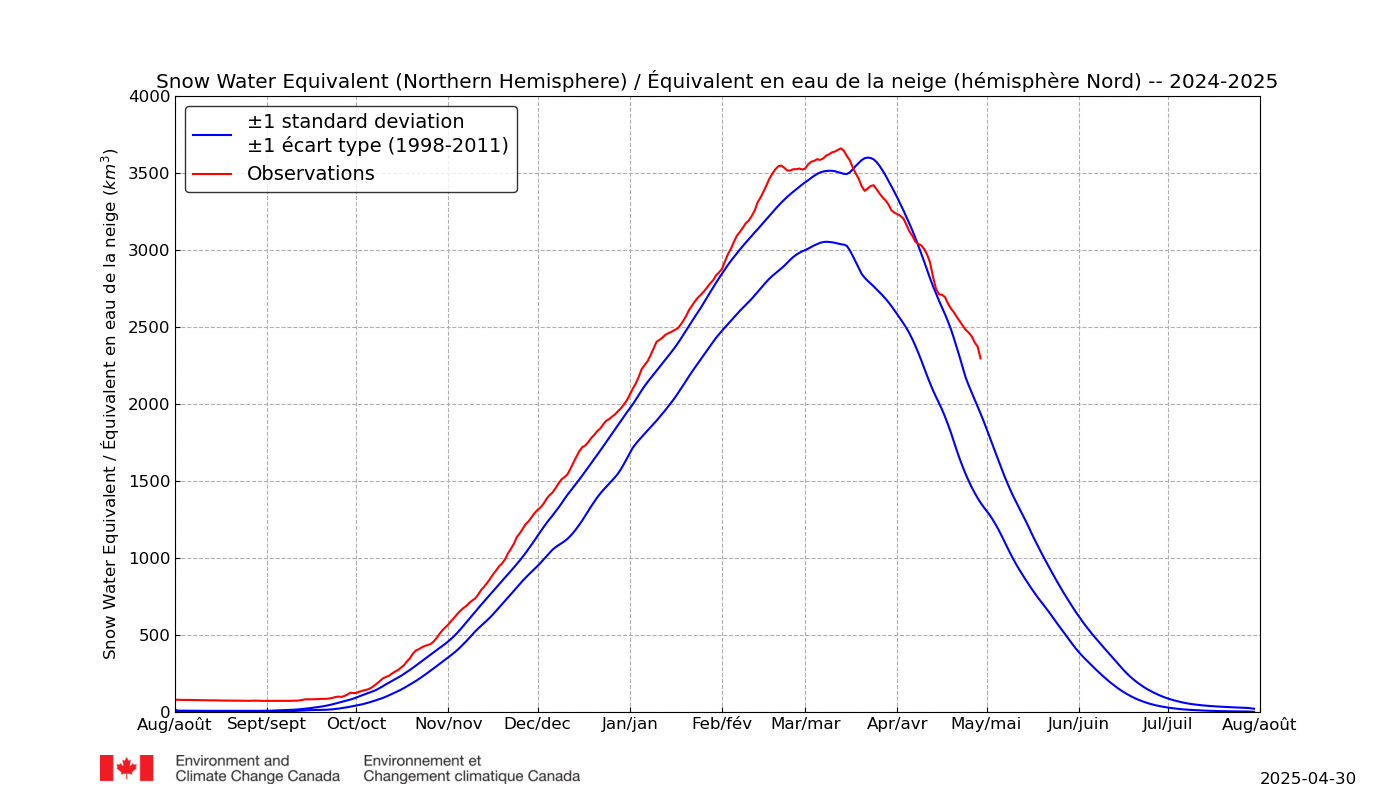
These plots present time series (updated daily) of the current amount of water stored by the seasonal snowpack (cubic km) over (a) Northern Hemisphere land areas (excluding Greenland).
When the Earth is closest to the sun in winter in the northern hemisphere there will be an increase in ice cover on the continents because the warmer oceans in the northern hemisphere will increase snowfall.
Changes in solar availability over long periods of time are definitely the cause of climate change in the mid-latitudes.
The current astronomical situation points to a watershed period in the interglacial epoch.
Please elaborate.
Radiation from the sun is the primary source of energy for the Earth’s climate system. Changes in the Earth’s orbit around the sun cause variations in the seasonal distribution and amount of solar radiation reaching the earth. Records of past climate show that there is a correlation between these variations and long-term climate changes [Hays et al., 1976; Imbrie et al., 1992]. Interglacial conditions begin with increasing mid-latitude summer insolation and end as mid-latitude summer insolation decreases. Orbital-scale climate cycles are driven largely by variations in solar radiation associated with precession, obliquity and eccentricity of the Earth’s orbit. Recent studies of the Asian monsoon show that the transitions between the glacial and interglacial conditions took place abruptly, perhaps only in century-long events [Wang et al., 2001; Yuan et al., 2004]. However, it generally takes about 10 ka for the insolation to change from a minimum to maximum and vice versa.
https://agupubs.onlinelibrary.wiley.com/doi/full/10.1029/2005GL025401
Nick Stokes – the B52 among thread-bombers
This was one of the most educational posts I believe I have ever read. The comments were more so and close to as polite as I have ever read; congrates to all.
I still need answers:
JontheTechnologist
asks:
February 11, 2021 at 4:21 PM
I have never received an answer to these questions from any Climate Scare
Alarmist: What should the earth’s perfect temperature be and has it ever been
and for how long; and what should the correct level of CO2 be and do you believe
like some that CO2 is a dangerous pollutant, and most important, if so, who
amongst us should be forced to hold our breath to stop CO2 from getting into the
atmosphere???(considering that we inhale 400ppm and exhale approximately
20,000ppm)
Last but not least, is there a published or otherwise empirical paper or experiment
linking CO2 to the Earth’s temperature?
I think
NOT.
THEN: It’s the saturation stupid!!!
Question: Last but not least, is there a published or otherwise empirical paper or experiment
linking CO2 to the Earth’s temperature?
Answer – yes – see MacRae 2008 (cited in MacRae 2019, below)..
______________________
Previously published
This is the cutting edge of climate science. If Ed Berry is correct, then both sides of the CAGW mainstream debate (about the magnitude of Climate Sensitivity – big and dangerous or small and beneficial) are both wrong – cart before horse – as I published in 2008.
Temperature drives CO2 much more than CO2 drives temperature/climate. “The future cannot cause the past”. An absolute disproof of the CAGW hypo – Shazaam!
______________________
The huge decline in fossil fuel consumption during the Covid-19 lockdown had NO impact on atmospheric CO2 increase – more evidence that Ed Berry’s latest book and paper are correct – see below.
My friend Ed says the increase in atmospheric CO2 is primarily natural, not man-made. The smartest people I know think he is correct.
Atmospheric CO2 changes lag temperature changes at all measured time scales. (MacRae, 2008). Humlum et al (2013) confirmed this conclusion.
Kuo et al (1990) and Keeling (1995) made similar observations in the journal Nature, but have been studiously ignored.
Think about that: Kuo was correct in 1990, and for 31 years climate science has ignored that conclusion and has been going backwards!
Climate Sensitivity to CO2 is a fiction – so small, if it exists at all, it is practically irrelevant.
“The future cannot cause the past.” Here is the proof, from my 2008 paper:
https://www.woodfortrees.org/plot/esrl-co2/from:1979/mean:12/derivative/plot/uah6/from:1979/scale:0.18/offset:0.17
In the modern data record, the lag of atmospheric CO2 changes after atmospheric temperature changes is ~9 months. This is an absolute disproof of the CAGW hypothesis, which states that increasing CO2 drives temperature. “The future cannot cause the past.”
In my 2019 paper below, I explained why the lag is ~9 months – it is basic calculus, the 90 degree (1/4 cycle) lag of the derivative and its integral, which is the ~3 year ENSO period.
My 2008 paper remains very important. My 2008 conclusion was duplicated and expanded by Humlum et al in 2013, for which I am grateful.
My 2008 paper has been cited by Ed Berry in his 2020-21 book and related paper, which is at the cutting edge of climate science.
“CLIMATE MIRACLE: THERE IS NO CLIMATE CRISIS – NATURE CONTROLS CLIMATE”
https://amazon.ca/Climate-Miracle-climate-crisis-controls-ebook/dp/B08LCD1YC3/
“CARBON CYCLE MODEL SHOWS NATURE CONTROLS CO2 LEVEL”
https://edberry.com/blog/climate/climate-physics/preprint3/
All warmists and most skeptics argue about the magnitude of climate sensitivity to increasing CO2, and whether the resulting CO2-driven global warming will be hot and dangerous or warm and beneficial. Both groups are probably wrong, because global cooling is happening now, even as CO2 concentration increases.
There is a high probability that the mainstream debate is wrong – a waste of decades of vital time, tens of trillions of dollars of green energy nonsense and millions of lives. Vital energy systems have been compromised, damaged with intermittent, unreliable wind and solar generation – a debacle.
Cheap abundant reliable energy is the lifeblood of humanity – it IS that simple. The green sabotage of our vital energy systems, whether innocent or deliberate, has cost lives and could cost very many more.
Scientific details here:
“CO2, GLOBAL WARMING, CLIMATE AND ENERGY June 15, 2019”
https://wattsupwiththat.com/2019/06/15/co2-global-warming-climate-and-energy-2/
Repeating, “The future cannot cause the past.”
Regards, Allan
Nick has made a very interesting and to me novel argument on this subject. I will try to spell it out clearly and comprehensively.
The argument starts by saying that the key variable in global temperatures is the total amount of carbon in available form. It is held in the atmosphere as CO2 plus biomass plus dissolved in the ocean.
I have to admit, this argument is new to me. I had never previously encountered the position that the key parameter was the amount of available carbon as defined above. So its interesting and worth considering further.
It would go on, before 1900 there were temperature cycles, not caused or materially impacted by atmospheric CO2 levels. During these cycles, atmospheric CO2 levels fluctuated. These rises and falls were caused by changing temperatures. Warming caused rises, cooling caused falls.
The fact that the total of free carbon was fixed meant that the temperature cycles happened around a certain mean. This set a limit both to the rises and falls.
Here we have a basic logical difficulty. There is no obvious reason why the total of free carbon as defined above should have any bearing on temperature, even if it allows a higher mean and higher extreme values for atmospheric CO2.
Free carbon is supposed to drive max temps by influencing the amount of atmospheric CO2 during the cyclical movements from biomass to ocean to atmosphere.. But under the hypothesis, atmospheric CO2 level has never had any material effect in the past. So why should it now?
According to the argument, in the past CO2 levels have risen and fallen without causing any significant variation in temperature. So the argument needs to explain why the current rise will have effects that by its own hypothesis previous rises did not. It may be that as a result of our emissions the fluctuations in CO2 will be about a higher mean than in the year AD 1000 or earlier. But the argument has got to show that this has any bearing on temperature.
It will find this very difficult or impossible to do while at the same time denying that previous levels of CO2 were material causes of temperature levels. Its a self contradictory argument.
On the other hand, take the other fork of the dilemma, and you end up arguing that a small warming caused a release of CO2, thus a rise in atmospheric levels, and that this caused subsequent warming. But you then have to account for the temperature fall and the subsequent fall in CO2 levels, and you have to find some reason why this same sequence of cooling and fall will not happen even at the higher atmospheric levels due to human emissions.
Its all logically incoherent.
You said “On the other hand, take the other fork of the dilemma, and you end up arguing that a small warming caused a release of CO2, thus a rise in atmospheric levels, and that this caused subsequent warming. But you then have to account for the temperature fall and the subsequent fall in CO2 levels, and you have to find some reason why this same sequence of cooling and fall will not happen even at the higher atmospheric levels due to human emissions.
Its all logically incoherent.”
Bingo.
Note in the ice core record between -106 and -100 Kyr the temp rises 4 degC while CO2 just plateaus during the same period. On the downswings there is only evidence that CO2 lags T. On the upswings its more difficult and arguable because the lag is difficult to identify. But then comes the beauty of the authors argument – comparing the width at half height of the peaks is independent of lag and as the temp width is half the CO2 width it is not possible to argue CO2 controls T.
“It will find this very difficult or impossible to do while at the same time denying that previous levels of CO2 were material causes of temperature levels. Its a self contradictory argument.”
I said a few times that previous changes in CO2 induced a modest temperature change, and that this amounted to a small positive feedback. Richet said that too. The reason it is small is that the sensitivity of dissolved CO2 to T is fairly small – about 10 ppm per °C. At an ECS of 3°C/doubling, that means a fall of 1°C from 280 ppm would drop CO2 by 10ppm, which makes a further drop in T of 10*3/280 = about 0.1°C. ie feedback factor of about 0.11. For simplicity I mostly ignored this.
I was having another look at these and was interested in the following features:
1) The single spikes that occurred at the peak of the interglacial
2) Following the spike the cooling trend suggesting a change in state of the climate system expressed in a way that is not seen on these graphs
2) The lack of such a spike in the present interglacial which is unusual – instead we have a “hiccup” at the start of the interglacial. Was this our spike?
3) The post spike “pause” – which we went straight into, but 230kyr ago, this pause is not shown in temperature but is shown in the CO2.
4) And just for fun the average interglacial of 7,15,16 is 12.7 and we’ve already had 13. So can anyone tell me the probability of the interglacial ending in say the next 100 years (based purely on those).
“The claim repeatedly heard that science has settled, for good, the climate problem particularly reminds the observer of two famous debates. Regarding continent motion, the greatly influential mathematician and theoretical geophysicist Jeffreys (1929) was right when he claimed that, in a rigid Earth, “secular drift of continents relative to the rest of the crust, such as have been maintained by Wegener and others, are out of the question.” But he was nonetheless quite wrong because he did not envision convection in a highly viscous mantle, which was proposed at the same time as a viable mechanism by Holmes (1928).”
There is no proof the Earth has been the same circumference since it first became a planet with a rock crust, a molten mantel and a magnetic core. That scientists have made claims that the “Earth Day” has increased from some 7 hours to over 24 hours as point A returns to point A in relation to our Sun, is the first clue that the Earth was much smaller in diameter when the “Snowball Earth” occurred. The first rock crust created a thicker crust that was covered on water after the ammonia and methane created an atmosphere of hydrogen and oxygen and atmospheric water was more dense as the Earth was smaller. Massive volcanic activities occurred causing this crust to split open and as water poured in to cool the molten rifts created our first seas, those being thinner crusts under the water continued to split and separate what became the continents that are much thicker and the Earth grew larger with each occurrence…as the “Earth Day’ became longer to go from point A to point A again. The Atmosphere also grew as more gases were created by the volcanic activities and the formation of marine life that led to the high Carbon Dioxide and later to the Oxygenation Event. All Carbon Based Life Forms increased during the Hothouse Periods adding more Carbon Dioxide and Oxygen that when the anomalies’ of Glaciations at the colder Poles and higher mountains – as mass extinction’s are found to correlate to these Glaciations – sequestered the Carbon Dioxide that is released when the next Hothouse came and causes the spikes seen in these core samples. That marine life fossils are found high in mountains shows how the water levels drop whenever these splits in the ocean floors have occurred. As the Earth Expanded it occurred at different locations and the largest growth was in the Pacific and Indian Oceans. The Continents do not “Drift” they are moved around as the shifts in the oceans grow.
When the arguments on Tectonics took place, there was no way to map the ocean floors and it was ignored. But for decades this mapping has proven that these splits have occurred by dating the rock formations that have the oldest near the continents and the youngest near the major trenches that exist in every ocean and sea. But it seems that is being ignored by the old school geologists to this day.
I scanned this paper and I generally like it – a good summary of decades-old “climate skeptic” views.
In addition to the ice core record, there is also considerable supporting evidence in the modern data record that CO2 changes lag temperature changes, such that this relationship holds at all measured time scales (MacRae 2008).
Each delay of CO2-change after temperature-change has its own period, which reflects the causative physics and math.
There is a high probability that the cause of increased atmospheric CO2 is primarily natural,
not human-made; not primarily caused by fossil fuel combustion. CO2 changes lag
temperature changes at all measured time scales, from the ice core record to the modern data record. See Kuo (1990), Keeling (1995), MacRae (2008), Humlum (2013) and Dr Ed Berry’s latest paper and book (2020 and 2021).
I’ve heard all the counter-arguments, and they don’t work – I am completely “done” with the ~50 years of warmist BS.
Repeating:
“CO2 changes lag temperature changes at all measured time scales, from the ice core record to the modern data record.”
“Increasing atmospheric CO2 does NOT drive climate – the future cannot cause the past.”