Guest Post by Willis Eschenbach (@WEschenbach on X, and my blog is here.)
You might have read about RCP8.5, which is now called SSP5-8.5. It is the most extreme future scenario proposed by the IPCC. You might also have read that it is being thrown in the trash can.
Finally, you may have seen claims from the usual suspects that the death of SSP5-8.5 is because we’ve been so gosh-darned successful in reducing CO2 emissions. Gavin Schmidt’s RealClimate blog (where I’ve been banned for a couple of decades now) mentions the effects of “the Montreal Protocol, the Clean Air Acts, renewable energy price falls, fracking, the Paris Agreement, actual climate policies”.

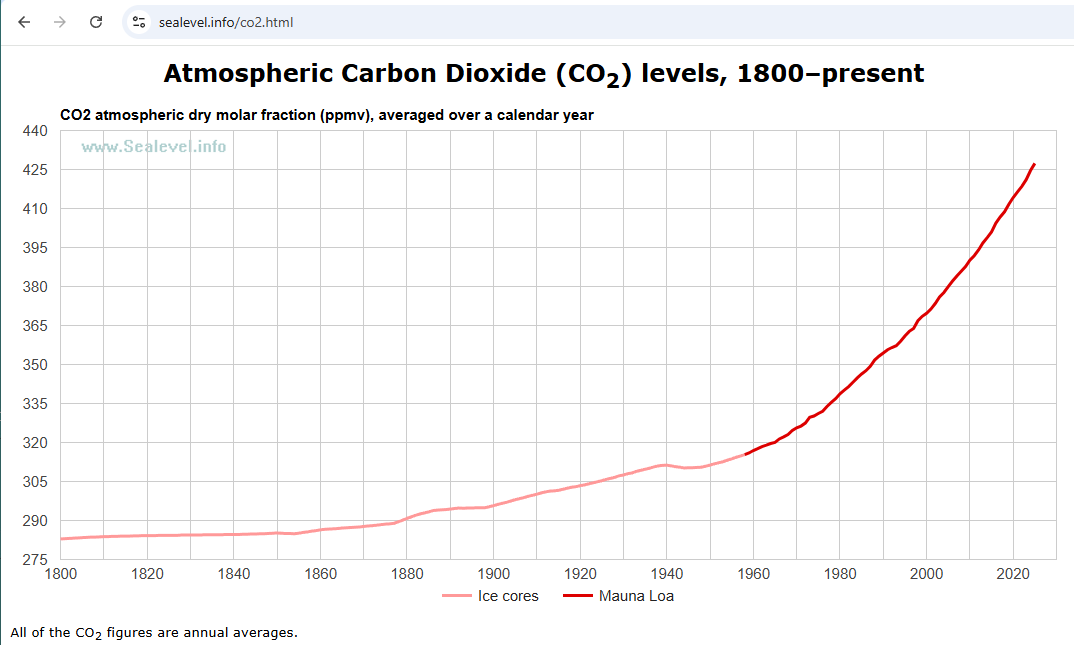
Figure 1. The inexorable rise of atmospheric CO2. If emissions were dropping as the usual suspects claim, the rise would be slowing.
But some imagined drop in emissions is not the reason that SSP5-8.5 was killed. That hasn’t happened. Here’s a detailed look at the changes in the trajectory of the atmospheric CO2.

Figure 2. Actual atmospheric CO2 concentration, and the calculated acceleration of the concentration.
There’s been no change in the progression of atmospheric CO2. SSP5-85 died because it was alarmist nonsense from Day One, and the IPCC is finally admitting that obvious fact.
SSP5-8.5 is an economic fairy tale commissioned around 2011 for the IPCC, stitched together by a crew of modelers told to imagine how to drive CO₂ emissions into the stratosphere by 2100. The task was not “what’s likely?”, but “what would it take to get the highest plausible emissions you can mathematically torture out of the system?”
To get there, they had to run history backwards. Instead of continuing the observed move away from coal toward oil, gas, and non-fossil energy, they assumed a huge global lurch back to coal, with coal use multiplying several-fold so that by the end of the century, roughly half of all energy on Earth comes from coal alone. Not just for electricity either—coal-to-liquids for cars and planes, as though the world looked at cheaper, cleaner competition and said: “No thanks, bring me more soot.”
Even that wasn’t enough. So population growth, which in the real world has been slowing, gets dialed up to around 11–12 billion people by 2100, right out near the high end of speculative projections.
That still wasn’t enough. So technological progress in energy efficiency, which has been marching along for decades, is assumed to more or less stall, so we keep wasting energy like there’s no tomorrow.
And on top of that, the scenario simply supposes that meaningful climate policy never really bites anywhere that matters—no sustained global effort to bend the emissions curve for the rest of the century.
String all of that together, and you get SSP5-85: a “fossil-fueled development” storyline where coal dominates, population balloons, innovation sputters, and policy sleeps.
It may or may not have been useful as a stress test of the climate system under extreme forcing. But as a picture of where the real world is actually headed, it depended on a long list of things all going wrong, all at once, for a very long time—which is precisely why the common practice of treating it as “business as usual” was alarmist storytelling, not science.
And telling these stories has caused real damage. SSP5-8.5 has been the backbone for all the exaggerated claims of sea level rise, extreme weather, and upcoming Thermageddon™. It has been put forward as the main argument for the insane “Net Zero” policies bankrupting the nations foolish enough to sign on to them. It has caused no end of trouble.
So don’t believe the merchants of doom and the serial failed doomcasters. SSP5-8.5 was garbage from the start, and that’s why it was thrown out. Nothing to do with fancied changes in emissions, and everything to do with the fact that it was designed as a propaganda tool.
However, don’t think we can rest on our laurels. The usual suspects will just latch onto the next most alarmist scenario, SSP3-7.0, which is only slightly better … you see, the problem is that the mainstream climate scientists are caught in the Sinclair Trap, viz:
“It is difficult to get a man to understand something when his salary depends upon his not understanding it.”
My best to all on a foggy night here in the forest on a hill,
w.
Oh, yeah: When you comment, please do everyone a favor and QUOTE THE EXACT WORDS YOU ARE DISCUSSING. I can defend my own words. I can’t defend your restatement of my ideas.
Two quotes:
“Gavin Schmidt’s RealClimate blog (where I’ve been banned for a couple of decades now)…”
and
“It is difficult to get a man to understand something when his salary depends upon his not understanding it.”
__________________________________________________________________________________________________
Both tell the same story of what’s going on.
Willis should regard it as a badge of honour to be banned from Real Climate.
In the UK they haven’t got the memo, it’s… Business as usual. It’s how you spin it
RCP 8.5: Why did the climate change model get it wrong?
Whether we like it or not, global warming is happening. The global temperature has already gone up, and it’s going to go up more, because the atmosphere is already full of carbon dioxide and other greenhouse gases, and we’re continuing to add to that stock. – BBC
https://www.bbc.co.uk/sounds/play/w3ct6vzy
While we have a Labour government any old insanity goes.
Wisful thinking quote:
“The global temperature has already gone up… and since this is the UK we’re creating a new summertime holiday for Londoners to get outside in shortsleeve t-shirts. The health department will be sending out market coupons for sunscreen.”
So, TWO weeks near the end of July instead of just one? 😉
last night was the warmest May night on record, beating the previous record set in 1947. The former is London and the latter is Folkestone on the Kent coast. (See attached image).
Now I there is a correlation as 1947 is 89 years ago, which by my reckoning is just over exactly 4 Hale cycles or 8 Schwabe cycles, but is there a causal link?
I have looked at a list of solar cycles, and the maximum of Solar Cycle 18 coincidently occurred in May 1947. Of course one data point proves nothing significant other than being a curiosity.
1947 is 89 years ago in just 10 years
This noon at Heathrow Airport the May daytime record from 1944 was broken by 0.1.
We are all dooooomed.
Be more interesting to find a temperature from a class 1 site instead of an airport which has lots of tarmac and concrete and hot jet engine exhausts.
“The UK has recorded its all-time highest May temperature as part of London reached 34.8C on Monday.
That provisional figure, recorded in Kew Gardens, also surpassed the hottest bank holiday Monday on record – 33.3C on the August bank holiday in 2019.
Wales has also experienced its hottest May day, reaching 32.2C at Hawarden Airport in Flintshire.”
https://www.bbc.co.uk/news/articles/c8xwwpkrgj1o
John, when considering causes for observed changes in climate or weather, it is best to look at actual data and the way it is measured.
1) Changes in the instruments used for temperature measurement between 1947 and 2026 are a more than adequate explanation for the Kew Gardens results.
2) Global cloud cover has declined from about 64% to 61% in recent decades letting in more sunshine. That results in an increase in admitted sunshine of about 4.5% during this time. That too is enough to account for the differences.
3) Total column water vapor has actually declined in recent decades, contrary to CO2 theory that insists it should increase. This change should have caused the Kew Gardens measurement to decrease!
And then there are observations 4, 5, 6 and on and on such as changes in the overall Earth albedo from whatever cause, variations in cloud-forming cosmic rays, changes in solar cycles affecting solar output, changes in planetary alignments which alter the physical shape of the sun and thus its power output and so on which others more knowledgeable than I can add to the confusing list.
‘Tis a real puzzlement.
“the atmosphere is already full of carbon dioxide and other greenhouse gases, and we’re continuing to add to that stock”
I wish they would make up their minds. If it is full, where is it going if we continue to add to that stock?
RCP8.5 scenario was unrealistic to begin with and should have never been included within the range. Scientists like to use it because it actually shows climate changes, whereas with most of the other scenarios the climate impact changes are so subtle they don’t make for an interesting publication.
Yes, and yet, “things that never happened” does not stop today’s “journalists” from filing their scribblings describing such “things that never happened”.
And their media outlets from religiously publishing them.
Two big numerical facts behind the withdrawal of 8.5, both noted qualitatively by WE.
It got withdrawn by IPCC simply because it had become an increasingly well recognized ‘implausible’ embarrassment—quite different than Gavin Schmidt’s laughable assertions.
“China is at roughly a total fertility rate (TFR) of about 1.0 children per woman, far below the replacement level of 2.1.” (WorldoMeter,2026)
The rest of the industrialized world is averaging between 0.75 (South Korea) and 1.6 (USA).
Global CO2 emissions will soon be the least of our problems.
China is not the most populous country on Earth any more.
What’s the fertility and birth rates in India? And Indonesia, Brazil and Indonesia while you’re at it.
In India, the birth rate has fallen to 2.0 children per woman, which means that the population will stop growing.
The birth rate in Indonesia has fallen to 2.1 and Brazil’s is down to 1.5. Virtually all of the countries with high birth rates are in sub-Saharan Africa and the birth rates there are also falling rapidly now.
Israel is one of the few, maybe the only, above replacement rate.
World fertility depending on the source is between 2.2 and 2.4 and continuing to fall.
With world population currently at 8.3 billion, it’s not certain that the world population will make it to 9 billion before it starts to fall.
So much for the claims that the population will break 12 billion by 2100.
The replacement rate is much higher than 2.1 in the areas that still have high-but-falling birth rates, given their higher infant and child mortality rates, so UN estimates of an increasing world population for 30+ years is very optimistic.
On top of the impossible coal burning in the near future sits also a very questionable feedback parameter, the multiplying of current fossil fuel consumption alone was not enough to produce this 8.5W/m2 forcing.
What is there to celebrate when the same false framing is in place, ie, man-made emissions are exclusively driving the Keeling curve and climate change.
The latter proposition is easy to actually show observationally, via the relative atmospheric decline in the C13/C12 CO2 ratio. Fossil fuel photosynthesis was preferentially C12 (lighter), so fossil fuel sequestration drove up the atmospheric C13 ratio. Burning those sequestered fuels brings it down.
The former proposition is very difficult—if not impossible—to show observationally ever since UNFCCC ‘concerns’ first became official in 1992.
easy to actually show
Can you force Ed Miliband to see? If only you could.
Rud, the isotope ratio argument isn’t enough to compete with a mass balance analysis*.
There simply isn’t enough man-made CO2 after sinking to account for the whole CO2 rise.
Because CO2 is a well-mixed gas, every year’s man-made emissions sink at the same rate as all CO2 sources sink, around 80% of the annual Keeling curve rising phase, ball-park.
Annually, all CO2 sources combine into the Keeling curve rising phase (red curve, second panel), which is always much greater than the gross annual man-made emissions (black).
The net annual man-made emissions after sinking (orange = black*sink rate) is always much less than the net annual CO2 flux (green = red – blue).
Since the annual rising phase and net CO2 correlate so well with SST, there is therefore a larger natural CO2 source every year larger than man-made emissions can supply that is connected to the ocean temperature via Henry’s Law. Everything else follows after that.
*This analysis is a few years old and doesn’t include relatively smaller land use changes.
Wouldn’t CO2 released by warming oceans also increase the lighter C12, especially if released from the deep ocean (more likely to be very old trapped CO2 when the ratio was different)? I’m not an expert or even a nerd of that aspect of science but it would be more prudent to look at all the mechanisms that could change that ratio, especially in light of the carbon cycle in which human emissions are a small fraction of the total.
Does the change in C isotope ratio really match that proportion?
The return time for deep ocean CO2 sequestered by polar winter sea ice formation exuding salt which makes polar seawater heavier so that it sinks creating the the thermohaline circulation is variously estimated at 800-1200 years (depends on where). So not possible for that to change the C13/12 ratio, which was altered slowly over several hundred million years by fossil fuel sequestration (Oil/gas ~450 mya to present, coal mostly 350-300 mya thanks to evolution of white fungus). Of course, this assumes that the original C13/C12 Earth ratio was formed when the planet first formed. A reasonable assumption, since both are known stable carbon isotopes unlike C14.
The only natural mechanism known to change the atmospheric isotope ratio is photosynthesis—iff followed by sequestration. That is why the isotope ratio science is so robust, and also easily measured to great precision by mass spec.
Also, the rate of over turning is fairly constant. So the same C13/C12 ratio was being released 1000 years ago as is being release now. The only thing that can change that ratio would be the ratio in the atmosphere at the time the water was sequestered.
No, it doesn’t. The net 13C/12C ratio (expressed as d13C, which is what is actually measured) of the incremental atmospheric CO2 is, on average, -13 per mil whereas it would more like -28 per mil if it was solely due to anthropogenic fossil fuel burning. Big difference. Of course it is possible to imagine various other influences that might explain the huge discrepancy on a short timescale. However, the problem is that it is the same at all observatories that have been checked by myself and reported by others over the whole period of direct measurements and even going back to the mid 1700s based on the ice core data. I don’t have access to my graphs today but could provide more details later tomorrow.
I believe you are thinking of C14.
I would think a 6000 year coal seam fire would be indistinguishable from human activities.
True, and not anthropogenic. But how many coal seam fires are there compared to coal mined then fired for electricity and steel? Not many.
CO2 from coal seam fires is isotopically indistinguishable from CO2 from anthropogenic combustion of coal, but it’s only a few percent of the coal combusted.
Has there been much of an increase in coal seem fires over the last 100 years or so?
A coal seem fire that has been burning for 6000 years is unlikely to be responsible for a CO2 increase over the last 100 years?
Bob Weber, “climate” is more than just temperature, and CO2 is not the only thing which affects it.
But, w/r/t CO2, human emissions are the only reason that the atmospheric CO2 level is rising. Here are the numbers:
Our fossil CO2 emissions are about 4.9 ppmv/year (= 38.6 Gt of CO2/year = 10.53 PgC/year). But the CO2 level is not rising by 4.9 ppmv/year, it is only rising by an average of about 2.5 ppmv/year.
That means “nature” (≡ “the net sum of all non-anthropogenic CO2 fluxes to and from the atmosphere”) is removing CO2 from the atmosphere, at an average annual rate of about 2.4 ppmv/year (plus whatever you think “land use change emissions” might be).
tl;dr:
● Humans are adding CO2 to the atmosphere.
● Nature is removing CO2 from the atmosphere.
● The CO2 level in the atmosphere is rising solely because humans are adding CO2 faster than nature is removing it.
Footnote on units:
Several different units are commonly used to specify the amount of CO2 in the atmosphere. Here are the conversion factors:
1 PgC (≡GtC) = 3.6642 ±0.0003 Gt CO2 = 0.46962 ±0.00007 ppmv CO2.
1 ppmv CO2 = 7.8024 ±0.0005 Gt CO2 = 2.1294 ±0.0003 PgC
where “ppmv” or “ppm” is shorthand for “µmol/mol of dry atmosphere.”
So, for example: 427 ppmv = 3332 Gt CO2, which is 909 GtC.
You obviously did not follow what I said and showed, which is right from the data.
“plus whatever you think “land use change emissions” might be”
It’s not going to be ‘whatever I think it should be’ Dave, it’s going to be from OWID.
CO2 is not rising solely because of man-made emissions, it is rising more from natural CO2 connected to the ocean temperature as explained by the high correlations with SST.
I’m sure you have no answer as to why the rising phase and net CO2 correlates with SST at all, especially since you are so convinced the entire rise was solely from man-made sources. Why do they correlate at all?
Why is the annual net CO2 flux (green line) so much greater than the man-made emissions after sinking (orange line)?
If man-made emissions were the sole source of the net CO2 flux rise there would be no gap between those two lines and no good SST correlations.
Bob, the oceans are not outgassing CO2 as rapidly as they are absorbing it. Being net absorbers of CO2, they cannot be causing any part of the ongoing increase of CO2 in the atmosphere.
We know that, “uptake of atmospheric CO2 should react not to a change in emissions, but to a change in concentrations” (Knorr 2009). So if our current emissions of 4.9 ±0.5 ppmv/yr of fossil CO2 were to suddenly cease, the CO2 trend would be reduced by that same amount: 4.9 ±0.5 ppmv/yr. That means it would be negative instead of positive: initially averaging about –2.4 ±0.6 ppmv/year instead of the current average of +2.5 ±0.1 ppmv/year.
In other words, were it not for ongoing anthropogenic CO2 emissions the atmospheric CO2 concentration would currently be falling, rather than rising.
You are probably confused by the difference between “residence time” and “adjustment time.” The residence time is much shorter than the adjustment time, because of processes which temporarily removal CO2 from the air and then return it, and processes which exchange CO2 in the air with CO2 from other carbon reservoirs. Note that exchanges of CO2 between carbon reservoirs (such as the oceans) dilute the fossil carbon isotope fingerprint, without changing the amount of CO2 in the atmosphere. The various “CO2 lifetimes” are explained in detail here.
Nobody really knows how large “land-use change emissions” are. They aren’t measurable, so they are estimated from models, and they are very poorly constrained. Here are plots of three model-derived estimates of land-use change emissions; this graph is from (Dohner, 2022). As you can see, the estimates are all over the place:
But the uncertainty of land-use change emissions does not matter for our purposes, because fossil CO2 emissions, by themselves, already greatly exceed the rate of atmospheric CO2 increase. That means nature is removing CO2, not adding it.
If land-use change emissions are large, that just increases the calculated rate of natural CO2 removals.
So regardless of how large or small “land-use change emissions” are, the ongoing increase in the amount of CO2 in the atmosphere is solely because humans are adding CO2 faster than nature is removing it.
There is no correlation between CO2 levels and sea surface temperatures, other than short duration fluctuations from things like ENSO.
Atmospheric CO2 levels have risen steadily since 1958, when precise measurements began.
CO2 levels rose while temperatures rose, and they rose while temperatures fell. Obviously rising temperatures couldn’t have caused CO2 levels to rise at a sharply accelerating rate while temperatures were falling.
Note the sharply accelerating rise in atmospheric CO2 concentration over the thirty year period following WWII, even though global temperatures were generally falling:
(Aside: Subsequent revisions to most temperature indexes have reduced, but not completely eliminated, the post-WWII cooling trend which NCAR showed in 1975.)
I trust that you’re aware of the fact that our current warm climate is not unprecedented. The Earth’s climate was clearly much warmer than now during the Eemian Optimum:
It was also probably significantly warmer than now during the mid-Holocene climate optimum, and probably at least as warm as now during Roman and Medieval Warm Periods. Yet we know from ice core data that during those previous warm periods the CO2 level never topped 300 ppmv, and now it’s at about 427 ppmv.
Over the last 68 years (i.e., since precise measurements began, in 1958), the CO2 level has risen by about 112 ppmv. If you don’t think our (even larger!) additions of CO2 to the atmosphere caused that rise, then to what do you attribute it?
Here are Law Dome (Antarctic) high resolution ice core data, back to year 1010. If you scroll down to “CO2, 75 Year Smoothed,” then keep scrolling, you can watch CO2 levels climb over 160 years from 279.5 ppmv to their peak of 284.1 ppmv circa 1170 (at the peak of the MWP). In most browsers this text fragment link will take you directly to that line.
That’s a rate of change of about (284.1-279.5)/(1170-1010) = +0.03 ppmv/year, presumably driven by temperature change.
Then watch CO2 levels fall to their lowest level of 275.3 ppmv circa 1615 (in the depths of the LIA).
That’s a rate of change of about (284.1-275.3)/(1615-1170) = -0.02 ppmv/year, presumably driven by temperature change.
The current rate of CO2 level increase is averaging 2.5 ppmv/year. There is nothing remotely comparable to that rate of change recorded in the ice cores.
“You are probably confused by the difference between “residence time” and “adjustment time.””
Those are unnecessary and useless constructs that YOU are confused by. It seems the less you know the more you say.
If you realized every year about 80% of the new CO2 added to the Keeling curve is sunk, including the man-made portion, and you treated every year that way, you would already know there isn’t a need to invoke ‘residence time’ or ‘adjustment time’.
You apparently have no relevant answers to my points.
AGAIN you did not address either what I exactly said or showed.
Bob, if I thought that “every year about 80% of the new CO2 added to the Keeling curve is sunk.” then I’d be quite confused, because it’s not true. If 80% of the CO2 added to the atmosphere were gone one year later that would imply a half-life of just 0.43 years, and an e-folding lifetime of 1/ln(2) times that or 0.62 years.
But you don’t have to understand that math to understand this simple proof that human CO2 emissions are the sole reason for the ongoing rise in atmospheric CO2 level:
● Our current fossil CO2 emissions are adding about 4.9 ppmv of CO2 to the atmosphere each year. (That’s calculated from fossil fuel production data.)
● The amount of CO2 in the atmosphere is only increasing by about 2.5 ppmv per year. (That’s measured at MLO, SPO, CGO, etc.)
∴ The net effect of “nature” (all non-anthropogenic factors) is to reduce the amount of CO2 in the atmosphere, not increase it.
I.e., were it not for ongoing anthropogenic CO2 emissions the atmospheric CO2 concentration would currently be falling, rather than rising.
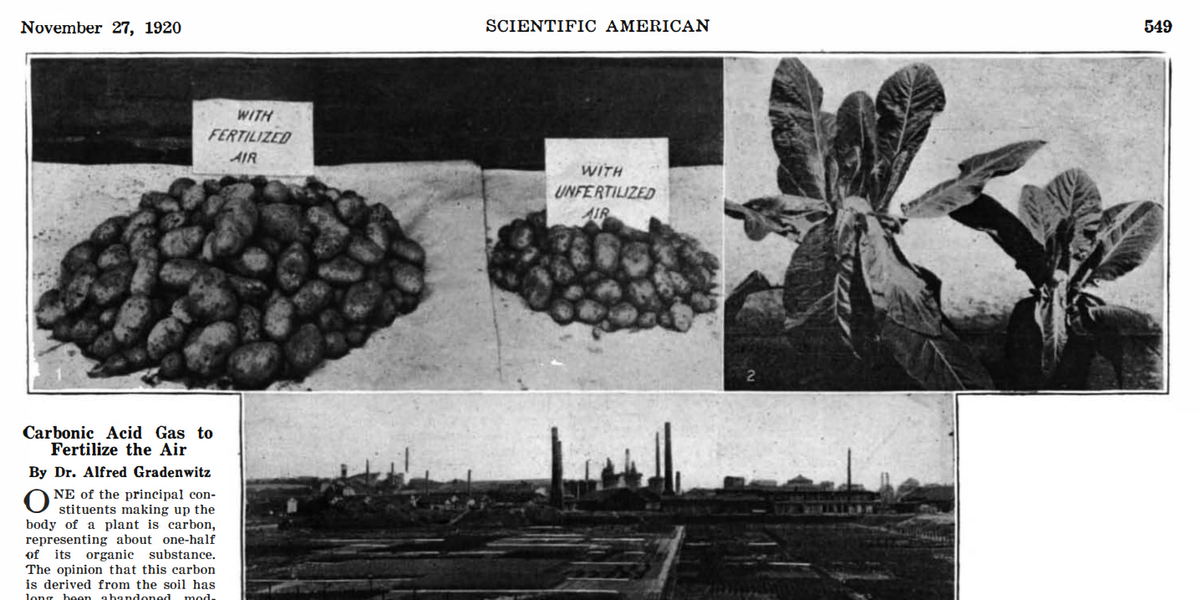
CO2 is plant food.
True—a fact which has been settled science among agronomists for over a century.
Reference:
Gradenwitz A. (1920). “Carbonic Acid Gas to Fertilize the Air.” Scientific American, Nov 27, 1920, Vol. 123 No. 22, p. 549. doi:10.1038/scientificamerican11271920-549
Man’s emissions are sufficient to supply 2 to 4 times more of an increase than has actually been seen.
If it hadn’t been for the growth of various natural sinks, such as increased vegetation, there would have been even more of an increase.
Can you document any natural sources of CO2 that have increased by enough to have caused the increase?
Before you say warming oceans, according to the proxy records changes in CO2 levels trail changes in temperature by 900 to 1000 years. It’s only been around 250 years since the bottom of the little ice age.
DING DONG A WICKED WITCH IS DEAD!
Read the obituary, it is obvious that “climate change” was always a grift looking for a gullible audience. “story tip”
https://www.nytimes.com/2026/05/24/science/rafe-pomerance-dead.html?utm_source=firefox-newtab-en-us
This article is paywalled.
SSP3-7.0 was also retired by IPCC for CMIP7.
That is bigger news for me. I’d gotten to a point where I could ‘ctrl-f’ the text ‘8.5’ on doom papers without a second thought. I assumed I would (in a few years) find no new 8.5s and would look for the ‘next worst’ scenario. Getting rid of both the 8.5 AND the 7.0 leaves doom hunters nowhere to go. How will they generate doom?
Boiling turtles by the year 2400? surely the turtles will have flying (electric?) cars by then.
Bob:
Yes. Roger Pielke, Jr. reviewed this on his May 13 & 18th substack blog The Honest Broker.
Thank you for pointing that out, Bob. I see that Roger Pielke Jr wrote about it here:
https://rogerpielkejr.substack.com/p/how-climate-science-lost-its-way
As others have noted Roger Pielke Jr’s “Honest Broker” website has a very good set of articles, going back several years now, denouncing RCP 8.5 and its use by both “activist scientists” and the (more-or-less hysterical) “mainstream / legacy” media.
In a recent (end-April) one reporting on the “RCP8.5 is Officially Dead” announcement he included the table attached below (which made me go “Now that’s an interesting summary image … definitely worth copying to my local hard disk …”).
.
From the ATL article : “The usual suspects will just latch onto the next most alarmist scenario, SSP3-7.0 …”
One of the rare instances of Willis getting something wrong (it’s called “being human”).
My understanding is that the Van Vuuren (et al) team declared SSP5-8.5 and SSP3-7.0 and SSP1-1.9 (!) to be “implausible”.
The “HIGH” scenario that the IPCC and the media will soon “just latch onto” is SSPn-6.7.
6.7 W/m² of (additional anthropogenic) radiative forcing in 2100 instead of 7.0. Yuuuuuuuge difference to the climate model outputs …
Per the headline chart – how the heck can anyone guess CO2 concentration in 2100 (74 years from now)?
2026 – 74 = 1952 … the US Korean War and Eisenhower winning presidency
(Queen Elizabeth 2 coronation in England I think)
In 1952 I think they’d be charting moon bases or missile counts. Here in the future I think I’d be laughing if I saw the charts.
When I read older sci fi I’m always struck by what the authors did not expect. The biggest ‘how could they have known’ flag is people doing work that would be automated. Human on a space ship using pencil and paper to chart a space travel itinerary? Someone ‘smart’ assumed a space navigation engineer would be doing it. The author had no computer, no cell phone, no air conditioner and drove a passenger car made in USA that got 10 mpg leaded. Laughing? Then why put any trust in how a chart of something depending on market preference looks in 100 years.
I haven’t searched the statistical journals but had a decent basic training, more importantly worked with reliable statisticians for decades up until 2010. Is this sample of a small list on chronological order in modern parlance evidence of a cascade which has reached a ‘tipping point,’ 8.5 going negative? As mostly a field marine biologist I saw and agree strongly with Smith (insistence on statistical approaches like p values to field work may have affected more understanding of important but differently organized processes than recognized) One doesn’t have to know physics or climate science to know bad statistics, like this paraphrase I’ve often seen (factor X statistically explains about 64 % for conclusion Y) Are IPCC stats similar?
Box, G. E. 1976. Science and Statistics. J. Amer. Stat. Assoc.71(356):791-799.
Stommel, H.1987. A View of the Sea: A discussion between a chief engineer and an oceanographer about the machinery of the ocean circulation. Princeton Univ. Press. 165 pp. (models obscure analysis)
Lierman, M. and R. Hilborn.1997. Depensation in fish stocks: A hierarchic Bayesian meta-analysis. Can. J. Fish. Aquat. Sci. 54:1976-1984. (difference between biological (organisms) and statistical (numbers) significance)
Germano, J. D. 2001. Reflections on statistics, ecology, and risk assessment. pp. 33-42, In, J. Y Aller, S. A. Woodin and R. C. Aller (Eds.). Organism-Sediment Interactions. Univ. South Carolina Press. (abandoning statistical significance and using the methods of decision theory, clinical psychology and medical epidemiology)
Oberkampf, W. L., T. G. Trucano and C. Hirsch. 2003. Verification, validation, and predictive capability in computational engineering and physics. Sand Rept. Sand 2003-3769S. Sandia National Laboratories. 92 pp.
Beninger, P. G., I. Boldina and S. Katsanevakis. 2012. Strengthening statistical usage in marine ecology. J. Exp. Mar. Biol. Ecol. 426-427. 97-108.
Strimbu, B. 2012 . (Abs.). Challenges in environmental modeling. Louisiana Scientist. 2(1):7 (three common regression errors in environmental modeling)
Boldina, I. and P. G. Beninger. 2016. Strengthening statistical usage in marine ecology: Linear regression. J. Exp. Mar. Biol. Ecol. 474:81-91.
Smith, E. P. 2020. Ending reliance on statistical significance will improve environmental inference and communication. Estuaries Coasts 43, 1–6.
Solow, D. 2023. In models we trust-But first validate. American Scientist. 111(1)
Thank you Willis. This cannot be repeated enough.
ln a rational world it would be enough to look at the CO2 emissions data, the Keeling Curve, and the IPCC weather related trends conclusions in AR 6 to conclude that the trillions of $ spent on wind, solar, batteries and EV’s have been a complete failure. The appropriate reaction is to JUST STOP. 4 decades of ever increasing massive spending, impositions of thousands of new laws and regulations and unending hysterical propagandizing have done nothing to reverse gradual increase in CO2 trace gas concentration, the rate of warming or show any positive effect on climate or weather beyond normal variability.
It is time to admit failure, cut losses and turn our attention to real problems that we know how to actually solve.
What is “wrong” with dramatically increasing carbon combustion?
The 8.5W/m^2 by increasing CO2 is the WRONG part. That relies on the unscientific nonsense that the CO2 causes a radiation imbalance – total garbage.
After discarding 94.5% of the available AIRS data, Rentsch was able to observe the CO2 absorption in the atmosphere:
RADIATIVE FORCING BY CO2 OBSERVED AT TOP OF ATMOSPHERE FROM 2002-2019
Then there is the leap of faith that being able to measure the absorption means it can actually alter the radiation balance. No thought that the 94,5% of discarded data actually involved counterbalancing negative feedbacks, which every AI LLM now “knows” occurs – from MS Copilot:
Because once the ocean surface reaches about 30 °C, evaporation accelerates so violently that it cools the surface faster than the Sun can heat it, preventing further warming.
Copilot: The warmest parts of the ocean (the tropical “warm pool” in the western Pacific and Indian Ocean) top out at about:
Rentsch 2020 (preprint), analyzed AIRS satellite spectroscopy, and found that under nighttime, cloud-clear conditions, a 37 ppmv CO2 increase caused +0.358 ±0.067 W/m² radiative forcing increase at TOA, which is:
𝞪 = 3.79 ±0.71 (which is 2.62 ±0.49 W/m² per doubling)
That’s about 70% of Myhre 1998, and about 90% of van Wijngaarden & Happer‘s result.
See also:
https://sealevel.info/Radiative_Forcing_synopsis.html
And the science falls apart because it frequently references results derived from RCP8.5 so they’re all no longer scientifically valid.
That’s the new “settled science”.
It turns out 97% of scientists weren’t sufficiently cognisant of climate science and the assumptions behind it to understand what they were claiming (/s)
Since you have already done this review (I’m certain), could you tell us what the assumptions are for 7.0? Reasonable or ridiculous?
SSP3-7.0 is ridiculous. It posits a CO2 level of about 870 ppmv in 2100, and a rate of rise over the last decade of the century of +9 ppmv/year.
At a CO2 level of 870 ppmv, the net rate of natural CO2 removals would be (970-300) / (50±5) = 12.2 to 14.9 ppmv per year.
To achieve SSP3-7.0, by 2100 anthropogenic emissions would have to be 9 + (12.2 to 14.9) = 21.2 to 23.9 ppmv per year, an emissions acceleration of about +350% (i.e., ≈ 4.5× the current emission rate) over the next 75 years, which is impossible.
For comparison, over the last 75 years, the fossil CO2 emission rate increased by +130% (i.e., by a factor of 2.3×).
Correction:
The last sentence reads:
“For comparison, over the last 75 years, the fossil CO2 emission rate increased by +130% (i.e., by a factor of 2.3×).”
That should have been:
“For comparison, over the last 50 years, the fossil CO2 emission rate increased by +130% (i.e., by a factor of 2.3×).”
Sorry about that!
It was a WORST CASE scenario model, clearly described by the modellers as such.
Doing modelling is a legitimate tool of inquiry, constructing a model is an invention exploring “what if” and trying to narrow down the parameters thought to have cause/effect importance. Its fatal error was to include carbon dioxide as a driver rather than a consequence of changes in other variables.
The harm came from the USE that others made of the model, ignoring or ignorant as to its real meaning. These others are the bad actors.
I also remember when it came out that it was supposed to be worst case. Can you quote the text that says it’s worst case?
Very nice Willis. The thing that bothers me is that the people using RCP 8.5 and SSP 5-8.5 all know they were both trash and they have always known. Them acting like that gives the rest of us damn little reason to believe anything they say. We already know they are liars and cheats.
Much of the world is at risk of being conned by those with malicious intent. Even a single person, like Adolph was in the 1930s, can cause massive social disruption.
QUESTION: Have our “Authorities” created adequate mechanisms to detect and deal with future attempts at large scale disruptions? (If you answer ‘yes’, please name the Authority.)
….
One might regard the creation and use of RCP 8.5 as a customary type of assistance to the flexibility of theoretical climate modelling exercises. Polite or overly meek people might think that way.
OTOH, one might regard it as a planned step in a program using atmospheric CO2 to disrupt global economies by demonizing our best energy sources (nuclear and coal). It has been shown by now that a nation that cooperates with the program becomes less able to compete in trade and more vulnerable to warfare.
…..
Any pragmatist versed in history should be concerned that there is next to nobody with power telling people that there is a clear and present danger afoot. (President Trump excepted). The United Nations seems missing in action. What needs to be done?
….
IMHO, the creators and users of RCP 8.5 should be identified and subject to investigation to detect motivation. Prosecution should then be commenced for those displaying criminal intent.
Note: There should be a reclassification of actions that can be read as criminal intent. Presently, we are upset by the thought of a person crying ‘FIRE’ in a crowded theatre, while actions of criminal intent are around us – like demonizing ‘FIRE EXTINGUISHER’ (which CO2 is) in a world critically dependent on cheap and reliable energy, particularly as electricity.
…
You reaction to this proposal to investigate CO2 harm pushers is not helped by closing your eyes and minds. Thankyou for being open minded.
Geoff S
Isn’t that what they insisted of the deniers? History wont see the AGW advocates who refused to debate valid arguments, in a positive light. Reallocating public funding towards mitigation and growth would be better use of resources.
With all due respect, [we] need to look at this affair from a different perspective, namely [theirs*]:
Over the past 5+ decades, they HAVE SUCCEEDED in suppressing development in the ‘3rd World’, keeping 3/4+ of the world’s population in ‘Fuel Poverty’-destitution, perennially on the brink of disaster, and intend to keep on with that. (The rest is just for show.)
Contrary to your assertion that all those gains (mitigations) were somehow inevitable …
The only sure way that our Brothers & Sisters in Africa, South Asia, and so on, could escape deprivation was to embrace the same coal-fired steam-engine & electricity generation that brought the West (& the Rest) to the point of controlling our destiny, ultimately to build hydro-electric & nuclear power plants, and to mine the higher-quality petroleum products.
To ignore this (or worse to deny the cruel intent on the part of the triumphant Gavins of our world) is to miss entirely the point of the so-called ‘8.5 Scenarios’ — they were not, no NEVER, based on some ‘garbage’ fantasy, but rather on what it would have actually taken over these ~ 50±25 years to lift the impoverished masses (those like your friends in the Philippines) up to the state-of-affairs that we have come to see as our [unearned] Birthright. That’s just the arithmetic of the matter, realistically.
Begging you to reconsider, lest we fail to confront the depths-of-depravity of our common opponents, yours sincerely– RLW
Great article, Willis!
So far, mankind has managed to increase the atmospheric CO2 level by nearly 150 ppmv of CO2 over the last 250 years (since the start of the industrial revolution).
We’ve actually added nearly twice that much CO2, but nature (defined as the net sum of all non-anthropogenic carbon fluxes) has removed the difference.
Currently, we are emitting about 5 ppmv/year, and the level is rising at a rate of about 2.5 ppmv/year.
https://sealevel.info/co2.html
The net rate of natural CO2 removals is a roughly linear function of the atmospheric CO2 level, accelerating by about (+1 ppmv/year) for every 50 to 60 ppmv increase in atmospheric CO2 level. The net removal rate per year is about the current level minus 300, divided by 50±5. So, for example, at the current 427 ppmv, the net natural removal rate is (427-300) / (50±5) = 2.3 to 2.8 ppmv/year. Which is right.
Aside: the IPCC used to admit that the rate of natural CO2 removals from the atmosphere accelerates by about 1 ppmv/year for each 50 ppmv rise in atmospheric CO2 level. The SAR WGI TS, B.1, p.16 put it like this: “Within 30 years about 40-60% of the CO2 currently released to the atmosphere is removed.”
That’s a major negative feedback, which limits CO2 level increases, and helps stabilize the Earth’s climate… and which is almost universally ignored by climate activists.
That implies a half-life of (30 / log₂(1 / remainingfraction)) = 23 to 41 years, and an adjustment time of 1/ln(2) times that, which is 33 to 59 years. In other words, for each 33–59 ppmv rise in CO2 level, the rate of natural CO2 removals accelerates by about another 1 ppmv/year. (More recent data suggests about 50–60 ppmv.)
Unfortunately, that very important and well-established fact has been omitted from more recent IPCC Assessment Reports.
SSP5-8.5 / RCP8.5 assumed that we would raise the CO2 level by another 700 ppmv (to about 1130 ppmv) over the next 75 years, an average rate of increase of 9.3 ppmv/year (compared to the current +2.5 ppmv/year). It also assumes that over the last decade of that period, the CO2 level will rise at a rate of about 13 ppmv per year.
So, if the CO2 level were 1130 ppmv (in year 2100), the net rate of natural CO2 removal would be (1130-300) / (50±5) = 15.1 to 18.4 ppmv.
To achieve RCP 8.5 “business as usual” by 2100, anthropogenic emissions would have to be 13 + (15.1 to 18.4) = 28.1 to 31.4 ppmv per year, an emissions acceleration of about +500% (i.e., ≈ 6× the current emission rate), which is obviously impossible.
For comparison, over the last 75 years, the fossil CO2 emission rate increased by +130% (i.e., by a factor of 2.3×).
SSP3-7.0 posits a CO2 level of about 870 ppmv in 2100, and a rate of rise over the last decade of the century of +9 ppmv/year.
So, if the CO2 level were 870 ppmv, the net rate of natural CO2 removals would be (970-300) / (50±5) = 12.2 to 14.9 ppmv.
To achieve SSP3-7.0, by 2100 anthropogenic emissions would have to be 9 + (12.2 to 14.9) = 21.2 to 23.9 ppmv per year, an emissions acceleration of about +300% (i.e., ≈ 4.5× the current emission rate, which is also obviously impossible.
typo correction:
should have been:
Another oops…
I wrote:
I should have written:
Sorry about that!
Good comment, data makes sense, I have one complaint – did Ice core data and Mauna Loa data really match exactly where the two plot lines meet?
I wonder what would have happened if the chart author had plotted the same ice core data (treated the same way) all the way to present?
I’m the “chart author,” and the answer is that the CO2 level from MLO and the CO2 level from ice cores really were extremely close in 1958 (the only year where both are plotted in that graph).
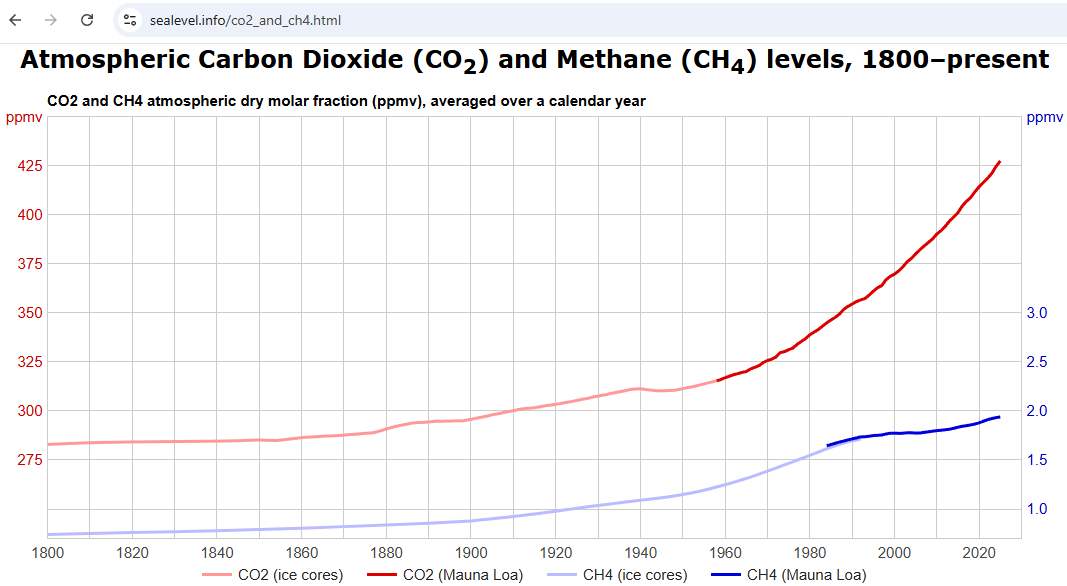
Interestingly, in relative terms, the CH4 (methane) levels from MLO and ice cores aren’t quite the same for their period of overlap.
You don’t really notice the difference when the CH4 graph is scaled to approximate the radiative forcing change relative to CO2’s:
https://sealevel.info/co2_and_ch4.html
But if you plot CH4 by itself (expanding the Y-axis), you can see the difference:
https://sealevel.info/ch4.html
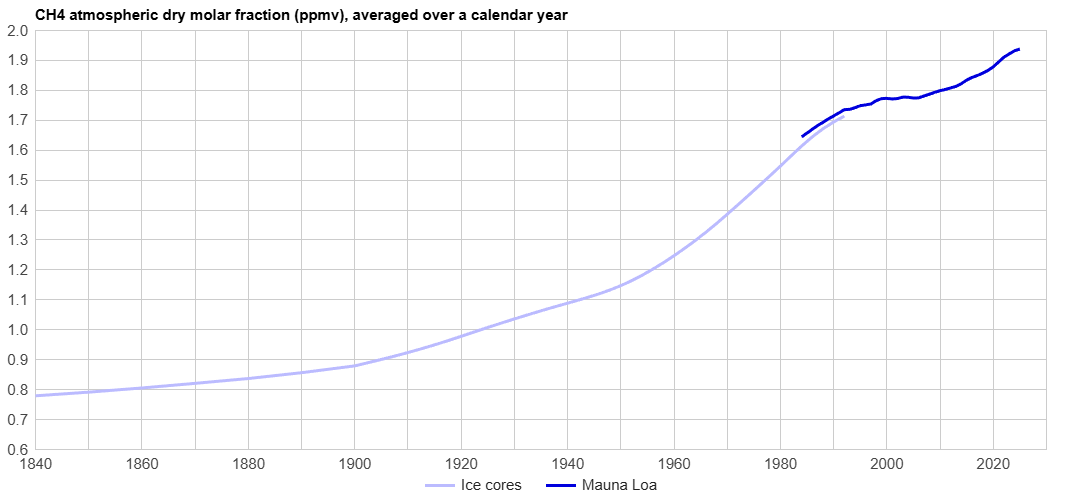
Methane levels in 1840 ? Could only be inferred from ice cores. Maybe we’re making wrong assumptions….maybe we should assume that 1/2 the gases in mid-1800’s ice cores have “leaked out” of the samples…..
Yes, if you click the link or the graph to enlarge it enough to read the legend at the bottom you’ll see that the light blue trace is labeled “ice cores.”
As snow piles up, it is compressed first into firn, and then into ice, which seals the air bubbles. The ice is not “leaky,” but the snow and firn are, indeed, leaky. That’s why the average age of the air in the ice is slightly less than the age of the surrounding ice itself.
One of the world’s top experts on that topic is Renee, who commented here yesterday.
Regarding the 1958 CO2 level, the TL;DR summary is that Mauna Loa (MLO) measurements and ice cores both showed the average 1958 CO2 level to have been about 315 ppmv:
GISS reports it as 315.34 ppmv. (That’s the figure I used.)Averaging the NOAA’s deseasonalized monthly MLO data for March-October 1958 yields 315.30 ppmv.The NOAA Law Dome “20-year smoothed” figure is 314.9 ppmv.Interpolating from the NOAA Law Dome “75-year smoothed” data yields 315.78 ppmv.
Details:
The 1959-2025 MLO CO2 levels in my graphs are from NOAA:
https://gml.noaa.gov/webdata/ccgg/trends/co2/co2_annmean_mlo.txt
The 1850-1958 ice core CO2 levels and the 1958 MLO CO2 level are both from GISS:
http://data.giss.nasa.gov/modelforce/ghgases/Fig1A.ext.txt
GISS gives the 1958 CO2 level as 315.34 ppmv, and describes the 1958 & later levels as “SIO Mauna Loa & South Pole Adjusted for Global Mean,” which isn’t strictly MLO. But the 1959 level which they report is nearly identical to NOAA’s 1959 MLO level (316.18 vs. 315.98) so I think that’s a distinction without a real difference. (“SIO” means Scripps Institution.)
NOAA also has MLO measured monthly CO2 levels for March through December of 1958, here:
https://gml.noaa.gov/webdata/ccgg/trends/co2/co2_mm_mlo.txt
Averaging their deseasonalized values for March through October of 1958 yields 315.30 ppmv, which is a close approximation of the full year average level, and nearly identical to the 315.34 ppmv level reported by GISS.
The 1800-1849 ice core CO2 levels are the 75-year smoothed Law Dome ice core CO2 levels from NOAA, interpolated as necessary:
https://www.ncei.noaa.gov/pub/data/paleo/icecore/antarctica/law/law_co2.txt
They also report 20-year smoothed levels, but only back to 1832.
The NOAA and GISS figures sometimes differ by a few tenths of a ppmv.
There are links to those data sources, plus ice cores which go back much further than Law Dome, in the footnotes of the graph webpage:
https://sealevel.info/co2.html
You can also “view source” for that web page to see the data, which is embedded in the html file. For the CO2 graph, the 1958 data is around line 500.
Note to self: don’t use the comment system’s “bullet list” feature.
Harold The Organic Chemist Says:
“Please No More Of This CO2 Nonsense”
“No Warming Of Air In Adelaide Since 1857”
At the Mauna Loa Obs. in Hawaii, the concentration of CO2 in dry air is currently 431 ppmv. One cubic meter of this air has mass of 1,290 g and contains 0.85 g of CO2 at STP. This small amount of CO2 cannot absorb enough out-going long wavelength IR light to warm up such a large mass of air. Please note and never forget how little CO2 there is in the air.
Shown in the chart (See below) is a plot of the annual mean temperature in Adelaide from 1857 to 1999. In 1857 the concentration in dry air was ca. 280 ppmv (0.72 g CO2/cu. m. of air), and 1999 it had increased to ca. 368 ppmv (0.72 g CO2/cu. m. of air), but there was no corresponding increase in air temperature this port city. Instead there was slight cooling. In 1857 Tav was 14.2° C and it declined to 16.7° C.
To obtain more recent Adelaide temperature data I went to:
https://www.extremeweatherwatch.com/cities/adelaide/average-temperature-by-year. The Thi and Tlo temperature data from 1887 to 2025 are displayed in a table. The computed Tav for 2025 was 17.4° C. Since measurement error is +/- 0.1° C, it is concluded that there was no warming of air in Adelaide since 1857 to 2025 and that CO2 had no effect on air temperature.
The chart was taken from the late John L. Daly’s website: “Still Waiting For Greenhouse” available at: http://www.john-daly.com. From the home page, go to end and click on “Station Temperature Data”. On the “World Map” click on “Australia”. There is displayed a list of stations. Click on “Adelaide”. To return to the list of station click on the back arrow. Click on the back arrow again to return to the “World Map”. John Daly found over 200 weather stations that showed no warming up to 2002.
The above empirical data and many temperature charts from John Daly’s website falsifies the claims by the corrupt IPCC and the unscrupulous collaborating scientists that CO2 causes “global warming” and is the “control knob of climate change”. Look at the damage that this CO2 nonsense has done and is doing to the economies of the UK, Germany, Australia, California, and New York state, for example.
NB: If you click on the chart, it will expand and become clear. Click on the “X” in the circle to contact the chart and return to Comments.
There is now 431 ppm of CO2 in the atmosphere. If we had not installed solar cells and wind turbines over the past 15 years and just continued our electricity production of 25,000 TWh of electricity in the traditional way, there would instead be 432 ppm in the atmosphere.
You for got to add: /s
From the BBC, 13 December 2025
Also from the BBC, 29 January 2020
But still the BBC led the charge.
#BBCKnew