Guest Post by Willis Eschenbach
[Updated on a totally irregular basis as new information becomes available. Latest update Jan 2, 2026]
Despite my asking over and over in a host of forums, including in my previous post, to date, nobody has been able to tell me just what this supposed “CLIMATE EMERGENCY!!” actually is and where I might find evidence that it exists. Here are some facts for the folks who think that the climate is a real danger to humanity.
As a prologue, to give some perspective for this whole analysis, here’s what all the climate alarmists benefitting from the “climate emergency” are in an uproar about.

Let me begin with the fact that the IPCC itself doesn’t think that there is a “climate crisis” or a “climate emergency”. In the IPCC AR6 WG1, the single mention of a “climate emergency” is a far-too-gentle chiding of the media for using the term, viz:
Some media outlets have recently adopted and promoted terms and phrases stronger than the more neutral ‘climate change’ and ‘global warming’, including ‘climate crisis’, ‘global heating’, and ‘climate emergency’.
SOURCE
And it’s no surprise that the IPCC doesn’t think there’s an emergency. To start with, deaths from climate-related phenomena are at an all-time low. If you think deaths from climate-related catastrophes are an emergency, please point in the graph below to the start of the “emergency”.

And it’s not just deaths. Global total infrastructure damages have been decreasing as well …


… as well as US damages from floods.

Someone said they didn’t believe UN data, so here’s a separate analysis of flood damage costs.

Storminess has not gone up, and there’s been no increase in hurricane strength or frequency … no “emergency” there.
First, the strength.

And here is the global hurricane frequency for all hurricanes, the strongest hurricanes, and tropical storms.

And there is much longer evidence to back that up. Here are the records of all hurricanes (left) and major hurricanes (right) that came ashore in the US in the last 150 years … NO increase. SOURCE: Nature magazine.

And here are the numbers of Pacific typhoons (hurricanes) from the Japanese Meteorological Agency.

Here are landfalling typhoons (hurricanes) in China. Like the majority of the world areas, we’re seeing fewer landfalls in China.

Here are all the records of landfalling hurricanes worldwide. This shows Global, North Atlantic (NATL), Western Pacific (WPAC), Eastern Pacific (EPAC), Northern Indian Ocean (NIO), and Southern Hemisphere (SH) landfalls for both major and all hurricanes.

The source study says (emphasis mine):
The collective global frequency of all global hurricane landfalls and the minor and major subsets shows considerable interannual variability but no significant linear trend (Fig. 2). Furthermore, when considering each basin individually during the entire time periods analyzed, it is not possible to ascertain a positive or negative trend in minor, major, or overall hurricane landfall frequency in all basins except the SH. In the SH a significant positive trend in major hurricane landfalls was detected; yet, the sample size is still small (Table 2). This result is not unexpected considering the known multidecadal signals in TC activity, which cannot be adequately resolved by our comparatively short historical record.
And here are a century and a half of records of the number of landfalling hurricanes in Florida.

Finally, here are the declining numbers of both strong and average cyclones (Southern Hemisphere hurricanes) in Australian waters, from the Australian Bureau of Meteorology (BOM).

To close out the hurricane question, here’s the NOAA’s Geophysical Fluid Dynamics Laboratory in 2025 on the question:
“We conclude that the historical Atlantic hurricane data at this stage do not provide compelling evidence for a substantial greenhouse warming-induced century-scale increase in: frequency of tropical storms, hurricanes, or major hurricanes, or in the proportion of hurricanes that become major hurricanes. “
Yep …
Moving on to droughts, even the IPCC says there’s only one chance in five (“low confidence”) that global droughts are increasing (see the end notes). No flood or drought emergency. Nor have the “wet areas been getting wetter and the dry areas getting drier”. Here’s evidence from rainfall data.

As has happened throughout the existence of the earth some areas have been getting wetter and some drier, but the pattern expected from CO2 warming has not appeared. Here’s more evidence of the same thing, this time from the Self-Calibrating Palmer Drought Severity Index (scPDSI).

As with the rain, some areas are getting more droughts and some getting fewer droughts … but without any discernible pattern.
Droughts in the US have been decreasing, not increasing.

There are a lot of claims that the current drought in the US West is a result of “global warming” … but that point of view is shortsighted with regard to the history of the West. Or as the IPCC says:
“Furthermore, Williams et al. (2020) used a combination of hydrological modelling and tree-ring reconstructions to show that the period from 2000 to 2018 was the driest 19-year span in south- western North America since the late 1500s. Nonetheless, tree rings also indicate the presence of prolonged megadroughts in western North America throughout the last millennium that were more severe than 20th and 21st century events (high confidence). These were associated with internal variability and indicate that large-magnitude changes in the water cycle may occur irrespective of anthropogenic influence.”
“Internal variability” … we call that “weather” …

And here is the latest study from Nature Magazine showing, guess what? Globally, droughts are decreasing, not increasing.

Nor are the extremes in the amount of moisture (droughts, floods) increasing in the US.

And the same is true in Europe. No increase or decrease in droughts in 150 years.

Global weather disaster losses as a percentage of assets at risk (global GDP) are decreasing, not increasing.

Alarmists keep posting scary-looking graphs of the loss of polar ice, like this one of Antarctica.

Or this one, from Greenland.

Those look totally frightening and emergency-like … until you realize that they ignore the reality of just how much ice there is in those locations. Here are the corresponding changes in total ice mass for the two locations.


In fact, a recent study in Nature Magazine says “The Antarctic continent has not warmed in the last seven decades, despite a monotonic increase in the atmospheric concentration of greenhouse gases.”
Despite all the hype and all the alarmism about how a melting Antarctica was going to raise sea levels by 20 feet (6 metres) and flood the world, Antarctica. Has. Not. Warmed. In. The. Last. Seven. Decades.
What about glaciers? Aren’t they shrinking? Well, yes … but they have been doing so since the depth of the Little Ice Age around the year 1750. And that means the first 150 years of shrinkage can’t be from CO2. Here’s the data regarding glacier length, from Oerlemans 2005

Funny story about that. As glaciers increased in the runup to the Little Ice Age, in 1678, the inhabitants of the Swiss village of Fiesch, fearful of the glaciers that threatened their village, inaugurated an annual pilgrimage. The hope was to banish the ice forms with chants, prayers and a vow to lead virtuous lives. In exchange, God would spare their homes and livelihoods from being swallowed by Europe’s largest glacier as it expanded toward the valley with heavy winter snows.. And several centuries later, their prayers appeared to have been answered.
However, now that the glacier has become a tourist attraction, a retreating glacier isn’t good for the village … so the villagers have gone to the Pope to release them from their vow, so they can now pray that the glacier stops retreating … seems humans are never satisfied, but then, that’s no surprise … however, I digress.
How about the pH of the ocean? Unlike what most folks imagine, the pH of the ocean varies widely both with location, and with time at each location. Here a graph of the pH and its range in a number of ocean locations.

The “whiskers” (horizontal black lines with vertical lines at the end) show the variations in pH in each location. At the top of the graph, you can see whiskers showing the tiny projected drop in pH by the year 2100. Many ocean locations change that much in weeks or months. Bottom line? The projected change by 2100 is lost in the noise. A more detailed discussion of the pH issue is here.
What about the widely-hyped reduction in sea ice? Turns out that as of the end of 2023, we’re back where we started. After a period of low sea ice, both Arctic and Antarctic sea ice are within the historical range.

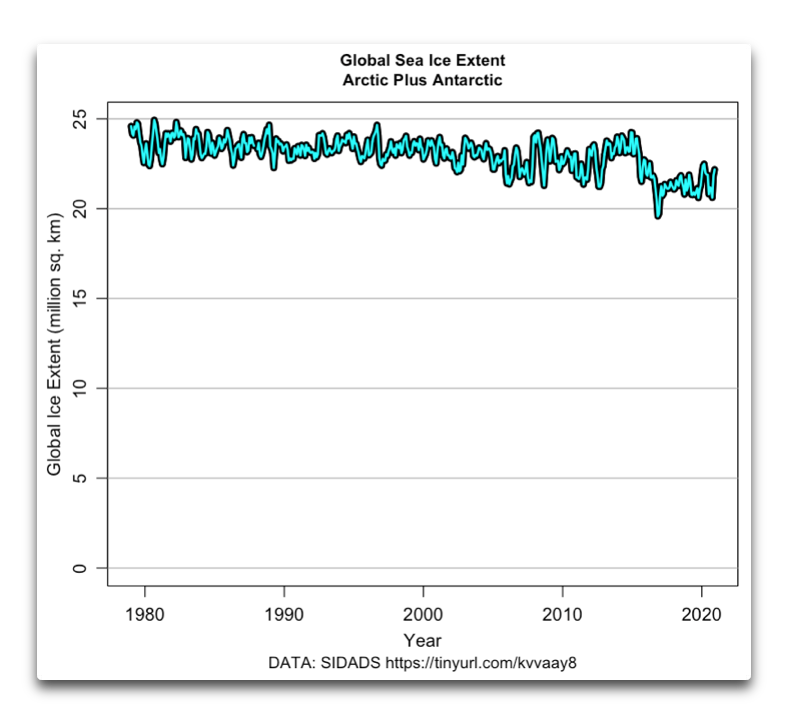
Here’s a long-term look at global sea ice. Curiously, there was little change until about 2015, when it dropped and then leveled off. Not one climate model and not one scientist predicted that.

And here’s a larger look at just the Arctic sea ice … again, unpredicted behavior.

Let’s move on to snow. Remember all the hysteria about how “our children just won’t know what snow is”? Turns out the rumors of the death of snow are greatly exaggerated. Here’s the 2023-2024 snow record to date … it’s within one standard deviation of the mean, not unusual in the slightest.

And here is the Rutgers Snow Labatory’s snow extent data from 1972 to April 2023 … basically, no change.

Tide gauges show no acceleration in the rate of sea-level rise, merely the up-and-down that’s been going on for a century and more …

… and the claimed acceleration in satellite-measured sea level is merely an artifact of changing satellites.

Polar bears, once considered to be the “canary in the coal mine” for the “climate emergency”, are doing very well, thanks. More here: https://fee.org/articles/the-myth-that-the-polar-bear-population-is-declining/


Yields of all major food crops continue to rise, and humans are better fed, clothed, and housed against the vagaries of weather than at any time in the past.

And it’s not just yields that are going up. Despite the gradual warming since 1965, humans are better fed than ever. And this is a very valuable measure. Measures of income and wealth can get distorted because one person can make fifty times the income as another, or own fifty houses to the other’s one house.
But nobody can eat 50 breakfasts, so average food consumption measures the nutrition of the whole population, rich and poor alike. Here is the consumption of protein, calories, and fat for all the regions of the world.


Note that on all three charts above (protein, calories, and fats), the world as a whole is now doing almost as well as North America did in my childhood in the 1950s … telling us that no, warming temperatures aren’t causing food shortages.
Land temperatures have already risen more than the dreaded 2°C, with no cataclysmic consequences … there has been no historical “climate emergency” despite temperature increases.

And Berkeley Earth global temperature is already above the dreaded 1.5°C threshold.

Paleo data shows that over the Holocene temperatures have varied widely with little change in CO2, and the current warming started in 1700, long before the modern CO2 increase.

None of the endless serial doomcasts from the climate alarmists have come true …

There has been no global increase in the radiated energy of wildfires … here’s the NASA satellite data.

Here’s Australia …

Here’s the data from Canada … the number of fires and the area burned are both decreasing.

And some more real-world global wildfire data …

There’s another way to measure wildfires, by the amount of CO2 emitted from fires globally. Again, the trend is downward. SOURCE

And here’s another graph, showing total area burned by wildfires 2012-2025.

And here’s a quote from the Intergovernmental Panel on Climate Change (IPCC):
A recent analysis using the Global Fire Emissions Database v.4 (GFED4s) that includes small fires concluded that the net reduction in land area burnt globally during 1998–2015 was –24.3 ± 8.8% (–1.35 ± 0.49% yr–1) (Andela et al. 2017)
In fact, foresters have been predicting the increase in California wildfires for some years now due to the insane “green” regulations preventing logging.

And here’s a tragically accurate view of the issue …

Meanwhile, increasing CO2 is causing increased plant growth all around the globe, which is increasing the food supplies of humans and animals alike. Here’s the data from NASA.

See also the NASA study “The Greening Of The Earth Mitigates Surface Warming“
The value of annual global farm production is on the order of five trillion dollars. The ~10% increase in plant growth is giving us on the order of $500 billion dollars per year of increased food and fiber for the world population … how come people who hate CO2 never seem to mention that?
Perhaps it’s because honest people, including IPCC officials, have admitted that the “climate emergency” is just an excuse to redistribute global wealth.

Regarding heat, very hot days in the US (over 100°F, or 38°C) were much higher in the 1930s than at any other time in the last 125 years.


There’s no sign of the “50 million climate refugees by 2010” confidently predicted by the United Nations in 2005 (click to enlarge).

Coral atolls are not sinking below the seas, in fact many are increasing in size.

And the Great Barrier Reef, which has been claimed over and over to be a victim of coral bleaching, actually has more coral cover than at any time since records have been kept in 1985.

Strong tornadoes in the US are steadily decreasing over the last 72 years.

And the same is true of weaker tornadoes … decreasing.

There’s no sign of the fabled “Sixth Wave Of Extinctions”.

Climate models have routinely predicted far greater warming than has actually occurred.

This should not surprise anyone—the intractability of climate predictions has long been recognized even by the IPCC, viz:
“In sum, a strategy must recognise what is possible. In climate research and modelling, we should recognise that we are dealing with a coupled non-linear chaotic system, and therefore that the long-term prediction of future climate states is not possible”
IPCC Third Assessment Report, The Scientific Basis 14 2 2 2, p.774
Next, all of the weather risks dramatically foretold by climate alarmists have been with us forever—flood, fire, famine, drought, heat waves, hurricanes, tornadoes, all are as ancient as the hills. We are protected from the vagaries of weather by one thing—wealth. It is the poorest of the world who are most at risk from flood, fire, and famine. When I was born, about three-quarters of the world lived on less than $1.90 per day. Now, it is less than 10% of the world living in those conditions.

This increase in wealth has been driven and fueled by one thing … energy, mostly in the form of fossil fuels.

So if we wish to keep insulating people from the age-old destructive effects of weather, we need to maintain and increase the amount of cheap energy available, especially to the poor. If you insist on fighting the imaginary climate menace, at least have the kindness and the human decency not to do it on the backs of the poor by increasing energy costs, whether by “carbon taxes” or in any other way. I discuss this most important issue in my post “We Have Met The 1%, And He Is Us.”
How about the dreaded heat waves that are supposed to be an inevitable result of “global warming”? If you need something to worry about, that’s not it … the real danger is not heat, it’s cold.


And here’s the UK Government’s assessment of the effect of more warmer days and fewer cold days … in twenty years, the warming has saved over half a million lives.

Here’s another analysis of heat vs. cold … it says that global warming is saving 160,000 lives per year through fewer cold deaths.

But if you want to worry about heat waves, please get back to me when the heat waves are worse than those of the 1930s, well before the large increase in CO2 …

Here’s another view of the temperatures of US summers. Again, nothing unusual going on.

Finally, here’s a very long-term view of heat versus cold … it hasn’t been this cold in 225 million years.

Next, here is the radical change in downwelling radiation at the surface from the increase in CO2 that is supposed to be driving the “CLIMATE EMERGENCY!!!” What I’ve shown is the change that in theory would have occurred from the changes in CO2 from 1750 to the present, and the change that in theory will occur in the future when CO2 increases from its present value to twice the 1750 value. This is using the generally accepted (although not rigorously derived) claim that the downwelling radiation change from a doubling of CO2 is 3.7 watts per square metre (W/m2). The purpose is to show how small these CO2-caused changes are compared to total downwelling radiation.

The changes in downwelling radiation from the increase in CO2 are trivially small, lost in the noise …
Finally, an “emergency” is defined in the dictionary as “a serious, unexpected, and often dangerous situation requiring immediate action.” Alarmists have been warning us over and over about the purported impending “emergency” for 50 years, so it is hardly “unexpected”. None of their endless predictions of imminent tragedy have come true, and despite decades of warning, no significant “immediate action” has been taken … so by definition, it can’t be an emergency.

Let me close with this most excellent overview of deaths from every kind of natural disasters, from Our World In Data. We are indeed living in the best of times.

For five decades, we’ve been told every year that we only have five, ten, or twenty years before disaster … I mean, seriously, how can people still believe these serially failed doomcasters?

Let me close this section with a scientific study of this exact question, whether there has been a significant increase in extreme weather events. The study is titled “A critical assessment of extreme events trends in times of global warming“, and the conclusion says:
In conclusion on the basis of observational data, the climate crisis that, according to many sources, we are experiencing today, is not evident yet.

Can’t say it any clearer than that. And the IPCC itself agrees. Here’s what the UN Office Of Disaster Risk Reduction has to say:

“Overall, the number of disaster events per year and the distribution of disaster sub-groups has remained relatively stable between the year 2000 and 2019, with an average of 367 recorded events per year (Figure 5)“
And the IPCC AR6 agrees. Here, shown as white squares, are the areas of the weather where the IPCC says there is no “global-warming” related significant anthropogenic change in frequency or strength.

Let’s be clear about this. The following are the areas where the IPCC itself, in the graphic above, says there is no scientific evidence for a “global warming” signal:
- Air Pollution Weather (temperature inversions)
- Aridity
- Avalanche (snow)
- Average rain
- Average Wind Speed
- Coastal Flood
- Drought Affecting Crops (agricultural drought)
- Drought From Lack Of Rain (hydrological drought)
- Erosion of Coastlines
- Fire Weather (hot and windy)
- Flooding From Heavy Rain (pluvial floods)
- Frost
- Hail
- Heavy Rain
- Heavy Snowfall and Ice Storms
- Landslides
- Marine Heatwaves
- Ocean Alkalinity
- Radiation at the Earth’s Surface
- River/Lake Floods
- Sand and Dust Storms
- Sea Level
- Severe Wind Storms
- Snow, Glacier, and Ice Sheets
- Tropical Cyclones
So when folks claim things like “We’re already seeing the effects of global warming in storms/cyclones/floods/fire weather/sea level/etc.”, feel free to tell them that the IPCC and reality itself beg to disagree. For example, here are local storm reports from the US, showing the recent decade with below average hail, tornadoes, and wind in US storms.

[UPDATE AUGUST 2023—You can clearly see above that the IPCC itself agrees wholeheartedly with the paper “A critical assessment of extreme events trends in times of global warming” discussed above. Both the paper and the IPCC Table 12.2 above say that to date, there is very little sign of any change in almost all measures of extreme events.
Despite that, the usual alarmist “scientists”, including the serial liar Michael Mann, have intimidated the publisher of the paper into withdrawing the paper. I cannot find any report of anything that they found to be false. They just claimed unspecified problems with “the selection of the data, the analysis and the resulting conclusions” … yeah, right. There’s an excellent discussion of the issues here.
Climate cowards. But the good news is, you know they are running scared when they have to illicitly prevent the publication of ideas that might do significant damage to their endless climate money train … ]
And before we spend trillions of dollars on an unachievable plan to totally redo the entire global energy supply, how about we wait until someone can actually let us in on the big secret—just where is this mysterious “CLIMATE EMERGENCY!!!”, and when did it start? What exactly is it that people are hyperventilating about? What are people afraid of, specifically? Just where is the “existential threat” folks rave about … or even a serious threat?
My very best wishes to all, and take a deep breath—there’s no impending Thermageddon™ just around the corner.
w.
MY USUAL REQUEST: When you comment, please quote the exact words you are discussing. This will avoid much of the misunderstanding that plagues the intarwebs.
This is an excellent post on the facts of the matter. Critical readers will have two questions after thinking it over.
1) Does anyone really believe in the alarmism?
I can see no evidence anyone seriously does. Countries in the West have politicians who claim to, but if you look at their actions, they don’t meet the smell test. They simply do not advocate the wholesale lifestyle changes that would be required to get to anything like net-zero. They focus instead on measures which will have minimal effects – like installing wind and solar electricity generation. Where are the proposals to move the population into high density urban housing and abolish suburbs, shopping malls and the auto industry?
If you look at the rest of the world, they pay lip service, but are continuing to construct new coal fired power generation and increase ICE use.
There is no evidence that China, India, any of the developing world, really believes it either at a political or scientific level, still less that they have any intention of lowering their own emissions. The theory claims that there is a catastrophic level of global emissions, and that this should motivate the West to reduce its own emissions to zero, but its advocates studiously ignore the fact that the proposed Western reductions will have no material effect on the level of global emissions, and they refuse to advocate reductions by (for instance) the Chinese, which would actually have such an effect.
2) This is part of a very strange cultural phenomenon
If we accept that there is nothing to be alarmed about, and that the proposed measures anyway have no bearing on the alleged problem, and that only a tiny number of activists really believe there is, the next thing we’ll start to wonder about is why it has got so much traction. By which I mean, such a chorus of assertions of belief. The classic examples are the media agreement to refer not to ‘global warming’ but to ‘heating’, and the endless Guardian and BBC wailing about the alleged ‘climate emergency’ and demanding ever more subsidies for wind and solar.
We could add some things which may not be discussed. The Islamic slave trade and Islamic intolerance may not be referred to. It is taboo to point out that China is doing one third and rising of global emissions. You will never hear of the actions of the British Goverment in abolishing slavery and the slave trade in the 1800s.
You have to notice the fact that the idea of the climate emergency and the advocacy of net-zero clusters with some other beliefs, or at least professions of belief. These would include the ideas usually referred to as ‘critical race theory’, the ideas and policy prescriptions of the trans movement, the media climate of banning of dissent. In the US this cluster recently included the idea that Trump was planning a coup. It includes also the Antifa and BLM theories. It includes the current mania for finding evidence of racist antecedents in cultural traditions – most recently Jane Austen’s tea drinking.
And a key element of this cluster of ideas is that no evidence based discussion can be permitted on any of the tenets. You want to see this in action, read the Ars Technica Forums. Over the years posters offering any opposition to the cultural consensus on anything from Trump through climate and energy to gender are purged after a couple of weeks. Real Climate operates similarly. But the phenomenon is universal, its not just discussion forums, consider reactions to J K Rowling’s views on gender. To Peter Ridd’s views on reefs. To the treatment of Maya Forstater.
We are in a crisis, there is no doubt of it. But its not a climate crisis, its a cultural crisis in which our own nomenklatura has come to adopt or pay lip service to a cult world view.
The difficult questions which this excellent post raise for us are, why, where will it go next, and what to do about it. I do not know the answers.
Numbers are on the skeptic’s side, as Willis has illustrated.
There may be some game-changing climate science waiting in the wings.
We just have to keep repeating the numbers until public awareness catches up, or until the future temperature record continues to show it is not connected to the amount of CO2 in the atmosphere.
A few decades of cooling would probably do the trick, but I wouldn’t look forward to that. I like warm weather.
One thing we can see is that according to the alarmists, rising CO2 levels will lead to rising temperatures, but then we have to ask the question: Why didn’t the temperatures continue to climb after the 2016 highpoint when CO2 levels contiued to climb during that period? Instead, temperatures have cooled 0.7C since that high point. CO2 is up, yet the Temperatures are down. That doesn’t fit the theory.
The alarmists are hoping and praying that the temperatures go higher.
Applause!
This post should be pinned permanently to the front page.
I posted your wonderful guest post HERE and the few replies makes clear they are unable to answer your simple question.
Example: “This is a link to a blogger whose main if not only purpose is to debunk anthropomorphic climate change. Not quite a reliable source for fact based science. I know this because I did not stop at the link, I went quite a bit farther. Sometimes the danger of relying on one unchecked,, un fact checked link leaves you open to unwisely relying on some ones deranged notion as defensible facts. Sorry you fell for this one.”
======
LOL
That is really funny.
It’s like Jason Robards in All The Presidents Men, “they call us every name in the book but don’t deny the story”.
It’s all non-denial denial.
Great summary. How about the availability of potable water. It has also dramatically increased. The world in Data site only lists data for 1990 -2015. If extended back to the late 1800’s or the early 1900’s, I’m sure the increase would be very dramatic. Brought to us courtesy of fossil fuels. https://ourworldindata.org/water-access
Don’t emergencies have to be emergent? Something that may or may not happen in 2050 doesn’t seem like an immediate threat to me.
I live in Edmonton, which is a city in Western Canada, and I first arrived here in 1971, when I was nineteen. The climate has changed in the last fifty years. It’s better. The winters are noticeably warmer, but the summers are not hotter. In 1971 we would get something like ten days every winter when the temperature was colder than 40 below. That never happens now. On the other hand, a hot day here is anything warmer than 80 degrees Fahrenheit, which happens on maybe ten days each year. So, climate change good.
Bravo Willis. The Answer is its a Phony Emergency and in reality is a climate optimum This is a tour de force of refutation
Adding to my two cents.
There are many suggestions below for additions, corrections, changes.
I think this post should be updated and reposted, maybe once a month, allow new round of comments, allow new scientologists the opportunity to try and nick Willis, failed below.
Keep this post up to date and at the top, monthly.
Hello again Willis,
No doubt I do a very good impersonation of a broken record, but may I politely enquire why your article includes graphs of “total ice mass” in Antarctica, but none of “total sea ice mass” in the Arctic?
Ice albedo feedback and all that!
Jim
Arctic sea ice is indeed decreasing. At the same time, Antarctic sea ice sea ice is increasing. This bipolar see-saw seems to be a natural feature of the climate.
I don’t see how this constitutes an “emergency”, particularly since we only have data from a sea-ice peak in 1979.
Also, the Arctic has been free of sea ice for fairly long periods during the Holocene. See here.
Finally, the ice-albedo feedback is much smaller than most folks suppose. Why? Because a) the solar angle is so low that ice’s albedo isn’t all that different from ocean albedo, and b) when the sun is mostly there the ice mostly isn’t, and when the ice is mostly there the sun mostly isn’t.
Best regards,
w.
Thanks Willis,
We can certainly agree on your first sentence, but then I am forced to quibble!
I referred to “total sea ice mass in the Arctic” and you bring me global sea ice extent instead.
Here’s the University of Washington Polar Science Center’s PIOMAS graph of modelled Arctic sea ice volume in September going back as far as 1979. It doesn’t include April 2021 yet.
Nevertheless I am sure you can readily appreciate the difference between the PIOMAS graph and yours?
Let’s start with the fact that PIOMAS model doesn’t have any “sea ice mass” data, so I wasn’t clear what you were asking.
In addition, there’s no corresponding Antarctic ice volume data, so you’re only looking at half the picture. And since (for unknown reasons) there’s a “polar see-saw” of ice mass, so when Arctic goes up Antarctic typicall goes down and vice versa, it’s very misleading to look at either one in isolation.
But yes, I can see the difference. The main difference is that your PIOMAS graph contains a bogus trendline that totally obscures the fact the decrease stopped about a decade ago. It’s also alarmist in that it doesn’t show the annual values, just individual months. Here’s the real graph.
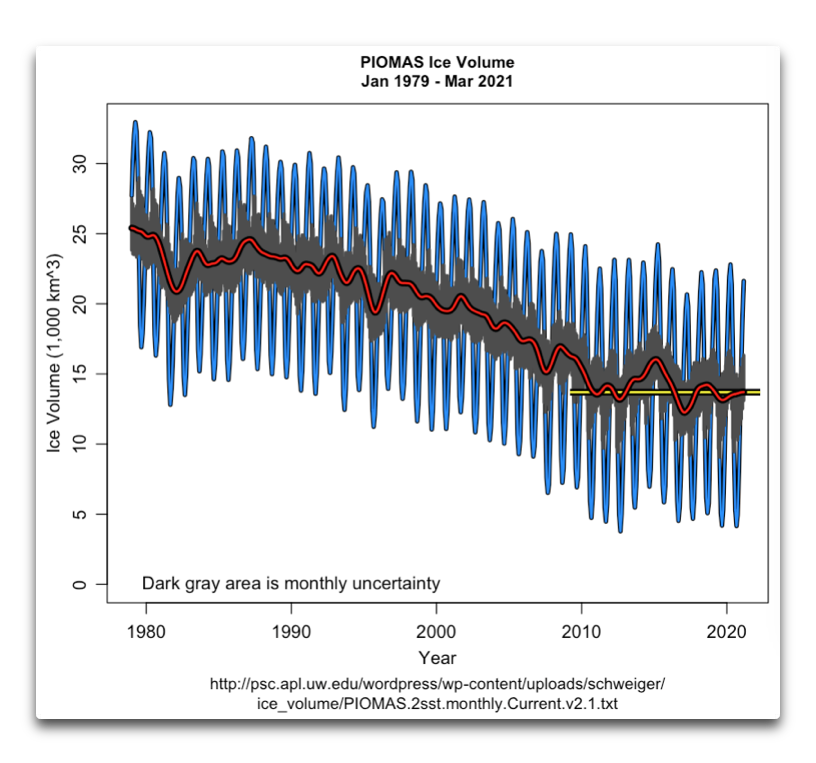
Next, the PIOMAS numbers are NOT data. They are the output of a model, as the name states. (Pan-Arctic Ice-Ocean Modeling and Assimilation System). I always prefer real data to guesses by some programmer.
Finally, the PIOMAS data is hugely autocorrelated, as is not uncommon with model output. It has a Hurst exponent of 0.93. As a result, the number of effective independent data points of the entire 1979-present dataset is only 3, so we can’t say anything about whether the trend is real or it is just an expected trend as is common with highly autocorrelated data.
w.
Evenin’ Willis (UTC),
It’s rather late here in soggy South West England, so I shall be brief until the morrow.
1) Surely to a very good first approximation mass is proportional to volume?
2) The Arctic is an ocean surrounded by land whereas Antarctica is land surrounded by ocean
3) Have you never previously heard of GIOMAS? The ‘G’ stands for “global”.
4) I mentioned “modelled” in my comment above. If you prefer “real data” then please see this CryoSat-2/SMOS volume graph, which of necessity only goes back to 2010:
Thanks, Jim.
1) Yes, but you were asking for mass, and I didn’t have any sites giving me mass.
2) True, but despite that they have almost exactly the same area of sea ice … go figure. Your comments and our interchange have inspired me to write a post on the subject. It will post on WUWT at 10 AM Pacific time tomorrow, 6 pm your time.
3) Nope. Never heard of GIOMAS, nor do I have any interest in it. As mentioned, model output is generally my last choice of things to investigate.
4) 2010 until now is not long enough to tell us much of anything.
Best regards,
w.
Mornin’ Willis (UTC),
2) I await your new article with barely bated breath.
3) You don’t know what you’re missing!
4) How about a century and a bit then?
https://twitter.com/zlabe/status/1361683398431924226
Thanks, Jim. Yes, and everyone knows that models couldn’t possibly be wrong … I find it hilarious to see the gigantic difference between v1 and v2.1, particularly around 1980. Gives a man such confidence in the model(s).
w.
Sadly there is no Planet B to experiment on, so modelling Planet A is something of a necessity, is it not?
Depends on the model, does it not? For example, the College of London COVID models used to generate the COVID hysteria were wildly inaccurate and cost thousands of years of life lost due to totally unnecessary and wildly destructive lockdowns … so no, you cannot make a general statement that “modeling is something of a necessity”.
w.
Willis, you have written a lot of stuff I do believe is wonderful.
I especially like your tropical climate regulation with thunderstorms that dissipate whatever energy that built up that day.
This Posting is a really wonderful reminder of evidence that shows the climate alarmism is a based on a bunch of junk.
Thanks!