Guest Post by Willis Eschenbach
[Updated on a totally irregular basis as new information becomes available. Latest update Jan 2, 2026]
Despite my asking over and over in a host of forums, including in my previous post, to date, nobody has been able to tell me just what this supposed “CLIMATE EMERGENCY!!” actually is and where I might find evidence that it exists. Here are some facts for the folks who think that the climate is a real danger to humanity.
As a prologue, to give some perspective for this whole analysis, here’s what all the climate alarmists benefitting from the “climate emergency” are in an uproar about.

Let me begin with the fact that the IPCC itself doesn’t think that there is a “climate crisis” or a “climate emergency”. In the IPCC AR6 WG1, the single mention of a “climate emergency” is a far-too-gentle chiding of the media for using the term, viz:
Some media outlets have recently adopted and promoted terms and phrases stronger than the more neutral ‘climate change’ and ‘global warming’, including ‘climate crisis’, ‘global heating’, and ‘climate emergency’.
SOURCE
And it’s no surprise that the IPCC doesn’t think there’s an emergency. To start with, deaths from climate-related phenomena are at an all-time low. If you think deaths from climate-related catastrophes are an emergency, please point in the graph below to the start of the “emergency”.

And it’s not just deaths. Global total infrastructure damages have been decreasing as well …


… as well as US damages from floods.

Someone said they didn’t believe UN data, so here’s a separate analysis of flood damage costs.

Storminess has not gone up, and there’s been no increase in hurricane strength or frequency … no “emergency” there.
First, the strength.

And here is the global hurricane frequency for all hurricanes, the strongest hurricanes, and tropical storms.

And there is much longer evidence to back that up. Here are the records of all hurricanes (left) and major hurricanes (right) that came ashore in the US in the last 150 years … NO increase. SOURCE: Nature magazine.

And here are the numbers of Pacific typhoons (hurricanes) from the Japanese Meteorological Agency.

Here are landfalling typhoons (hurricanes) in China. Like the majority of the world areas, we’re seeing fewer landfalls in China.

Here are all the records of landfalling hurricanes worldwide. This shows Global, North Atlantic (NATL), Western Pacific (WPAC), Eastern Pacific (EPAC), Northern Indian Ocean (NIO), and Southern Hemisphere (SH) landfalls for both major and all hurricanes.

The source study says (emphasis mine):
The collective global frequency of all global hurricane landfalls and the minor and major subsets shows considerable interannual variability but no significant linear trend (Fig. 2). Furthermore, when considering each basin individually during the entire time periods analyzed, it is not possible to ascertain a positive or negative trend in minor, major, or overall hurricane landfall frequency in all basins except the SH. In the SH a significant positive trend in major hurricane landfalls was detected; yet, the sample size is still small (Table 2). This result is not unexpected considering the known multidecadal signals in TC activity, which cannot be adequately resolved by our comparatively short historical record.
And here are a century and a half of records of the number of landfalling hurricanes in Florida.

Finally, here are the declining numbers of both strong and average cyclones (Southern Hemisphere hurricanes) in Australian waters, from the Australian Bureau of Meteorology (BOM).

To close out the hurricane question, here’s the NOAA’s Geophysical Fluid Dynamics Laboratory in 2025 on the question:
“We conclude that the historical Atlantic hurricane data at this stage do not provide compelling evidence for a substantial greenhouse warming-induced century-scale increase in: frequency of tropical storms, hurricanes, or major hurricanes, or in the proportion of hurricanes that become major hurricanes. “
Yep …
Moving on to droughts, even the IPCC says there’s only one chance in five (“low confidence”) that global droughts are increasing (see the end notes). No flood or drought emergency. Nor have the “wet areas been getting wetter and the dry areas getting drier”. Here’s evidence from rainfall data.

As has happened throughout the existence of the earth some areas have been getting wetter and some drier, but the pattern expected from CO2 warming has not appeared. Here’s more evidence of the same thing, this time from the Self-Calibrating Palmer Drought Severity Index (scPDSI).

As with the rain, some areas are getting more droughts and some getting fewer droughts … but without any discernible pattern.
Droughts in the US have been decreasing, not increasing.

There are a lot of claims that the current drought in the US West is a result of “global warming” … but that point of view is shortsighted with regard to the history of the West. Or as the IPCC says:
“Furthermore, Williams et al. (2020) used a combination of hydrological modelling and tree-ring reconstructions to show that the period from 2000 to 2018 was the driest 19-year span in south- western North America since the late 1500s. Nonetheless, tree rings also indicate the presence of prolonged megadroughts in western North America throughout the last millennium that were more severe than 20th and 21st century events (high confidence). These were associated with internal variability and indicate that large-magnitude changes in the water cycle may occur irrespective of anthropogenic influence.”
“Internal variability” … we call that “weather” …

And here is the latest study from Nature Magazine showing, guess what? Globally, droughts are decreasing, not increasing.

Nor are the extremes in the amount of moisture (droughts, floods) increasing in the US.

And the same is true in Europe. No increase or decrease in droughts in 150 years.

Global weather disaster losses as a percentage of assets at risk (global GDP) are decreasing, not increasing.

Alarmists keep posting scary-looking graphs of the loss of polar ice, like this one of Antarctica.

Or this one, from Greenland.

Those look totally frightening and emergency-like … until you realize that they ignore the reality of just how much ice there is in those locations. Here are the corresponding changes in total ice mass for the two locations.


In fact, a recent study in Nature Magazine says “The Antarctic continent has not warmed in the last seven decades, despite a monotonic increase in the atmospheric concentration of greenhouse gases.”
Despite all the hype and all the alarmism about how a melting Antarctica was going to raise sea levels by 20 feet (6 metres) and flood the world, Antarctica. Has. Not. Warmed. In. The. Last. Seven. Decades.
What about glaciers? Aren’t they shrinking? Well, yes … but they have been doing so since the depth of the Little Ice Age around the year 1750. And that means the first 150 years of shrinkage can’t be from CO2. Here’s the data regarding glacier length, from Oerlemans 2005

Funny story about that. As glaciers increased in the runup to the Little Ice Age, in 1678, the inhabitants of the Swiss village of Fiesch, fearful of the glaciers that threatened their village, inaugurated an annual pilgrimage. The hope was to banish the ice forms with chants, prayers and a vow to lead virtuous lives. In exchange, God would spare their homes and livelihoods from being swallowed by Europe’s largest glacier as it expanded toward the valley with heavy winter snows.. And several centuries later, their prayers appeared to have been answered.
However, now that the glacier has become a tourist attraction, a retreating glacier isn’t good for the village … so the villagers have gone to the Pope to release them from their vow, so they can now pray that the glacier stops retreating … seems humans are never satisfied, but then, that’s no surprise … however, I digress.
How about the pH of the ocean? Unlike what most folks imagine, the pH of the ocean varies widely both with location, and with time at each location. Here a graph of the pH and its range in a number of ocean locations.

The “whiskers” (horizontal black lines with vertical lines at the end) show the variations in pH in each location. At the top of the graph, you can see whiskers showing the tiny projected drop in pH by the year 2100. Many ocean locations change that much in weeks or months. Bottom line? The projected change by 2100 is lost in the noise. A more detailed discussion of the pH issue is here.
What about the widely-hyped reduction in sea ice? Turns out that as of the end of 2023, we’re back where we started. After a period of low sea ice, both Arctic and Antarctic sea ice are within the historical range.

Here’s a long-term look at global sea ice. Curiously, there was little change until about 2015, when it dropped and then leveled off. Not one climate model and not one scientist predicted that.

And here’s a larger look at just the Arctic sea ice … again, unpredicted behavior.

Let’s move on to snow. Remember all the hysteria about how “our children just won’t know what snow is”? Turns out the rumors of the death of snow are greatly exaggerated. Here’s the 2023-2024 snow record to date … it’s within one standard deviation of the mean, not unusual in the slightest.

And here is the Rutgers Snow Labatory’s snow extent data from 1972 to April 2023 … basically, no change.

Tide gauges show no acceleration in the rate of sea-level rise, merely the up-and-down that’s been going on for a century and more …

… and the claimed acceleration in satellite-measured sea level is merely an artifact of changing satellites.

Polar bears, once considered to be the “canary in the coal mine” for the “climate emergency”, are doing very well, thanks. More here: https://fee.org/articles/the-myth-that-the-polar-bear-population-is-declining/


Yields of all major food crops continue to rise, and humans are better fed, clothed, and housed against the vagaries of weather than at any time in the past.

And it’s not just yields that are going up. Despite the gradual warming since 1965, humans are better fed than ever. And this is a very valuable measure. Measures of income and wealth can get distorted because one person can make fifty times the income as another, or own fifty houses to the other’s one house.
But nobody can eat 50 breakfasts, so average food consumption measures the nutrition of the whole population, rich and poor alike. Here is the consumption of protein, calories, and fat for all the regions of the world.


Note that on all three charts above (protein, calories, and fats), the world as a whole is now doing almost as well as North America did in my childhood in the 1950s … telling us that no, warming temperatures aren’t causing food shortages.
Land temperatures have already risen more than the dreaded 2°C, with no cataclysmic consequences … there has been no historical “climate emergency” despite temperature increases.

And Berkeley Earth global temperature is already above the dreaded 1.5°C threshold.

Paleo data shows that over the Holocene temperatures have varied widely with little change in CO2, and the current warming started in 1700, long before the modern CO2 increase.

None of the endless serial doomcasts from the climate alarmists have come true …

There has been no global increase in the radiated energy of wildfires … here’s the NASA satellite data.

Here’s Australia …

Here’s the data from Canada … the number of fires and the area burned are both decreasing.

And some more real-world global wildfire data …

There’s another way to measure wildfires, by the amount of CO2 emitted from fires globally. Again, the trend is downward. SOURCE

And here’s another graph, showing total area burned by wildfires 2012-2025.

And here’s a quote from the Intergovernmental Panel on Climate Change (IPCC):
A recent analysis using the Global Fire Emissions Database v.4 (GFED4s) that includes small fires concluded that the net reduction in land area burnt globally during 1998–2015 was –24.3 ± 8.8% (–1.35 ± 0.49% yr–1) (Andela et al. 2017)
In fact, foresters have been predicting the increase in California wildfires for some years now due to the insane “green” regulations preventing logging.

And here’s a tragically accurate view of the issue …

Meanwhile, increasing CO2 is causing increased plant growth all around the globe, which is increasing the food supplies of humans and animals alike. Here’s the data from NASA.

See also the NASA study “The Greening Of The Earth Mitigates Surface Warming“
The value of annual global farm production is on the order of five trillion dollars. The ~10% increase in plant growth is giving us on the order of $500 billion dollars per year of increased food and fiber for the world population … how come people who hate CO2 never seem to mention that?
Perhaps it’s because honest people, including IPCC officials, have admitted that the “climate emergency” is just an excuse to redistribute global wealth.

Regarding heat, very hot days in the US (over 100°F, or 38°C) were much higher in the 1930s than at any other time in the last 125 years.


There’s no sign of the “50 million climate refugees by 2010” confidently predicted by the United Nations in 2005 (click to enlarge).

Coral atolls are not sinking below the seas, in fact many are increasing in size.

And the Great Barrier Reef, which has been claimed over and over to be a victim of coral bleaching, actually has more coral cover than at any time since records have been kept in 1985.

Strong tornadoes in the US are steadily decreasing over the last 72 years.

And the same is true of weaker tornadoes … decreasing.

There’s no sign of the fabled “Sixth Wave Of Extinctions”.

Climate models have routinely predicted far greater warming than has actually occurred.

This should not surprise anyone—the intractability of climate predictions has long been recognized even by the IPCC, viz:
“In sum, a strategy must recognise what is possible. In climate research and modelling, we should recognise that we are dealing with a coupled non-linear chaotic system, and therefore that the long-term prediction of future climate states is not possible”
IPCC Third Assessment Report, The Scientific Basis 14 2 2 2, p.774
Next, all of the weather risks dramatically foretold by climate alarmists have been with us forever—flood, fire, famine, drought, heat waves, hurricanes, tornadoes, all are as ancient as the hills. We are protected from the vagaries of weather by one thing—wealth. It is the poorest of the world who are most at risk from flood, fire, and famine. When I was born, about three-quarters of the world lived on less than $1.90 per day. Now, it is less than 10% of the world living in those conditions.

This increase in wealth has been driven and fueled by one thing … energy, mostly in the form of fossil fuels.

So if we wish to keep insulating people from the age-old destructive effects of weather, we need to maintain and increase the amount of cheap energy available, especially to the poor. If you insist on fighting the imaginary climate menace, at least have the kindness and the human decency not to do it on the backs of the poor by increasing energy costs, whether by “carbon taxes” or in any other way. I discuss this most important issue in my post “We Have Met The 1%, And He Is Us.”
How about the dreaded heat waves that are supposed to be an inevitable result of “global warming”? If you need something to worry about, that’s not it … the real danger is not heat, it’s cold.


And here’s the UK Government’s assessment of the effect of more warmer days and fewer cold days … in twenty years, the warming has saved over half a million lives.

Here’s another analysis of heat vs. cold … it says that global warming is saving 160,000 lives per year through fewer cold deaths.

But if you want to worry about heat waves, please get back to me when the heat waves are worse than those of the 1930s, well before the large increase in CO2 …

Here’s another view of the temperatures of US summers. Again, nothing unusual going on.

Finally, here’s a very long-term view of heat versus cold … it hasn’t been this cold in 225 million years.

Next, here is the radical change in downwelling radiation at the surface from the increase in CO2 that is supposed to be driving the “CLIMATE EMERGENCY!!!” What I’ve shown is the change that in theory would have occurred from the changes in CO2 from 1750 to the present, and the change that in theory will occur in the future when CO2 increases from its present value to twice the 1750 value. This is using the generally accepted (although not rigorously derived) claim that the downwelling radiation change from a doubling of CO2 is 3.7 watts per square metre (W/m2). The purpose is to show how small these CO2-caused changes are compared to total downwelling radiation.

The changes in downwelling radiation from the increase in CO2 are trivially small, lost in the noise …
Finally, an “emergency” is defined in the dictionary as “a serious, unexpected, and often dangerous situation requiring immediate action.” Alarmists have been warning us over and over about the purported impending “emergency” for 50 years, so it is hardly “unexpected”. None of their endless predictions of imminent tragedy have come true, and despite decades of warning, no significant “immediate action” has been taken … so by definition, it can’t be an emergency.

Let me close with this most excellent overview of deaths from every kind of natural disasters, from Our World In Data. We are indeed living in the best of times.

For five decades, we’ve been told every year that we only have five, ten, or twenty years before disaster … I mean, seriously, how can people still believe these serially failed doomcasters?

Let me close this section with a scientific study of this exact question, whether there has been a significant increase in extreme weather events. The study is titled “A critical assessment of extreme events trends in times of global warming“, and the conclusion says:
In conclusion on the basis of observational data, the climate crisis that, according to many sources, we are experiencing today, is not evident yet.

Can’t say it any clearer than that. And the IPCC itself agrees. Here’s what the UN Office Of Disaster Risk Reduction has to say:

“Overall, the number of disaster events per year and the distribution of disaster sub-groups has remained relatively stable between the year 2000 and 2019, with an average of 367 recorded events per year (Figure 5)“
And the IPCC AR6 agrees. Here, shown as white squares, are the areas of the weather where the IPCC says there is no “global-warming” related significant anthropogenic change in frequency or strength.

Let’s be clear about this. The following are the areas where the IPCC itself, in the graphic above, says there is no scientific evidence for a “global warming” signal:
- Air Pollution Weather (temperature inversions)
- Aridity
- Avalanche (snow)
- Average rain
- Average Wind Speed
- Coastal Flood
- Drought Affecting Crops (agricultural drought)
- Drought From Lack Of Rain (hydrological drought)
- Erosion of Coastlines
- Fire Weather (hot and windy)
- Flooding From Heavy Rain (pluvial floods)
- Frost
- Hail
- Heavy Rain
- Heavy Snowfall and Ice Storms
- Landslides
- Marine Heatwaves
- Ocean Alkalinity
- Radiation at the Earth’s Surface
- River/Lake Floods
- Sand and Dust Storms
- Sea Level
- Severe Wind Storms
- Snow, Glacier, and Ice Sheets
- Tropical Cyclones
So when folks claim things like “We’re already seeing the effects of global warming in storms/cyclones/floods/fire weather/sea level/etc.”, feel free to tell them that the IPCC and reality itself beg to disagree. For example, here are local storm reports from the US, showing the recent decade with below average hail, tornadoes, and wind in US storms.

[UPDATE AUGUST 2023—You can clearly see above that the IPCC itself agrees wholeheartedly with the paper “A critical assessment of extreme events trends in times of global warming” discussed above. Both the paper and the IPCC Table 12.2 above say that to date, there is very little sign of any change in almost all measures of extreme events.
Despite that, the usual alarmist “scientists”, including the serial liar Michael Mann, have intimidated the publisher of the paper into withdrawing the paper. I cannot find any report of anything that they found to be false. They just claimed unspecified problems with “the selection of the data, the analysis and the resulting conclusions” … yeah, right. There’s an excellent discussion of the issues here.
Climate cowards. But the good news is, you know they are running scared when they have to illicitly prevent the publication of ideas that might do significant damage to their endless climate money train … ]
And before we spend trillions of dollars on an unachievable plan to totally redo the entire global energy supply, how about we wait until someone can actually let us in on the big secret—just where is this mysterious “CLIMATE EMERGENCY!!!”, and when did it start? What exactly is it that people are hyperventilating about? What are people afraid of, specifically? Just where is the “existential threat” folks rave about … or even a serious threat?
My very best wishes to all, and take a deep breath—there’s no impending Thermageddon™ just around the corner.
w.
MY USUAL REQUEST: When you comment, please quote the exact words you are discussing. This will avoid much of the misunderstanding that plagues the intarwebs.
Just this last week the MSM have been bombarding us with climate crisis nonsense and, as CNN recently confirmed to a Project Veritas hidden recorder, they intend to ramp it up for a long time to come, actual science be damned.
Thanks Willis, but you are just preaching to the choir again.
The 99.9% who don’t/won’t consider real science, have bought into green hysteria out of fear. “I don’t want to leave an environment in ruin to my grand kids” is a common rationalization. What they don’t seem to understand is the enormous down-side to things they are blindly accepting such as draconian emission regulations, the farce of renewables, and the hypocrisy of electric vehicles.
Climate change fear is the greatest marketing success of all time. To even have a remote chance of countering this, the skeptical side need to fight fire with fire and create its own fear campaign. Call it something like ‘Apocalypse Prosperity’ and zero in on negative green-driven outcomes like: energy poverty, multi-generational debt, restrictions to individual freedoms, onerous taxation, runaway bureaucracy, blackouts and grid instability, etc.
An interdisciplinary team could be put together jointly through organizations like Heartland, Breakthrough, Prager, Copenhagen Consensus and the like. It would require Madison Ave. quality of production and multi-media roll-out; even TV might be interested if the message was alarming enough. It would cost a lot and, of course, the greens would attack any corporate sponsorship. However, if it was honest, scientific and rational, the public would filter out the eco-shrill and allow the underlying message of fear to sink in.
WUWT and it’s ilk are great, but the battle is being lost while a small cohort of subscribers nod their heads and offer witty comments. Only fear will get the message out to the masses.
It is only preaching to the choir if it stops here
We all have acquaintances who would benefit from, or even change their mind about the media drivel they have absorbed, as a result of reading Willis’s rant-a-thon in this article. I’m going to send it to most of them. I liked it so much I donated $100 to WUWT right after I read it.
”Only fear will get the message out to the masses.”
There will be plenty of fear when the electricity prices go up and the reliability goes down and when China starts overtaking the rest of the world due to cheap reliable power – which leads to….power.
Pseudo-realities.
A lovely coincidence I found this morning:
https://newdiscourses.com/2020/12/psychopathy-origins-totalitarianism/
This essay lays out a fairly thorough basis for all the nonsense we have been subjected to. All the climate stuff lays right alongside every other scam we have to endure.
Nice find. The thesis in a nutshell: Big Lies like climate alarmism are an existential threat to civilization. Those who accept the lies become psychopaths. False realities and utopian dreams are the tools of cults and the breeding ground of totalitarianism. This is the way civilizations self-destruct.
Once again, since climate is defined as 30 years of weather in a given area, there can be no climate emergency without a previous 30 year period of weather emergencies.
Any other definition is BS. Those that claim otherwise are lying to you.
As usual a terrific contribution! Willis, you ask ‘what is the emergency?’. As you demonstrate, it’s down to none of the usual suspects. However climate skeptics are disingenuous about what I call the elephant in the room and its effect on human psychology. Whatever anyone reports about any aspect of the climate, people responding to the climate alarmists are aware that month by month, year by year, the atmospheric carbon dioxide levels are rising relentlessly, unperturbed even by the massive lock down.
The issue which I believe trumps every single statistic showing ‘no emergency’ is the graph from Mauna Loa. You can forget rebutting the scare stories about sea levels, hurricanes, arctic melts and polar bears. John and Jane Doe say “OK, no problem there but what about the ever-increasing CO2? You have nothing to say about that. We accept there are no bad effects so far and Earth is going green but what of the future? Are we expecting the level to rise for ever? What happens when it’s 800 ppm for instance?. What’s our physiology and biochemistry at that level? What about the other life forms on this planet? Maybe nothing deleterious but let’s face it, we simply don’t know what happens to us when we breathe those much higher levels of CO2 over a life time”.
There is zero discussion relating to this fundamental issue and that must change. Skeptics should get on the bus.
Well, we know that 800ppm is still low for optimum plant growth, double that to 1600 seems the sweet spot.
800-1000-1600 has no negative or poisonous effects on humans, they spend long hours in greenhouses and submarines at higher levels.
All the debate is what it might do with temps, I’m in “violent agreement’ that it will be some but small.
In my opinion
Miha, there are two completely different answers to your ‘ignored elephant’ that Mauna Loa shows CO2 is continuously rising while 12C/13C ratios show the rise is anthropogenic.
First answer is, we know anything up to about 1000 ppm is beneficial to plants, while anything less than about 4000 ppm is harmless to humans. And with true ECS about 1.6-1.7, nothing temperature wise to worry about in this century presuming a doubling.
Second answer is, all the supposed future harms are based either on provably faulty models or provably faulty ‘science’. In the first category are, for example, the non-existant modeled tropical troposphere hotspot and (not) accelerating future sea level rise. In the second category are, for example, polar bears and corals.
CO2 regularly climbs to over 1500ppm in a normal bedroom situation.
People experience 800ppm or more for a significant part of their life, especially if working indoors.
Hold your breath for a minute to experience very high levels of CO2
We need to get to at least 1200ppm before this interglacial ends. Feeding 10B+ people with compromised central Asian and North American breadbaskets will be difficult and we will need every advantage. That should be the sense of urgency – the one thing about climate that we know is that this interglacial cradle will end.
Willis, there are lots of charts in the AMS state of the climate report here:
10.1175_2020BAMSStateoftheClimate.2.pdf. Many variables are covered; you’ll probably have some fun with it.
So I took this and picked a fight on Linked in.
Will take my lumps.
My basic premise in this is overreach, that is what is at the base.
The religious don’t truly have faith otherwise they could just rely on data to prove their hypothesis.
Because they don’t have faith they have to change the facts with adjustments and hockey sticks to try and prove this really is something new, and then create models to inflate the worst case scenarios into the future.
All the ludicrous crap we see here constantly devolves to lack of faith.
Well, the big Science Channel special on Climate Change, “Action Planet, Meeting the Climate Challenge” was pure political propaganda. I think they managed to get every leftwing social narrative included in the show. Even Kamala Harris made an appearance without wearing a mask.
All our Societal Institutions have been corrupted by the Left.
They need to read this article by Willis, and then maybe they would calm down. I won’t hold my breath waiting for them to do either one, though.
Willis, but you really have to avoid using the propaganda driven terms in this otherwise excellent summary. There are no “Climate related” deaths at all; what you’re talking about here is “WEATHER related” deaths. Using “climate related” just lends credence to the stupid notion that “bad” weather is a “result” of “climate change,” which is utter nonsense – as, ironically, your “summary” shows.
PLEASE – weather related catastrophes, NOT “climate related;” there is NO such thing.
A chart showing the strong downward trend in Canadian forest fires since 1980, even though our Prime Minister claims our forests are burning because of climate change.
Canadian Wildland Fire Information System | Canadian National Fire Database (CNFDB) (nrcan.gc.ca)
<i>Climate models have routinely predicted far greater warming than has actually occurred.</i>
With graph from Roy Spencer. Did you think to check what he is actually plotting? I will help you out. While the model’ series is labelled sea surface temperatures, it is not. It is actually TAS, which is the 2m air temperature. Roy is comparing observed SST with modelled air temperatures. He was called out on this by Nick Stokes here at WUWT and responded
‘ 2m air temperature changes are extremely tightly coupled to SST changes. Their variations can be considered to be quantitatively the same for trends over the global average oceans’
(So why not label your graph honestly?) But Stokes went and dug out the data and found they are not the same Over the period TAS increases by about 1.1°C, SST by about 0.8°C. Just a 37% difference there.
So a dishonestly labelled graph comparing two disparate quantities used to ‘prove’ models are inaccurate. Situation Normal for WUWT.
Simple mistake, pulling a graph from a recent post, should instead reference the one McKittrick provided last year?
Here is a question for you.
Can you tell the difference between 1.1 and 0.8 deg C?
37% is simply what CAGW adherents want to use to make it seem like the globe is on fire. Anomalies are part of the propaganda machine. If the process was done correctly, you would be able to convert those numbers directly to an absolute temperature at any given temporal period, like a day, a month, etc.
Thanks, John. First, please dial back on the aggro. Calling a graph “dishonestly labeled” rather than “incorrectly labeled” makes YOU look dishonest, not Dr. Roy. Like me, he tells the truth as best he knows it at the time.
Second, I just added this response to Nick’s comment on that post, which I had not followed at the time:
===
Nick, I just went to KNMI and got the data. You find a much greater difference than actually exists. This is because you are using data from 90°N to 90°S, and Dr. Roy is using data from 60°N to 60°S.
The actual divergence between air and sea temperature over the period is only 0.09°C, not 0.3°C as you claim … in other words, it’s a difference that makes very little difference.
Best regards, and thanks for going to the source and running the numbers yourself. That’s doing the homework, and it is how science progresses.
w.
===
Net result? Nick did his homework, and he made an honest mistake. You didn’t bother to do your homework, and YOU ended up pushing fake news.
Next time you think you’ve found a mistake, how about you just report it as a mistake that you haven’t bothered to check, and leave your nasty snark out of it? Or is this “Situation Normal for John Phillips”?
w.
Sorry, but that just makes it worse. Dr Spencer has cherry-picked an area that suits his thesis, and labelled it global when it is not and labelled air temperatures as sea temperatures. The global data has the flaw identified, the graph is misleading and should be updated, if one cares about accuracy.
Also, read Nick’s reply, if you compare the modelled global sea temperatures, rather than pretending air temperature is sea temperature, the models are doing a good job, contrary to your assertion. Homework? IPCC AR5 Figure 11.25a is their model/observation comparison and Ed Hawkins periodically updates it at <a href=”http://www.climate-lab-book.ac.uk/files/2021/01/fig-nearterm_all_UPDATE_2020-panela.png”>Climate Lab</a>. Bottom line: the models are doing an OK job.
The rest of the post is similarly carefully cherry-picked metrics, life is too short to provide counter-examples to all, but here are a few:
Hurricane activity has increased, even though the data is too noisy to be sure of a significant trend.
• “According to the total annual ACE Index, cyclone intensity has risen noticeably over the past 20 years, and six of the 10 most active years since 1950 have occurred since the mid-1990s (see Figure 2). Relatively high levels of cyclone activity were also seen during the 1950s and 1960s.
• The PDI (see Figure 3) shows fluctuating cyclone intensity for most of the mid- to late 20th century, followed by a noticeable increase since 1995 (similar to the ACE Index). These trends are shown with associated variations in sea surface temperature in the tropical North Atlantic for comparison
EPA.
The Active Fires Index is a truly bizarre metric to plot, globally the trend in burning season length is strongly positive as is the trend in the US total area burned.
“According to data from the NIFC, there has been a clear trend in increased area burned by wildfires in the US since the 1980s, when reliable US-wide estimates based on fire situation reports from federal and state agencies became available.
Today, wildfires are burning more than twice the area than in the 1980s and 1990s. These figures include all wildland fires in both forested and non-forested areas. Most of the area burned today is in the western US, where dryer conditions tend to allow for large, quickly-spreading wildfires.”
Homework: A 30 second Google was sufficient to discover that the claim about sea level rise being an artifact of a change in satellite has been debunked at Climate Feedback.
“Factually Inaccurate: Quantitative analysis of global data clearly demonstrates that sea level rise has accelerated.
Misrepresents a complex reality: This claim focuses primarily on individual tide gauge stations rather than a global compilation while failing to account for causes of regional variation.”
Oh, and global hunger has been increasing since 2014, the causes are complex and many, but climate change is surely in there.
TTFN
Sources:
https://climatefeedback.org/claimreview/global-data-contradict-claim-of-no-acceleration-in-sea-level-rise/
https://www.epa.gov/climate-indicators/climate-change-indicators-tropical-cyclone-activity#3
https://www.carbonbrief.org/factcheck-how-global-warming-has-increased-us-wildfires
https://www.nifc.gov/fire-information/statistics/wildfires
I notice after reading all the comments posted up to this time that not a single believer that normally posts here has attempted to refute the main body of evidence to answer the question you and so many other have asked. Where Is The “Climate Emergency”?Crickets! But Phillip thought he could nibble on the edge a bit to perhaps discredit you.
If the major part of the media were anything but propogandists and cheerleaders for the left, that question would have been posed many times over in many forms to those in positions of authority or who declare to have special knowledge that declare there is such a crisis or emergency.
Oh, I also took the time to point out that hurricane activity IS increasing, that wildfires ARE getting more damaging, and the sea level aceleration claim has been debunked. Seems to have been disappeared or stuck in moderation.
Pretty sure one could find similar counter-examples for most or all of the points, given a little time.
Provide links then, and debate.
Well, firstly personally I steer clear of loaded phrases such as Emergency or Catastrophic as they require a value judgement.
However The EPA says there is a trend in ACE and PDI, although the variance is high and significance low…
https://www.epa.gov/climate-indicators/climate-change-indicators-tropical-cyclone-activity#3
Last year a paper in PNAS found that storms are getting stronger in general, and major tropical cyclones are coming more often, as predicted by the models.
https://www.pnas.org/content/117/22/11975
You were saying?
Data up to 2015, North Atlantic only. Follow the EPA link shown and you will find they are saying globally ACE is increasing.
Thanks, John. I looked at your site. There is NO statistically significant increase in the North Atlantic data shown. And although they say something about the “total annual ACE index”, it’s not clear if this is a global index or just a total index for all of the Atlantic … and there’s no link to the data. I can’t find any global ACE data.
However, I found individual datasets for the Atlantic, NE Pacific, and NW Pacific. So I downloaded them, added them, took a look, and guess what?
Still NO statistically significant increase … yes, there’s an increase, but it is not statistically significant.
And even with a slight but not significant increase in hurricane frequency, so what? Like all natural phenomena, it goes up and down.
Sorry … still not seeing the “climate emergency”.
w.
As I think I wrote upthread I have never used the phrase ‘Climate Emergency’. Addressing it is, in my view, a pretty lame Straw Man argument. Similar to the Catastrophic AGW meme. As William Connolley pointed out
There is, right now, no global climate emergency, however the wildfires in California, Australia and Siberia surely count as local emergencies and were made more likely by raised temperatures and prolonged dry spells, in turn attributable to climate change.
Heat waves would be another example, Atlantic hurricanes another and there are many more. It is entirely possible that we have no global emergency now, but we are heading towards one if we do not act. The sea level acceleration, denied in the post, is real and unchecked will likely lead to a sea level rise of at least 65cm by 2100. 50cm would be enough for the Maldives to lose 80% of its land area, to quote another example from this thread.
Specifically on the ACE data, it is only one metric, arguably flawed, it has high variance and so significant trends take time to emerge. There are also issues with changing observation methods. This paper looked at 4 decades of satellite observations, addressed the methological issues and found the severity and frequency of tropical cyclones is increasing in line with model projections. The 2020 Atlantic Hurricane season had a record-breaking 30 named and 12 landfalling storms in the continental US. Hard to reconcile with ‘no increase in storminess’.
If you wanted to convince outside of the safe space of WUWT, you would need to lose the debunked SLR acceleration nonsense, update or better still drop the doubly-misleading Roy Spencer graph, refrain from cherry-picking and remove unsupported blog science claims. Until then …..
”There is, right now, no global climate emergency, however the wildfires in……….. Australia ……… surely count as local emergencies and were made more likely by raised temperatures and prolonged dry spells, in turn attributable to climate change.”
Nonsense. The very slight long term drying in SOME of the fire areas over the last hundred years – if you want to attribute them to ”climate change” – has been calculated as having about 3% (if that!) of the overall factors governing the fire intensities. The remainder being a huge build up of fuel, local drought (which has not and cannot be attributed to ”climate change” and a strongly positive IOD which again has not been attributed to ”climate change. What caused the fires was a combination of natural weather extremes and fuel.
My post, with sources, has now magically escaped moderation.
Regarding your moderation complaint, keep in mind that there are “trigger words” that automatically put things into moderation. Nothing nefarious going on.
John, ALL comments on WUWT are moderated. And because it has worldwide reach, WUWT has moderators all over the planet. They are all volunteers, and they have their own lives. So sometimes, comments take a while to get approved.
In addition, posts with lots of links get extra attention to make sure someone isn’t trying to slip in some link to ugliness.
Look, you got fooled badly by Nick Stokes and used that as a bogus reason to get all snarky about WUWT. Now you’re all butthurt because your post took a little time and then got published.
If it were up to me, I’d ban you for being such an arrogant, unpleasant jerkwagon … but it’s not up to me, I’m just a guest author. And truth be known, I probably wouldn’t ban you for that … but I’d be sorely tempted.
However, let me invite you to get a grip and stop ruining your reputation. You seem like a smart guy, but you are destroying your own credibility at a rate of knots via your ugliness …
w.
Look, you got fooled badly by Nick Stokes
No, I did not. You, on the other hand have yet to address his central point :
The trend of HADSST3 was 0.139C/dec, and the corresponding TOS was 0.15C/dec. Pretty close. Maybe CMIP6 is radically different, but that would be surprising.
In short, Dr Roy posted a graph labelled as comparing global observed SST with SST as modelled in CMIP6. However it was actually observed SST against modelled air temperatures (TAS) and 60N-60S rather than global. The modelled sea surface temperatures (TOS) are not yet available in KNMI for CMIP6. Dr Roy attempted the defence that SST and air temperatures are ‘closely coupled’, which is not the case for the global dataset. Nick points out that in CMIP5, which does has TOS, an apples-to-apples to comparison shows no significant discrepency.
In other words the claim ‘Climate models have routinely predicted far greater warming than has actually occurred.’ is unsupported and
0
All you have to do is point to ONE single “climate emergency” with the scientific proof it exists and the effects on the planet or humans that make it an emergency! Where and what is the “climate emergency?”
This is supposed to be global and though Atlantic Hurricane ACE was up last year the global ACE was well below average and the NW Pacific basin ACE where historically the strongest storms form was the 2nd lowest on record!
As for wild fires Willis provided global NOAA data. What was your source and was it global?
Willis linked to a plot of NASA Active Fire Index. A bizarre choice, one which he got from a blog and without the basic information needed to reproduce it. He also showed us a graph of Canada, while faling to mention that area burned in the US has doubled since the 1980s.
My sources are all stated.
I got it from a blog, and contrary to your BS, the blog provides both the source and the code to reproduce it.
I’ll await your apology.
w.
The code is meaningless without comments or documentation. It seems to be extracting the 8-day data. Why? What would change if you used alternate time periods? What is the data actually showing? Pixels?, Fires? Area Burned ? What?
Y’know. Science.
Well, quite. The code tells me the data is from https://neo.sci.gsfc.nasa.gov/view.php?datasetId=MOD14A1_E_FIRE Which seems to be NASA active fire data over an 8 day interval. You seem keen on the graph so help me out. What exactly is being plotted? Number of fires? Area Burned? Pixels? Gridcells? What happens if I plot other periods?
I think you just lazily reproduced the graph because it has a negative slope without doing a scrap of due diligence.
Prove me wrong.
As for SLR every single one of the 1000+ Maldive islands are still above water and the 200,000+ residents have drinking water while China and India compete to see who can invest more there. NONE of the disasters predicted for those islands predicted have come to pass and they are ALL now well beyond their expiration dates.
Who predicted they would be submerged by now and when?
The point about SLR is that the claim posted above that the acceleration is an artifact of switching satellites has been analysed and found to be ‘disastrously wrong’.
You’d kinda think that would be worth a mention?
The SLR change is identical to Mann’s hockey stick, splicing information from different sources and pretending they represent contiguous data.
Everything i have read, the tide gages that have been in existence for centuries show no acceleration, just steady as it goes.
Another posted on here put up a link to canadian government fire data, decreasing here too?
Is that wrong as well?
The bigger point is that if there is such a crisis/emergency, why is there such ambiguity in the actual data?
If you or others want to claim future “emergency” based on model outputs, you can defend that.
But that is not what is happening. All the rhetoric is EMERGENCY HAPPENING NOW OMG OMG OMG, everyone light your hair on fire and stampede into bad decisions.
There is no emergency today, nor can you show one
That is what this is all about.
Everything i have read, the tide gages that have been in existence for centuries show no acceleration, just steady as it goes.
Try reading this.
https://climatefeedback.org/claimreview/global-data-contradict-claim-of-no-acceleration-in-sea-level-rise/
John, if you are unaware of the endless drumbeat about “submerged atolls”, you’re not paying attention.
And as to their “analysis” of my claim, it’s a Facebook “fact check” that is a joke. For example, they do a lot of handwaving like this:
In the trade, that’s called “handwaving”, making flat claims without a single scrap of evidence to back them up. I showed clearly the problem with the satellite data, and there’s no amount of unspecified “rigorous analysis” that can put enough lipstick on that pig.
As my article shows, they didn’t do any “rigorous analysis”. Their data is the same as my data, but they just spliced them together and omitted the inconvenient overlaps to hide the problem. But because some Really Pompous Scientist™ claimed it was fixed … John believed it. Just like John believed Nick Stokes’ mistake regarding Dr. Roy Spencer’s work. Because John doesn’t actually do the hard yards and run the numbers himself. He just believes what fits his worldview.
It also says:
Here, they not only don’t provide any evidence. They don’t even bother to claim that it exists. Instead, they say a “proper analysis” that “measures acceleration with an actual calculation” WOULD show acceleration … OK, here’s a “proper analysis” with actual calculations that I did a while ago but haven’t published. It shows the actual calculation of the acceleration in the Church and White sea level record, the accepted global data. Note that everything below the zero line is deceleration.
You tell me a) is there overall acceleration, and b) if you think there is, does it constitute an “emergency”?
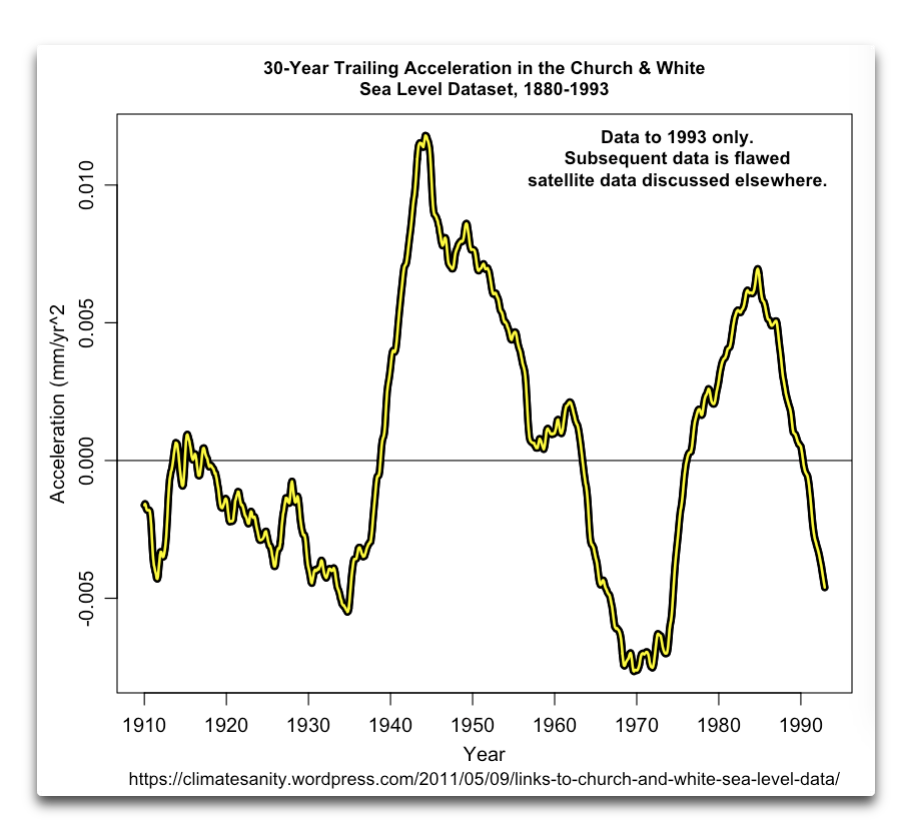
I probably should write this up as an actual post to keep the childishly credulous from thinking that the Reall Pompous Scientist™ is doing anything but handwaving to protect his cherished beliefs … but hey, so many drummers, so little time …
w.
PS—For further detail on this see my posts “Munging the Sea Level Data“, “Inside the Acceleration Factory” and “Accelerating the Acceleration“
You can prove just about anything if you are willing to discard data that you don’t like. You’re unlikely to convince anyone outside your bubble, though.
https://www.pnas.org/content/115/9/2022
John, your problem with forest fires in the US is you didn’t go far enough back. This shows the level of fires is not unprecedented.
blob:https://wattsupwiththat.com/8cc0f541-a130-4a3d-a82a-907a9f89b910
https://www.carbonbrief.org/factcheck-how-global-warming-has-increased-us-wildfires
Also
https://www.nifc.gov/fire-information/statistics/wildfires
So, this article points to a plot that shows a global decrease in Active Fire Index. There has indeed been a global decrease in area burned. But, do your homework, as we are told. 70% of wildfires are savannah fires, which have been declining due to changes in rainfall and wind patterns. This is offset by increases in more populated areas such as Western Australia, California and parts of Siberia and Europe. The article shows a graph of declining area burned in Canada, but does not mention the US, which has approximately 10x as many fires, and where acreage burned has doubled since the 1990s.
There’s a phrase for this ….
It was hot in the US in the thirties. I think we knew that.
“Coastal sea-level acceleration is analyzed using all of the world’s high-quality tide gauge recordings with lengths of at least 75 years that extend through 2017–19. Earlier studies have demonstrated that tide gauge recordings of at least 75 years in length are required to reduce the effects of multidecadal variations on acceleration. There are 149 tide gauge records that meet the criteria. Mean and median sea-level accelerations based on these gauges were 0.0128 ± 0.0064 mm/y2 and 0.0126 ± 0.0080 mm/y2, respectively, both at the statistically significant 95% confidence level. The mean acceleration is larger than that of earlier studies that analyzed fewer gauges or considered record lengths shorter than 75 years.”
The acceleration is accelerating….
From <https://meridian.allenpress.com/jcr/article-abstract/37/2/272/450977/Sea-Level-Acceleration-Analysis-of-the-World-s>
John, as I showed above, the sea level regularly accelerates and decelerates. I note that you’ve found exactly nothing (0) wrong with my analysis.
The measurement of acceleration is quite sensitive to the length of the period studied and the exact set of tidal records chosen.
Let me see if I can explain the difficulty of these claims of sea level acceleration by an example. Here’s the record for Brest. Your quote above says “tide gauge recordings of at least 75 years in length are required to reduce the effects of multidecadal variations on acceleration.” So this fits their criteria in spades, 212 years start to finish.

Now, is there acceleration in that record? Absolutely. It hardly rose for the first hundred years of record, then started rising. And that’s confirmed by the math:
However, what about the last 120 years of the Brest record, the time since 1900? That’s still way longer than their 75-year limit. Is there acceleration over that century+ period? Visually, looks like no, and that’s also confirmed by the math.
This has a p-value of 0.3156, far from significant.
So is there acceleration in the Brest dataset? Yes … and no. For our purposes, seeing whether CO2 –> sea level acceleration, I’d say no … but someone looking to claim “SEA LEVEL IS ACCELERATING, WE’RE ALL GONNA DROWN” can honestly say yes, the Brest data shows acceleration.
In addition, your claim that “acceleration is accelerating” simply because a later study found greater acceleration than “earlier studies” is a misunderstanding of what was found. They used different records and different criteria, doesn’t mean a change in acceleration over time.
Finally, your study is paywalled, so I can’t tell if they’ve done things like adjusted for autocorrelation. However, given that the effective N for the whole Brest dataset is only 5, and the effective N for the monthly Brest dataset is only 50, and this is not atypical for tide gauge records … I’d say likely not.
Let me close by suggesting a couple of things.
First, you’d benefit by dialing up the sensitivity of your skeptiseismometer. Scientists these days, particularly climate scientists, often have an axe to grind. And peer-review is worthless in terms of actually taking a hard look at methods.
Second, run the numbers yourself. Don’t trust anyone, no matter their qualifications.
Some years ago I downloaded the entire tide gauge dataset from PSMSL (link on the graph). It’s 1,547 tide gauge records. I usually start out by plotting them up in bunches, like this:
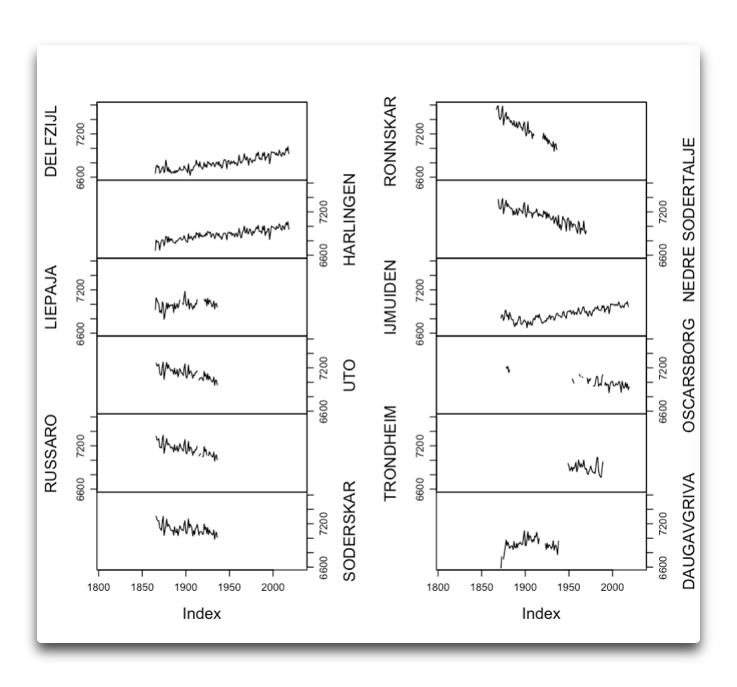
Hmmm …
Then I started to investigate the interesting ones, the long ones, the strange ones. I’ve probably spent a total of maybe eighty or a hundred hours studying just these records. Plus another hour today.
Once you do that, you’ll have an appreciation for the problems and pitfalls in the particular area of interest … and you might be less likely to just grab the first study that seems to agree with your ideas and claim you’re right.
My best regards to you,
w/
I note that you’ve found exactly nothing (0) wrong with my analysis.
You are kidding, right?
The ‘analysis’ deployed zero (0) mathematical tools to detect acceleration, you just displayed a series of graphs from Europe and the US and invited the reader to draw conclusions. You have not replied to the charge from Climate Feedback. Here it is again:
“Only European and US tide-gauge records are shown. Because these tide gauges are relatively close to the places where most of the ice melt that has driven sea-level changes since ~1900, they will see much less sea-level rise from ice melt than the global mean due to gravity and solid-Earth effects. Therefore, without explicitly taking this into account, we cannot say anything about global sea levels based on records in Europe and North America alone. When all available tide-gauge records are combined to compute global sea levels, a clear acceleration in sea level since 1900 is visible.”
Last time I checked, Brest is in Europe. You say that Climate Feedback provide no data to support their rebuttal. You apparently dislike being accused of dishonesty, but this is hardly ‘the truth, the whole truth and nothing but the truth'( as our courtroom oath goes here in the UK) is it? They cited Dangendorf et al. (2019) which is exactly the kind of Tide Gauge analysis you could, and arguably should have done.
I note that your latest move is to redact all post 1993 sea level rise data. Thus demonstrating that if you remove the data that shows acceleration, there is no acceleration. People less kind than my good self might see this as a descent into self-parody. I could not possibly comment.
John Phillips May 3, 2021 5:17 pm
I’d said:
You replied:
You really should try to keep up. Yesterday, in response to folks’ comments, I added calculated sea level acceleration from three global datasets right up to the present. So every single one of your complaints have been overtaken by reality.
Better luck next time,
w.
Excellent reply within an Excellent article, Willis. 🙂
CAGW claims rising CO2 acts as a blanket reducing Earth’s energy loss to space. The simplest most direct test of that would seem to be to look at Earth’s energy loss to space, is it decreasing as CO2 concentration rises? Turns out NASA has been monitoring Earth’s energy loss to space since the start of the satellite era and it has been RISING not FALLING. If the core claim of a theory is shown to be false, indeed the reverse of reality, the theory is disproven. At least it is in normal scientific practice but then we all know that CAGW is anything but normal.
”Turns out NASA has been monitoring Earth’s energy loss to space since the start of the satellite era and it has been RISING not FALLING.”
Do you have a link for that Michael?
No discernible health impact from PM2.5 exposure, either.
(2017) Young, et al., Air quality and acute deaths in California, 2000-2012.
doi: /10.1016/j.yrtph.2017.06.003
Where Is The “Climate Emergency”?
Nowhere but on the useful idiots banners.
“Climate emergency” is an oxymoron. Weather is what gives you emergencies.
Excellent Willis thanks – great resource.
Hans Rosling videos also powerfully debunk Ehrlichian myths of overpopulation, a “west”and a “third world”.
https://youtu.be/hVimVzgtD6w
This Willis E. has been up for six hours, and a short [Ctrl-F] search on Methane comes up 0/0.
Of all the bullshit scams that comprise the whole of “The Climate Crisis”, Methane is so far being successfully regulated. Here’s a sampling of some head lines:
San Francisco Becomes the Latest City to Ban Natural Gas in New Buildings, Citing Climate Effects
Bay Area Cities Go to War Over Gas Stoves in Homes and Restaurants
Following Berkeley’s Natural Gas Ban, More California Cities Look to All-Electric Future
Cow Fart Regulation Passed Into California Law
The Climate Connection: Moving away from natural gas
This is going on now, it’s not some, “Oh they’re gonna do this or do that,” it’s already happening, and it probably won’t stop. The freedom to have a gas stove, furnace, water heater, clothes dryer, grill, fireplace, etc. or even a natural gas powered car is being taken away from various population centers around the country and as far as I can tell, people are sitting still for it, and it probably won’t stop.
Where I live, Delta BC Canada, they just overturned a bylaw prohibiting outside gas burners … now legal. Small step forward.
Excellent post Willis and VERY powerful !!!!!
I booked marked it and moved it to the top position in my favorites tab.
I am going to make up ‘business cards’ with the link to pass out to those I don’t care to argue with and to assist those less informed with the knowledge that I have gained here @ur momisugly WUWT over the past 12 – 13 years! I have read just about every comment on every post here. With an engineering/physics background as well as common sense it takes a lot to convince me as I don’t want to file ‘garbage’ away in my limited brain capacity! Anyway, I’m convinced CAGW is a load of horseshit!
Willis,
On one of your earlier posts, a commentator directed us to extinctionclock.org, a useful collection of many of the apocalyptic predictions since 1970.
The predictions whose relevant date has passed have one thing in common.
They have a 100% fail rate!
Then there is “The List” at John Bignell’s numberwatch.co.uk where some 700 issues caused by global warming are set out, ranging from acne to zoonotic diseases.
As Will Rogers said, “We are only here for a spell,get all the good laughs you can.”
Willis, have you done any analysis on the Marshall Islands> They gave the chief from there a front row seat for his speech.
You are missing the point. It is Mother Gaia that is at risk. Because of heat stroke she has suffered severe mental damage. In her confusion she no longer knows how to take care of herself. For sucking the life blood of the Mother, we have been cursed with a large population increase. Thus our virtue is in mortal danger. A great many sacrificing penitents are necessary. Also, a great many holy practitioners. It is as it has always been: only the priests can save us. The priests must be kept comfortable and satisfied so they can concentrate on appeasing the evil spirits that now plague us.
Willis,
One commentator has questioned whether there has been any public debate on the cumulative nature of the issues you raise here.
On 14 March 2007 there was the famous debate on “That Climate Change is not a Crisis” with teams of three for and against led by Richard Lindzen and Gavin Schmidt respectively.
The debate was won conclusively by Lindzen, the late Michael Crichton and Philip Stott for the sceptics.
Readers will easily find the link at Intelligence Squared website.
Actually the debate topic was “ That Global Warming is not a crisis”.
In March 2007 people were mainly discussing global warming not climate change.
Please note: The The Intergovernmental Panel on Climate Change STARTS with the assumption that there is “human-induced climate change”. It’s role is not to investigate whether there is any “human-induced climate change”, it’s role is simply to assess the risk and extent of such change.
No curiosity allowed about this basic premise.
PRINCIPLES GOVERNING IPCC WORK
Approved at the Fourteenth Session (Vienna, 1-3 October 1998)…
The role of the IPCC is to assess on a comprehensive, objective, open and transparent basis the scientific, technical and socio-economic information relevant to understanding the scientific basis of risk of human-induced climate change, its potential impacts and options for adaptation and mitigation…
https://archive.ipcc.ch/pdf/ipcc-principles/ipcc-principles.pdf
So, if hired to find left-handed monkey wrenches, I , in order to feed my children, will find (at least glimmers of) left-handed monkey wrenches.
Jack
It is fear porn, Mr. E…from Aardvark to Zebra.
Plain and simple.
That the alarmists have stolen the issue from anything resembling actual science, and from anyone resembling an actual scientist, while the climate scientists themselves mostly say absolutely nothing to contradict this jackassery, is a black eye on the entire profession.
Anyone with a hint of integrity or a splinter of a backbone has to speak up and call it out for what it is.
History is watching, and will not be kind to people who deceive humanity itself for profit or for political gain.
Vast mountains of money are being squandered for no good reason whatsoever, and the real tragedy is, these amounts could go a very long way towards ending many of the actual problems faced by humanity.
I propose the concept of “Climate Logic”. It is different than normal logic.
An emergency is a situation where you do not notice anything, but you know that the catastrophe will happen. The reason that you know that, is that a 50 parameter computer model of a chaotic system has a tendency to output scary numbers.
Another important characteristic of “Climate Logic” is that a climate expert is always right, even if he/she has been systematically wrong in everything over the last 20 years.
The most prominent feature is that it is undeniable. Not at all clear why it is undeniable. It just is.
“Climate Logic” has some similarities with “Fuzzy Logic”, but there are differences.
In “climate logic” it is fully accepted to adjust data so they fit with theory.
In “climate logic” you can see warning signs in every weather event. The sign could be anything. This branch of “Climate Logic” is also called “Climate Science”.