By Christopher Monckton of Brenchley
Though the daily rate of growth in cumulative Chinese-virus cases continues to fall, the daily rate of growth in cumulative deaths seems to have reached a plateau. Unfortunately, in the world as a whole deaths are still increasing at 6% per day, compound. If that rate were to persist, deaths from the virus would double in just 12 days.
In the United States, the growth rate in deaths is 10.3% compound per day: in Canada, 12.9%. If those rates were to persist, deaths in these countries would double in six or seven days. In Britain, where the daily death-growth rate is 7.2%, make that ten days. That is why attempts to compare the present cumulative deaths with a typical flu season are misconceived. Deaths from the Chinese virus are still rising far too fast for comfort.
Which is why Mr Trump’s tweets telling Democrat governors of states maintaining lockdowns may yet prove inappropriate. The President is in a difficult corner: he wants to restart the economy, because the cost of lockdowns is prodigious, but, like Mr Johnson in London, he is vulnerable to the charge that he did too little too late. Because the spread of a new infection is always near-perfectly exponential, there is a premium on acting very early, as South Korea and Taiwan did, and as Messrs. Trump and Johnson did not.
Unfortunately, there are still too many unknown unknowns to assist governments in taking sound decisions, which is why most of them have, in the end, opted for caution, though it comes at a heavy economic cost.

Fig. 1. Mean compound daily growth rates in cumulative confirmed cases of COVID-19 for the world excluding China (red) and for several individual nations averaged over the successive seven-day periods ending on all dates from March 28 to April 17, 2020.

Fig. 2. Mean compound daily growth rates in cumulative COVID-19 deaths for the world excluding China (red) and for several individual nations averaged over the successive seven-day periods ending on all dates from April 4 to April 17, 2020.
Sweden, for instance, has been the poster-child for doing without lockdowns. At first, this was a strategy that seemed to be working well. Indeed, as our graphs here show, Sweden – the bright blue line – has case-growth and death-growth rates only a little above the global mean, and it has achieved those rates without lockdown.
However, Sweden’s 1400 cumulative deaths are more than twice the combined totals in Finland, Norway and Denmark (which is by far the most populous country in Scandinavia), and the infection has spread to several retirement homes because the Public Health Agency had not ensured that staff had, and wore, masks, gloves and gowns to protect patients. We do not yet know, therefore, whether no-lockdown strategies work even in countries which, like Sweden, have high social cohesion and low population density.
To try to find out whether Sweden’s strategy of not locking down the country is likely to work, Dr Björn Olsen, Professor of infectious medicine at Uppsala University, recently asked the Swedish Public Health Agency for access to the data on the basis of which it opted against lockdown. He has had no reply. Some 22 experts recently put their names to a very critical op-ed in the Dagens Nyheter, calling for a reappraisal of the policy.
Perhaps the most important question to which we do not yet have an answer is whether those who have recovered the infection are or will remain immune. The World Health Organization (admittedly the least reliable source of information on this infection) now says that immunity among those who have recovered cannot be taken for granted. If that is true, then antibody testing will be a lot less useful than it might have been.
Nor do we know when a vaccine may be found. But let us end with some good news. Researchers at Oxford University are so confident that they have found a workable vaccine that they are producing a million shots even before it has been subjected to clinical trial or approved. They are taking the risk, because they think they have the answer. Let us pray that their confidence is justified.
Link to full resolution images
The UK’s Covid-19 today’s (Saturday) update:
http://www.vukcevic.co.uk/UK-COVID-19.htm
According to those figures the “Hospitalised Infections” d days after 11th April 2020 is approximately 80000×(1+erf(d/15.7)). If Farr’s Law continues like this on a timescale of 15.7 days then the number of hospitalised infections would be plateau at around 160000 and the daily rate of new hospitalisations would drop below 100 per day around 12th May.
Vuk, I see you have now highlighted the “hospital mortality” for today in red at 13.5% We are still waiting for you explain what this actually represents and whether up or down is good or bad. You seem to think today is important since you colour it red. What are reading into this, and why?
The R2 figure tells us nothing much, the cumulative totals are both rising smoothly and monotonically, so obviously high correlation. It would be more interesting if done on daily numbers not the totals.
Death should peak some time after cases , so a lagged regression should show when max correlation occurs. In Italy that was a 5d lag, in France 14d. From eyeballing the UK data I suspect max R2 is at zero lag. That probably underlines how crap the data is more than anything else unless most people die the same day the get admitted !
Be safe, Vuk.
In his last post just 17h previously CofB said:
From the graph I can not see it higher than 11% and that was now two days ago. Never “every day” but just one. So why did a number from two days ago become “every day” and was reported at “remains
dangerously high” at a figure which never happened nor “remained” even once? Current value on the fuzzy spaghetti graph seems to be 8%. ( Though he still refused to use a clear, non-lossy format like png or gif so that we can actually read the graphs ).
If we look at daily new cases we can seen that Rep. Ireland has been at worst level for the last 9 days.

That should result in a linear rise in the total, if CofB manages to get 11% exponential growth ( reported as 13%) out of that, he needs check how he’s doing his numbers. That’s just scaremongering like MSM an creating a false agenda for continued confinement.
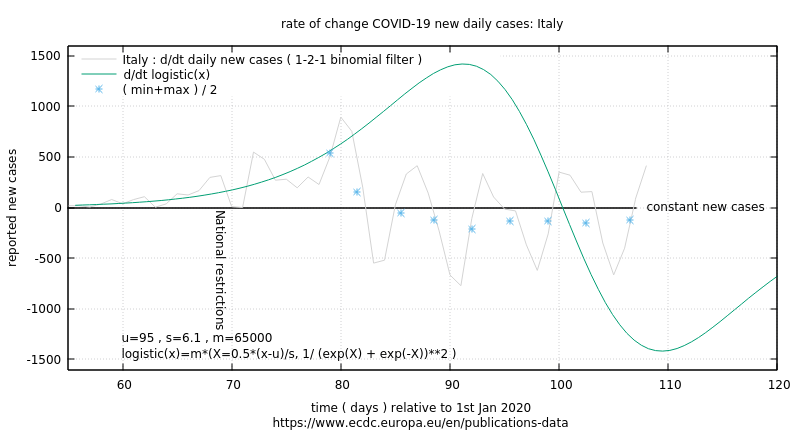
If we want to see what happens after relaxing confinement rules , I suggest we watch Italy. Changes were ordered Tues 14th, so I would expect first signs of effect in another week from now : 24/25th.
Looks like momentum for ending this stupidity is building in US. There’s hope yet.
forgot the Italy graph:
new reports of Italy testing plasma transfusion to inject antibodies from recovered COVID patients. I would bet this is the treatment they gave BoJo though there has been a suspicious silence on that whole question.
I would have thought the whole countries wants to know how he was so effectively treated and with what.
I’d guess they are worried everyone will say : why can’t I have that if it works ? And they are not geared up to do that on a large scale.
Greg Goodman
April 18, 2020 at 3:28 pm
Vuk, I see you have now highlighted the “hospital mortality” for today in red at 13.5% We are still waiting for you explain what this actually represents and whether up or down is good or bad. You seem to think today is important since you colour it red. What are reading into this, and why?
[…] It would be more interesting if done on daily numbers not the totals. […]
***
Every day the UK reports deaths in hospitals where patients have tested positive for Covid-19.
These figures are published separately by each country in the UK, except for England & Wales which are combined. We therefore have 3 sets of data for : England & Wales combined, Scotland, Northern Ireland.
The data for England and Wales is published daily here :
https://www.england.nhs.uk/statistics/statistical-work-areas/covid-19-daily-deaths/
Greg Goodman : “It would be more interesting if done on daily numbers not the totals.”
Re: Vuk’s charts :
Vuk
April 18, 2020 at 2:04 pm
The UK’s Covid-19 today’s (Saturday) update:
http://www.vukcevic.co.uk/UK-COVID-19.htm
*
Vuk’s stacked bar chart titled : “DAILY CASES” shows this daily reported UK mortality as the black section of the stacked bar vis “Hospitalised Deaths” in the cumulative chart titled “UK COVID-19 (log scale)”, with the daily UK “Hospitalised Infections” total shown as the red section of the stacked bar.
*
Greg Goodman : “We are still waiting for you explain what this actually represents …”
The UK’s daily reports of deaths in hospitals does not represent the total deaths in UK hospitals for any given day. Even though they are sensationally reported as such.
For example, using the latest “daily data” reported yesterday 18 April, from the above link for England Wales we read the following description :
“This section contains information on deaths of patients who have died in hospitals in England and had tested positive for COVID-19 at time of death. All deaths are recorded against the date of death rather than the date the deaths were announced. Interpretation of the figures should take into account the fact that totals by date of death, particularly for most recent days, are likely to be updated in future releases. For example as deaths are confirmed as testing positive for COVID-19, as more post-mortem tests are processed and data from them are validated. Any changes are made clear in the daily files.
These figures will be updated at 2pm each day and include confirmed cases reported at 5pm the previous day. Confirmation of COVID-19 diagnosis, death notification and reporting in central figures can take up to several days and the hospitals providing the data are under significant operational pressure. This means that the totals reported at 5pm on each day may not include all deaths that occurred on that day or on recent prior days.
These figures do not include deaths outside hospital, such as those in care homes. This approach makes it possible to compile deaths data on a daily basis using up to date figures.”
*
So, the “daily data” reported yesterday on 18 April, contains all hospitalised deaths, coded as Covid-19, known about as at 5pm on 17 April, which had not yet been reported. Yesterday, this total came to 888 of which 784 occurred in England and Wales.
The link to yesterday’s spreadsheet for England and Wales is here :
COVID 19 daily announced deaths 18 April 2020
https://www.england.nhs.uk/statistics/wp-content/uploads/sites/2/2020/04/COVID-19-daily-announced-deaths-18-April-2020.xlsx
The 784 hospitalised deaths data for England and Wales, reported yesterday on 18 April, is comprised as follows by date of death :
14-Mar-20 = 1
22-Mar-20 = 4
24-Mar-20 = 5
25-Mar-20 = 7
26-Mar-20 = 1
27-Mar-20 = 2
28-Mar-20 = 5
29-Mar-20 = 1
01-Apr-20 = 2
02-Apr-20 = 4
03-Apr-20 = 5
04-Apr-20 = 8
05-Apr-20 = 10
06-Apr-20 = 7
07-Apr-20 = 3
08-Apr-20 = 7
09-Apr-20 = 16
10-Apr-20 = 15
11-Apr-20 = 22
12-Apr-20 = 20
13-Apr-20 = 31
14-Apr-20 = 37
15-Apr-20 = 101
16-Apr-20 = 320
17-Apr-20 = 150
Awaiting verification = 0
Total = 784
*
So, yesterday’s daily total for England and Wales, reported as 784, was in fact the number of deaths not already reported, occurring over 25 separate days, spanning a time period of 35 days.
None of these facts prevent the media from distorting these daily reports into numerous, sensational, variations on the theme of “deaths in a day”, which they self-evidently are not …
For example :
The Sun : GRIM TALLY UK coronavirus death toll passes 15,000 as 888 die in a single day including 26-year-old and 114,217 are infected
https://www.thesun.co.uk/news/11425178/uk-coronavirus-death-toll-rises-lockdown-continues/
etc etc
This “journalistic” travesty is repeated every single day, with nary a murmur of concern, opprobrium nor censure from anyone, let alone HM Gov. It’s as if these daily distortions of official government data does not cause HM Gov any concern whatsoever …
I find it difficult to imagine an equivalent scenario, where the widespread, deliberately distorted reporting of official government data would be silently tolerated and not even mentioned …
HM Gov’s silence on this issue is deafening …
MG
If the data published in the UK press is about right you can estimate stats the UK Government finds it impossible to collate. Number of cases 114,217, deaths 15,464, looking at the graphs there are about 15K in hospital. So about 80K have either recovered (Boris) or not needed hospitalisation (POW). So cases with an outcome have about 84% survival.
Ben: “looking at the graphs there are about 15K in hospital.”
This is the figure no one seems even to be able to count, how do you get 15k?
Mark, it’s a bit of a false polemic you are screaming about. There is a day or two of uncertainty in reported dates. But it’s the same every day, so yesterday failed to count some that died that day but were boosted by those who died the day before. It’s a non issue.
Ben
“looking at the graphs there are about 15K in hospital.”
I do not know how you deduce that figure.
From the UK Gov data released on 18 April, for the stats as at 5pm on 17 April :
Number of coronavirus (COVID-19) cases and risk in the UK
https://www.gov.uk/guidance/coronavirus-covid-19-information-for-the-public
As of 5pm on 17 April, of those hospitalised in the UK who tested positive for coronavirus, 15,464 have sadly died.
Tests People tested Positive Deaths
Daily 21,389 15,472 5,526 888
Total 460,437 357,023 114,217 15,464
The above will be overwritten later on today at the same URL.
So here is the same persistent daily data as Tweeted by the DHSC :
Department of Health and Social Care
https://twitter.com/DHSCgovuk/status/1251496859606167552
@DHSCgovuk
As of 9am 18 April, 460,437 tests have concluded, with 21,389 tests on 17 April.
357,023 people have been tested of which 114,217 tested positive.
As of 5pm on 17 April, of those hospitalised in the UK who tested positive for coronavirus, 15,464 have sadly died.
Image URL :
https://pbs.twimg.com/media/EV40KQaXgAEzGZx?format=jpg&name=small
2:04 pm · 18 Apr 2020
*
As a snap shot the 114,217 positive tests and 15,464 deaths would give a crude survival rate of 86.5% – without taking into account any patients who are in hospital who might die or survive.
Caveat emptor : “Covid-19 coded deaths” are an abusive metric by virtue of their WHO mandated method of application and counting method.
MG
Mark, are the people dying or not.
Make what you want of the way the data is presented, but those people are now DEAD.
That means 15000 families with lost love ones, some families with more than one.
All the younger ones, ie below 70, even with underlying illnesses were productive useful people.
There are also a lot more people dying of normal illnesses because they can’t get treated.
Why are you trying to undermine that loss and losses all over the world?
Callous much.
A C Osborn
April 19, 2020 at 3:36 am
ACO : Mark, are the people dying or not?
MG: We know that people die every day from lots of different causes. You might like to avail yourself of the rules for applying the WHO’s 2 new Covid-19 mortality codes where ever you live. Deaths coded with Covid-19 does not necessarily mean the patient died from that. Dr Jenny Harries the UK’s Deputy Chief Medical Officer has said so herself. So any beef you have with that, you need to take up with her.
https://twitter.com/ClarkeMicah/status/1248644646248632327
https://www.rev.com/blog/transcripts/united-kingdom-covid-19-briefing-transcript-april-5
I read that the testing is also unreliable.
ACO : Make what you want of the way the data is presented, but those people are now DEAD. That means 15000 families with lost love ones, some families with more than one.
MG : See above
ACO : All the younger ones, ie below 70, even with underlying illnesses were productive useful people. There are also a lot more people dying of normal illnesses because they can’t get treated.
MG : No doubt. What’s your point ?
ACO : Why are you trying to undermine that loss and losses all over the world?
MG : I’m trying to find the truth of the matter. Why are you attempting to derail that effort ?
ACO : Callous much ?
MG : Ignorant much ?
MG
*
Greg
April 19, 2020 at 1:26 am
Ben: “looking at the graphs there are about 15K in hospital.”
This is the figure no one seems even to be able to count, how do you get 15k?
Mark, it’s a bit of a false polemic you are screaming about. There is a day or two of uncertainty in reported dates. But it’s the same every day, so yesterday failed to count some that died that day but were boosted by those who died the day before. It’s a non issue.
*
I posted a reply hours ago but it has not shown up.
I am aware of the compilation method Greg.
It is the reporting method I object to and the fact the HM Gov remains silent on that.
Here’s another example from 10 April :
COVID-19 daily announced deaths
COVID 19 daily announced deaths 10 April 2020
https://www.england.nhs.uk/statistics/wp-content/uploads/sites/2/2020/04/COVID-19-daily-announced-deaths-10-April-2020.xlsx
Here are the data for death in hospitals in England published by HM Gov on 10 April :
05-Mar-20 : 1
26-Mar-20 : 2
27-Mar-20 : 3
28-Mar-20 : 6
29-Mar-20 : 1
30-Mar-20 : 6
31-Mar-20 : 10
01-Apr-20 : 13
02-Apr-20 : 15
03-Apr-20 : 30
04-Apr-20 : 39
05-Apr-20 : 43
06-Apr-20 : 70
07-Apr-20 : 154
08-Apr-20 : 356
09-Apr-20 : 117
Total : 866
Here is how the Daily Mail reported that data :
Britain records Europe’s highest single-day death toll: Coronavirus deaths jump by 980 to 8,958 – surpassing Italy and Spain’s worst days – as 5,706 more patients test positive for the killer illness
https://www.dailymail.co.uk/news/article-8208307/Britains-coronavirus-death-toll-jumps-953-8-931.html
England recorded 866 new fatalities, while 114 were confirmed in Scotland, Wales and Northern Ireland
The death count is Britain’s darkest day yet, worse than the 938 deaths recorded on April 8 and 881 yesterday
It also means the UK has now surpassed the deadliest days recorded in Italy (919) and Spain (950)
*
All absolutely false.
The British public are subjected to this every single day. Not a workd ocf complaint from HM Gov that their data is so wildly misreported.
That’s the problem Greg.
MG
Not sure how England determines these things or where the data is, but what I would like to see are weekly death rates for the different causes of death. Then compare that information to previous years to determine what the averages are.
Are, as we are being told in the US, 35,000 more people dying in the US – because of Covid? Above and beyond the usual causes of death?
Or is there a concurrent drop in the number of deaths from flu, pneumonia heat, disease, or any of the other comorbidity that seem so common.
Lastly, when I go to the world covid page and look at the death rates for each country, why are only the western countries so high? If the virus is as deadly as they say, you would think it would be sweeping like a santa Ana brush fire through Bangladesh, or Mexico, or Costa Rica, or Belarus or the hundreds of other countries that haven’t locked down.
Don’t tell me it is just because they aren’t testing. If that many people were dying, they would be letting everyone know.
Logic and Reason
April 19, 2020 at 5:13 am
L&R : Not sure how England determines these things or where the data is …
MG : The UK data is complicated. Every day there is a release of NHS data which includes deaths in hospitals by date of death coded as Covid-19. As |i have posted here, this data does not represent any single 24 hour period as is so often reported. It is compiled of several days data often going back weeks.
See here : NHS COVID-19 Daily Deaths
https://www.england.nhs.uk/statistics/statistical-work-areas/covid-19-daily-deaths
Every week the Office for National Statistics ONS releases weekly totals for all cause moratlity, Covid-19 coded ( IXCD-10 codes U07.1 & U07.2 ) mortality and Respiratory coded ( ICD-10 codes J00-J99 ) deaths. This data is by date of death registration by week number.
See here : ONS : Deaths registered weekly in England and Wales, provisional
https://www.ons.gov.uk/peoplepopulationandcommunity/birthsdeathsandmarriages/deaths/datasets/weeklyprovisionalfiguresondeathsregisteredinenglandandwales
The rules for applying which mortality codes when certifying deaths is also complicated.
See here : Measuring pre-existing health conditions in death certification – deaths involving COVID-19: March 2020
https://www.ons.gov.uk/peoplepopulationandcommunity/birthsdeathsandmarriages/deaths/methodologies/measuringpreexistinghealthconditionsindeathcertificationdeathsinvolvingcovid19march2020
*
L&R : but what I would like to see are weekly death rates for the different causes of death. Then compare that information to previous years to determine what the averages are.
MG : Here are some of my own charts :
2020 Weekly All Cause Mortality vs 5 Year Average with Respiratory and Covid-19 up to 3 April 2020
https://twitter.com/Tattius1/status/1251851987341189120
2020 All Cause Mortality, & 5 year Average, non CV-19 and CV-19 coded Weekly Deaths up to 3 April 2020. The UK prisoner lock down was announced on 23 March – between Week 12 & 13. Note the, so far, unexplained increase in non Covid-19 mortality for Week 14 …
https://twitter.com/Tattius1/status/1251853186765373440
Excess deaths over 5 year average from ONS Registered Deaths in England & Wales data release 14 April up to 3 April. Note the Non Covid-19 Excess Deaths over the 5 Year Average for Week 14 …
https://twitter.com/Tattius1/status/1251854089102798850
ONS 2020 vs 5 year averages ( 2015 – 2019 ) for All Respiratory Causes and Covid-19 up to 3 April 2020
https://twitter.com/Tattius1/status/1251851650597367808
ONS Weekly Mortality Totals : All Respiratory Causes vs Covid-19 up to 3 April 2020
https://twitter.com/Tattius1/status/1251851083921657857
MG
Greg
April 19, 2020 at 1:26 am
Ben: “looking at the graphs there are about 15K in hospital.”
This is the figure no one seems even to be able to count, how do you get 15k?
Mark, it’s a bit of a false polemic you are screaming about. There is a day or two of uncertainty in reported dates. But it’s the same every day, so yesterday failed to count some that died that day but were boosted by those who died the day before. It’s a non issue.
*
I am aware of the compilation method Greg.
I am also aware of the way these daily reported figures are being reported.
It is the latter I am complaining about and that is a very real issue.
Here is another example of a headline from the data reported on 10 April :
Here is the NHS deaths in hospitals spreadsheet for England : COVID 19 daily announced deaths 10 April 2020
https://www.england.nhs.uk/statistics/wp-content/uploads/sites/2/2020/04/COVID-19-daily-announced-deaths-10-April-2020.xlsx
05-Mar-20 : 1
26-Mar-20 : 2
27-Mar-20 : 3
28-Mar-20 : 6
29-Mar-20 : 1
30-Mar-20 : 6
31-Mar-20 : 10
01-Apr-20 : 13
02-Apr-20 : 15
03-Apr-20 : 30
04-Apr-20 : 39
05-Apr-20 : 43
06-Apr-20 : 70
07-Apr-20 : 154
08-Apr-20 : 356
09-Apr-20 : 117
Total : 866 deaths in hospitals in England reported in 10 April’s daily release of figures
There were a further 114 from Scotland, Wales and Northern Ireland = 980 UK total reported on 10 April.
This is how the Daily Mail reported it :
Britain records Europe’s highest single-day death toll: Coronavirus deaths jump by 980 to 8,958 – surpassing Italy and Spain’s worst days – as 5,706 more patients test positive for the killer illness
https://www.dailymail.co.uk/news/article-8208307/Britains-coronavirus-death-toll-jumps-953-8-931.html
England recorded 866 new fatalities, while 114 were confirmed in Scotland, Wales and Northern Ireland
The death count is Britain’s darkest day yet, worse than the 938 deaths recorded on April 8 and 881 yesterday
It also means the UK has now surpassed the deadliest days recorded in Italy (919) and Spain (950)
[…]
All points patently false.
That’s the issue Greg and the British public are subjected to it every single day without knowing.
MG
England.
Scotland.
Wales.
Northern Ireland.
https://coronavirus.data.gov.uk/
There is a lag in death numbers. We know this. The total for April 17th will rise over the next few days.
John Finn
April 19, 2020 at 5:31 am
There is a lag in death numbers. We know this. The total for April 17th will rise over the next few days.
*
Thanks John. I do know that.
The lag in these deaths hitting the counts is understandable.
As I have already stated very clearly above :
I am not complaining about the lag.
I am complaining about being lied to by the media when they present these data and about HM Gov remaining silent on the abusive way in which their data is reported.
MG
As of 9am 18 April, 460,437 tests have concluded, with 21,389 tests on 17 April.
357,023 people have been tested of which 114,217 tested positive.
460 k tests ‘concluded’, but only 357k people ‘have been tested’. What, pray tell, happened to the other 103k tests?
I assumed the missing quant would be for where folk have been tested more than once and inconclusive test results.
MG
We will have to compare things like cause of death being heart attacks from last year against cause of death being heart attack this year to find out if deaths are being incorrectly attributed to covid19. If heart attack deaths drop by large amount then something is fishy.
There are reports of patients with various minor ailments being infected with CV in hospitals and eventually succumbing to it. On the other hand there are people who should be sent to hospital for a treatment and are not until it might be too late. So you might say that the CV is a double-edged sword for many who might require hospital treatment of any kind.
Yes, routine procedures like cancer screenings are not being done and hence cancer going undiscovered and allowed to progress.
My wife is alive today, because her breast cancer was discovered extremely early … I weep for all the women who will not be afforded the same great advantage we have created for the cancer stricken. I weep further as I read of Doctors and Nurses being furloughed… who could be operating the machinery of these screenings. Sad.
The good news is the authorities will soon open the hospitals back up to regular customers. It was an overreaction to close all hospitals to medical procedures not related to Wuhan virus. They are correcting that now.
Overreactions are to be expected in a situation like this. The next time we have an unknown virus going around, we will know much better what we can and cannot do. This is a learning experience for all of us including our leaders. We’ve never been here before. But we are getting on top of this problem now and are going to come out the other end stronger and wiser.
I am awaiting a Covid antibody test and have contacted a newly organized non-profit for scheduling a test. If I had Covid in mid-February like I believe, let me tell you that it’s like nothing I’ve ever experienced in my life. I woke up in the middle of the night having difficulty breathing and tightness in my chest and when getting out of bed I was so dizzy I fell back onto the bed, then when I stood up I could barely walk straight. I felt like I had been hit by a truck and had brain fog, fatigue and was light-headed all day long. When I went to bed at night it felt like streaming electrical shocks in my lower legs and I have never felt this sensation before. This went on for three days and nights and at the time I attributed these symptoms as grief-related. I believe two of my sisters also had Covid as one of them had traveled to Washington State in late January and when she returned she and her entire household was ill with Covid-type symptoms. My other sister was in contact with her after she returned from her trip and this sister came down with pneumonia-type symptoms. I was in contact with her during her illness and within a few days I became symptomatic. Coronavirus was not on any of our radars in early to mid-February and it hasn’t been until recently that we all think we had it. None of these family members were treated or tested but all of us are requesting antibody tests. I seriously doubt this was the flu – I’ve had the flu and this was VERY different plus I had been exposed to influenza B over Christmas by my two teen daughters living in my household and never got sick. If this was indeed coronavirus I believe it deserves to be taken seriously, this ain’t no cold or flu, it interferes with blood oxygenation and I’m living proof of that.
I think you have hit the nail(s) on the head:
1. This is not flu. The virus interferes with the ability of haemoglobin to transport oxygen to the organs and finally releases the iron which is returned to BOTH lungs. Hence the crystal-like mess being picked up in CT scans. Using a ventilator seems to exacerbate the problem whereas CPAP doesn’t. In other words, stop forcing oxygen into compromised lungs and find another method.
2. MANY more people have been exposed to this than we know of. Here on the Isle of Man I know of at least 10 people who do not appear on our radar. Could be good(ish) news.
Do hospitals in some countries get paid more if they admit, or diagnose, a patient with covid19 than with, say, obesity or “underlying heart condition” or diabetes or “being old”?
Years ago I was peripherally involved with a UK hospital administration. Some funding from central government was effectively “ring-fenced”, so that, for example, the hospital got more money if a patient was diagnosed with, say, PTSD than with BPD. (I think the idea was that a minister wanted to be able to say that the government were “committed” to “tackling” the “epidemic” of XYZ disorder.) Since eccentric behaviour is rarely easily compartmentalised into acronyms, the boundaries were fuzzy (sometimes hidden as “co-morbidity”) and there was pressure on people to “diagnose” a condition for which there was funding, usually after media exposure. This led to all manner of unintended consequences and statistical distortions.
Yes in USA I have read that covid will be paid for by government if that is diagnosis and patient doesn’t have insurance. So obviously there is major financial incentive to blame covid for everything.
Yes this is true, this is why we believe New York City has been padding their numbers.
Stevek : ” If heart attack deaths drop by large amount then something is fishy.”
The most common main pre-existing condition was ischaemic heart diseases, with 541 deaths (14% of all deaths involving COVID-19). This may in part explain the decrease in deaths resulting from ischaemic heart diseases in March 2020, but this requires further analysis.
https://www.ons.gov.uk/peoplepopulationandcommunity/birthsdeathsandmarriages/deaths/bulletins/deathsinvolvingcovid19englandandwales/deathsoccurringinmarch2020
See also : Measuring pre-existing health conditions in death certification – deaths involving COVID-19: March 2020
https://www.ons.gov.uk/peoplepopulationandcommunity/birthsdeathsandmarriages/deaths/methodologies/measuringpreexistinghealthconditionsindeathcertificationdeathsinvolvingcovid19march2020
I have a pending FOIA request with the UK’s ONS, requesting figures for ICD-10 coded Covid-19 deaths = U07.01 & U07.2 and J00 – J99 coded for all respiratory causes to see if there is any inverse relationship …
MG
Did you also do that for the Flu?
If not why not?
Did I also do what for flu ?
You need to wind your neck in AC Osborn. Try to be polite. Ask nicely and you might get a better response.
MG
Why should I when you are questioning everything to do with COVID19.
The point is did you ask the same questions and ask for the same analysis for quoted flu deaths?
A C Osborn
April 19, 2020 at 6:30 am
Why should I when you are questioning everything to do with COVID19.
The point is did you ask the same questions and ask for the same analysis for quoted flu deaths?
Because that’s the way normal discourse should be performed. It is also good manners, which you self-evidently need to brush up on.
If you were familiar with the subject, you would not need to ask such question.
Any fool knows that flu is included within the J00 – J99 codes for all respiratory causes.
Perhaps you should stick to abuse A C Osborn, it’s what you appear to be good at.
Until you have something sensible to offer, I shall not be responding to you further.
MG
The only way to know what’s going on is to canvas hospitals nationwide weekly. Admissions testing positive for corona virus, discharges, outcomes. Ignore everything else.
I knew Monckton was related to former chancellor Nigel Lawson. Is he also related to Bill Gates ?
Regarding a vaccine if we can test it for side effects on older people and find no side effects it well maybe worth the risk to give it to those in nursing homes or older unhealthy people. Yes giving it to them is a risk, but so is not giving it to them.
Still waiting on that vaccine for HIV and the common cold. May be waiting awhile for this one, too. Are we to cower under our beds waiting for our Guaranteed Universal Income check all that time?
BTW how many takers are we going to have for the GND now that we’ve had the 60-day free trial?
Denmark by far the most populous country in Scandinavia…? No.
The combined population of Denmark, Norway, and Finland is about 1.5 times the population of Sweden. link That means the per capita fatality rate for Sweden is three times worse than for the combined population of the other three countries (not just twice as bad).
Sir, I think “worse” is an emotive adjective. I’d settle for “higher”.
However, the only relevant issue for Sweden is whether the death rate (whatever it may be – high or low) is in danger of swamping its health service.
If the answer is No, then Sweden has shown that it is possible to ignore coronavirus and save trashing one’s economy, and having to worry about the increase in collateral deaths (suicides etc), the mental health issues, and the increase and domestic violence which seem to be inevitable in every country which has gone down the lock-down route.
Agree. The cure is increasingly looking worse than the cold, the more information we get and the longer we drag it on like this.
Also, what about the 3rd world? Not much reporting on their fortunes. If this virus is as deadly as the media et al would have us believe, there should be millions of 3rd world people dead in the (unpaved) streets by now. And yet…
“If the answer is No, then Sweden has shown that it is possible to ignore coronavirus and save trashing one’s economy,”
Yes, it’s too bad Sweden couldn’t show us that back in January when noone had any answers for the Wuhan virus.
Hindsight is 20/20. It’s easy to say what should have been done, after the fact.
What happens in the future will tell whether a huge error has been made or not. It’s possible for herd immunity to be reached sooner in Sweden. Of course, if reinfection does readily occur, then that might not be a good outcome.
Thats not in dispute. And if that is what the author meant to convey, he failed.
Lord Moncton, I believe you have been misinformed as to the President’s tweets. The 3 Governors called out had implemented overly onerous restrictions, going well beyond common sense guidelines. Hence large scale protests, and the Minnesota governor has already backed off.
Why do you call Mr Monckton Lord Monckton when he doesn’t have the decency or manners to call your President President Trump?
Because he is a Lord not a Mister and will always be Lord Monckton, or more properly Viscount Monckton. Trump will only be President for, at most, another four years and nine months.
Also because Americans are generally more courteous about these things than, evidently, you are!
It’s already fishy without heart attacks as a consideration:
https://wattsupwiththat.com/2020/04/11/coronavirus-good-news-the-downtrend-in-chinese-virus-case-growth-rates-continues/#comment-2963429
The numbers are a mess. I wish somehow the data can be sorted out to figure out what is really happening. If some old person goes to hospital due to covid and catches some anti biotic resistant infection, then that death certainly could be attributed to the bacterial infection.
But they wouldn’t have caught it if they didn’t have to go to hospital with a totally compromised immune system due to COVID19.
I am skeptical of claims that are supported by some kind of mathematical analysis: The one key take away idea I got from all those courses in statistical analysis that I took is that if you formulate your mathematical model so that it complies with all the rules of mathematics, when you run numbers through it YOU WILL GET SOME KIND OF A RESULT. It may not reflect physical reality at all, but it will yield a mathematical result.
It is beginning to look like the modelers studying the COVID-19 phenomenon don’t understand well how the virus behaves in the wild. Well, maybe somebody does, but it’s hard to tell. When predictions don’t align very well with actual experience, something is wrong. I can think of several problems with the data being used: arbitrarily declaring the cause of death, missing observations, inaccurate observations. The models themselves are probably mis-specified as well.
A model is just set of assumptions. These assumptions may be totally incorrect. So in other words the model is the opinion of the modeler if the assumptions cannot be verified. The only way to validate the model is to compare its results against experimental output.
The data coming from different countries are based on different criteria, and none are in any way accurate. We still don’t know who is infected, had been infected, or has died of or with the virus. The whole this is a complete mess. The only thing any analysis of this data can ever produce, is a complete mess.
I despair of the whole thing, and watch in horror as the global economy is trashed. If China wanted to win an economic war, it could do no better than we are doing to ourselves in the rest of the world.
“I am skeptical of claims that are supported by some kind of mathematical analysis: ”
yes it is better to guess.
What is a model ? A guess?
Coronavirus : Modelling
UK Gov pandemic policy outsourced to the Bill Gates funded unit at Imperial College under Prof Neil Ferguson who uses a computer model of thousands of lines of undocumented C code, written 13+ years ago …
WSJ : Coronavirus Lessons From the Asteroid That Didn’t Hit Earth
https://www.wsj.com/articles/coronavirus-lessons-from-the-asteroid-that-didnt-hit-earth-11585780465
Scary projections based on faulty data can put policy makers under pressure to adopt draconian measures.
By Benny Peiser and Andrew Montford
April 1, 2020 6:34 pm ET
Several researchers have apparently asked to see Imperial’s calculations, but Prof. Neil Ferguson, the man leading the team, has said that the computer code is 13 years old and thousands of lines of it “undocumented,” making it hard for anyone to work with, let alone take it apart to identify potential errors. He has promised that it will be published in a week or so, but in the meantime reasonable people might wonder whether something made with 13-year-old, undocumented computer code should be used to justify shutting down the economy.
*
neil_ferguson
https://twitter.com/neil_ferguson/status/1241835454707699713
@neil_ferguson
I’m conscious that lots of people would like to see and run the pandemic simulation code we are using to model control measures against COVID-19. To explain the background – I wrote the code (thousands of lines of undocumented C) 13+ years ago to model flu pandemics…
9:13 pm · 22 Mar 2020
*
MG
Any program with more than 1 line of code has at least 1 undiscovered bug.
13000 lines of undocumented C. on this we bet the economic future of the world?
More likely the program has a series of offsetting bugs, left behind during debugging that give the appearance the code is working. But in fact the results are simply eye candy.
“He has promised that it will be published in a week or so, but in the meantime reasonable people might wonder whether something made with 13-year-old, undocumented computer code should be used to justify shutting down the economy.”
He is not the only one putting out models like this. As far as I know, all the models are predicting large numbers of people dying from Wuhan virus if nothing is done, thus spurring numerous nations to shut down their economies.
I don’t know of any good, accurate models that precisely tracked the Wuhan virus reality from their inception, so requiring that seems a little unrealistic. Models get more accurate as data is added to them. When you start the model off you don’t have much data, just a lot of guesses, so it’s not going to be as accurate as is desired. It takes time to figure out what the virus is doing and then modify the model accordingly.
I think the criticism of the virus models is way overblown. This, coming from a constant critic of the Human-caused Climate Change/surface temperature record computer models (me).
The difference between the virus models and the climate models is the virus models use data and modify their findinds as appropriate, whereas the climate computer models and surface temperature models use guesses that do not match reality.
Gordo says:
April 19, 2020 at 5:15 am
https://www.theblogmire.com/led-by-the-science-towards-a-medical-despotism/#comment-35391
To my knowledge, never in history has the general healthy population been quarantined to protect the sick, an utterly weird notion that will cause more damage to health and the general economy than any virus.
This experiment was predicated upon the grossly inflated “scientific” models generated by Neil Ferguson at ICL and his ‘flatten the curve’ theory. This man should already have been utterly discredited, if not jailed. His models for foot and mouth disease in around 2000, later shown to be incorrect, caused the slaughter of millions of livestock buried and burned in pits as farmers looked on in tears. Even more incredibly, in 2005, in reference to bird flu H5N1 he is cited as: “Last month Neil Ferguson, a professor of mathematical biology at Imperial College London, told Guardian Unlimited that up to 200 million people could be killed” (ref). 200 million! He was only slightly exaggerating : the latest WHO report on this virus (here) reports there were 455 deaths globally between 2003 and 2020. […]
https://www.theguardian.com/world/2005/sep/30/birdflu.jamessturcke
https://www.who.int/docs/default-source/wpro—documents/emergency/surveillance/avian-influenza/ai-20200327.pdf?sfvrsn=30d65594_52
One of Prof Ferguson’s colleagues on the government advisory SAGE committee, is Susan Michie, who recently suggested that recreation grounds of UK public schools ( private schools that is ), should be requisitioned so that those without gardens can exercise …
Guardian : Private schools’ land targeted for families without gardens
https://www.theguardian.com/world/2020/apr/12/private-schools-land-targeted-for-families-without-gardens
Prof Susan Michie
https://thepsychologist.bps.org.uk/volume-33/april-2020/coronavirus-psychological-perspectives
[…]
Elsewhere… added in chronological order since the start of the outbreak
Susan Michie has been appointed to the Scientific Pandemic Influenza Group on Behavioural Science to support the Cabinet Office Briefing Room. In this BMJ blog, she argues that behavioural science must be at the heart of the public health response.
***
Wikipedia : Susan Michie
https://en.wikipedia.org/wiki/Susan_Michie
Susan Michie is professor of health psychology at University College London.
[…]
In 2002, Michie joined the Psychology Department of University College London (UCL), where she is Professor of Health Psychology. She is Director of UCL’s Centre for Behaviour Change (www.ucl.ac.uk\behaviour-change)and of its Health Psychology Research Group.
Her current research includes developing methodologies for designing and evaluating theory-based interventions to change behaviour, and advancing scientific knowledge about, and applications of, behaviour change interventions. She leads the Human Behaviour-Change Project (www.humanbehaviourchange.org).
Michie has served as President of the European Health Psychology Society and chair of the British Psychological Society’s Division of Health Psychology and was elected a Fellow of the BPS in 2001. She is a Fellow of the Academy of Medical Sciences, the Academy of Social Sciences, the European Health Psychology Society, and the USA’s Society of Behavioral Medicine and Academy of Behavioral Medicine Research.
Michie is a member of the UK Government’s Pandemic Influenza Advisory Committee, Covid-19 Behavioural Science Advisory Group and Scientific Advisory Group for Emergencies (SAGE) (https://thepsychologist.bps.org.uk/informing-and-translating-evidence-base).
Personal life
Susan Michie is the daughter of the late biologist Dame Anne McLaren and computer scientist Donald Michie and sister of the economist Jonathan Michie. She was married to the trade union official Andrew Murray (1981–97) and has three children, Jessica Katharine Murray, Jack Douglas Murray and Laura Catriona Murray. She has served as National Executive Committee member and president of the London Region of the trade union MSF and is a member of the Communist Party of Britain.
[…]
MG
Population of Sweden is nearly twice that of Denmark. It’s not hard to look that up, Mr. Monckton.
Also saying deaths/capita are lower in other Scandinavian countries would be expected anyway since they have implemented restrictions with the expressed aim of flattening the curve and deferring the problem until later. If the numbers were not less this would mean they are destroying their economies to no gain.
This ignorant comparison is being made over and over again by people with either no understanding or deliberately out to misdirect because they have an agenda to push. We know which is the case with CofB.
This is typical apples to oranges games. Since none of the other countries are over whelmed we should be saying why are they flattening the curve, at great cost, just to deal with the same number of sicknesses / deaths later on. Until we are far enough down the line to look back at totals with both strategies the numbers are not even comparable.
Exactly
They will never be comparable.
The experiment is uncontrolled.
Take Sweden. people are voluntarily reducing their interactions with others.
For example, travelling less to the grocery story ( by a factor of 7)
than people in Norway.
far too many uncontrolled and unobservable confounding variables.
Folks will find what they want to in the data
Only Korea has good date 😉
Data…but you knew that
The only analogy we have to go by is the 1918 Flu . I know this is a different virus but it’s an upper respiratory so the transmission is likely the same. In the USA deaths peaked in October and rapidly decreased in later November in many cities (Crosby). So was that herd immunity or mutation of the virus or what?
“The only analogy we have to go by is the 1918 Flu .” SARS, MERS, heck, Legionnaires and AIDS. We have a LOT of diseases to compare this to. What is NOT comparable is the absolute HATRED of the President of the United States of America.
China hates him because he is whipping their ass on economic issues. Europe hates him because he is actually making THEM pay for their OWN defense. The Muslims hate him because he actually wants to give them the opportunity to BE a “religion of peace”. The Spanish speaking countries in the Western Hemisphere hate him because he wants THEM to become GREAT countries where THEIR citizens want to STAY and not sneak into America. Hmm, did I leave anybody out that hates President Trump?
Oh, did I mention the Democrats, RINOs, Leftists and Socialists (American, Canadian and British) that hate him because he actually wants to DO good not just make people FEEL good?
The Russians. Heck, Putin is just happy to NOT be mentioned every day by The Donald.
The media in general, Hillary, Bill, Chelsea, the View, Rosie O’Donnell, Kathy Griffin, pretty much all of Hollywood, MIC, a bunch of former FBI officials, Maduro, drug lords, pedophiles, XR, environmentalists, 90% of academics, my boss, my boss’s boss, etc., etc.
You’re right he’s widely hated. I like him for that reason.
Nearly all the twitter blue checks, notably the ones that indicate: former JAG, former DOJ, former fed prosecutor… Their analysis about legal issues are almost always insane.
Interestingly the peak in France was only a few weeks later than in the USA (steamships anyone?), even more curious the peak in Germany coincided with the French! UK was slightly later than continental Europe (an early Brexit advantage?)
I remember 1968 because my oldest son was born, a friend was killed in the Tet Offensive in Vietnam Nam and I was released from active duty in the fall to return to university. I don’t remember the Hong Kong flu that some estimates say killed 100,000 Americans. I am sure there was no lockdown. This lockdown is a panic response based on worthless computer models.
Why wasn’t my reply to you posted? Or was it? Or is it being moderated? WordPress comments SUCK!
In 1968 how many people had to go on ventilators to save them from the flu?
How crowded were the hospitals?
How many people died of other things because the hospitals were full?
Why are you comparing 100,000 deaths without lockdown with 20,000 and rising with a lockdown? Apples and oranges
Closer to 40000 in 1 month with lockdown.
Over a 6 month winter period that would equate to 480,000 with lockdown if nothing changed.
Note that all Flu statistic are “Estimated” and it is usually 20,000 to 60,000 ie they have no idea really.
Hong Kong Flu deaths were never counted.
They were estimated from excess death statistics
Estimated with a computer model.
best ESTIMATED #s on HK flu for USA?
33K
https://www.sinobiological.com/research/virus/1968-influenza-pandemic-hong-kong-flu
https://nieman.harvard.edu/wp-content/uploads/pod-assets/microsites/NiemanGuideToCoveringPandemicFlu/AHistoryOfPandemics/ACenturyOfFluPandemics.aspx.html
also comparing Covid to HK is tough because HK LIKE EVERY FLU EPIDEMIC OF THE PAST 250
YEARS HAD 2 WAVES
you are in the first wave of covid.
when covid is over you will be able to compare.
https://academic.oup.com/jid/article/192/2/233/856805
There’s a study from Germany which found that, in one community, the infection rate was 15% most of which were asymptomatic. The fatality rate was 0.37%. link
I wonder what the policy implications are.
repeat after me
fatality rates are local
fatality is a function of age demographics and co morbidity distribution.
which is local
national fatality rate is almost useless. it helps you plan 1 thing.
maximum body bags required.
Infection rates are too clumpy to draw many conclusions.
Differences in the way counting is done makes it even worse.
Many reports that only fatalities in hospitals are being counted.
New cases seems to have more to do with testing than transmission.
And bad accounting of recoveries means that active cases counts are very uncertain, but it does appear active cases continue to increase in most places.
Severe active cases may give some idea of deaths to come.
Several days after every peak in new cases, de@ths increase and make a new peak.
There appears to be a cyclicality to it.
Which makes sense if new cases lead to new transmissions, and new cases are followed after 5-7 days by more f@talities.
And there is little reason to think tallies are being done very comprehensively in real time.
Look at France. Huge one day spikes here and there.
Same for a lot of places.
Probably due to delays in accounting and totaling.
In short, the data is a mess and unreliable.
Only after some time has passed will there be any certainty.
Not in real time.
Too chaotic.
This says no.
https://townhall.com/columnists/marinamedvin/2020/04/15/israeli-professor-shows-virus-follows-fixed-pattern-n2566915?utm_source=thdailypm&utm_medium=email&utm_campaign=nl_pm&newsletterad=&bcid=70082f875101e278acfed8bdd2fd90a1&recip=19766714
Hi P.Watson, – The professor who graphed that pattern has some fellow professional Israeli’s issuing serious criticism of it’s significance. I’ve read some of those translated into English on-line, but have not preserved their links.
The link is from several days ago (when I too came across it) & it has not won much traction since then. My impression it is more a curiosity at this point than proof the pandemic has definitively begun to run down.
Why does anyone think the vaccine will save us? I know someone who got their flu vaccine last year and less than a month later had a DIFFERENT strain of the flu. Can you prove to me that they would NOT get the strain that they were vaccinated for?
And just how many deaths from ANY of the diseases we have vaccinations for occur every year? There are STILL 10s of thousands of deaths attributed to the flu EVERY year. Where do I find the deaths or infections o people that WERE vaccinated but STILL contracted the disease?
BTW – Have flu and other contagious disease infections gone down this season due to the Wuhan Flu fighting strategies? I haven’t heard anyone mention that which leads me to believe that they have not. Then again, the MSM wouldn’t want to tell us if there were good news because Orange Man Bad.
And bottom-line we have absolutely NO CLUE what the denominator is and pretty much EVERY death that can even remotely be attributed to the Chinese Virus is being added to the total including RETROACTIVELY.
Add that to the absolute FACT that virtually every nation, state and locality is LYING about pretty much everything and the headline should have read:
We know NOTHING as fact about the Chinese Virus
Heck, we don’t even know from whence or when it came.
“What? Coronavirus Began Months Earlier And Not In Wuhan, Bombshell UK Report Claims
Not so, says a bombshell new report by scientists from the University of Cambridge in Britain.
“While coronavirus was previously believed to have originated in a wet market in Wuhan at the end of last year, new research suggests it may have actually came from further south – and began spreading among humans as early as September 2019,” The Sun reported on Friday.”
Sure The Sun is a tabloid, but I can’t see how it could be any less reliable than CNN, The New York Times and company.
Colour me sceptical.
You’re right about this, we don’t know much.
With regard to reductions in flu, at least in N.A. flu was already well in decline. Flu deaths next year will probably be lower because many vulnerable are being taken this year.
It’s appearing more and more likely that the Wuhan virus escaped from the virology lab there.
Chit Not News (CNN) is the exact opposite of NEWS. But so is all MSM .Here on WUWT one can get the best idea of WATTS. Happening ,go Anthony thanks again
Sweden is only weeks away from Herd Immunity.
We are years away.
So you are saying that Sweden has had 6,000,000 cases of COVID19 and not the 13,000 that they have declared?
60% of the population being the acceppted requirement for herd immunity.
Just WOW.
How do YOU know anything? Has Sweden tested its entire population? I believe there have been several articles about “discovering” that VASTLY more people HAVE BEEN (past tense) infected and recovered than even imagined.
This entire pandemic is going to turn out to be a big DISEASE nothing burger that will destroy economies and INCREASE tyranny on the entire planet.
Have you noticed that other than China the only countries being affected are relatively FREE countries? Mostly Western countries. None of the dictatorships in Africa, South America or Asia seem to be affected. Hmm. Where’s that extra-large tinfoil hat?
So 164,000 dead in 1 month is a nothing burger?
If you say so.
The US death rates have been biased upwards by ‘standardizing the data nationwide’ on April 16th to uniformly include both ‘death because of Chinese virus’ and ‘death with Chines virus’ in the overall death count each day. Dr. Birx acknowledged this on today’s Task Force update. It clearly shows in the trend increase for the US on Apr 16. Without the recent and deliberate upward bias, the death rate would be close to 8%, not the quoted 10.3%!
Oh, only 8%, that’s OK then.
I saw your reply and thought about a couple of questions.
1. What is the death rate of those ADMITTED to a hospital with Wuhan Flu?
2. What is the death rate of those ADMITTED to a hospital with say a heart attack or pneumonia or some other serious issue?
My initial search turned up this headline:
“Risk of Death May Be Higher if Heart Attack Occurs in a Hospital”
Add to that almost 2 million hospital-acquired infections that result in nearly 100,000 deaths per year just in America (Do you think that rate is any lower in any other country?) and I would say “Oh, only 8%, that’s OK then.” without the sarcasm is OK for those being admitted with the Chinese Virus.
That means that more than 92% walk out alive.
Perspective isn’t news. Olde Wisdom from Thee Frugal Curmudgeon, that’s me and I believe that phrase was coined by me.
Side note: I recently heard about someone who bled to death from an ulcer after being admitted to the hospital because they had recently had a fall and the doctors were looking everywhere but his digestive tract. Makes you wonder about why they think a ventilator is the “cure” for the Wuhan Chinese Pandemic. I’ve seen several articles suggesting that in many cases it is the VENTILATOR that is killing the patient. Go figure.
Your unwarranted sarcastic response is noted, AC. I didn’t say it was ‘OK’. You did! I simply explained why the US data shows a sudden seemingly anomalous bump up of +2% on April 16th, in a constructive, informative fashion. Comprende?
If the Worldometer figures are anywhere near reliable the Swedish per capita death rate is significantly higher than that of the US.
That’s despite the Swedish infection rate [measured] being [apparently ] significantly lower than that of the US, Sweden’s lower testing rate could be be the reason for this difference.
The relaxed Swedes may be about to find the cost of relaxation.
Why are 20 states in the U.S. not reporting recovered Chinese virus cases?
Every state not reporting recovered cases is publishing a false number of “active” cases. As of today, this totals over 112,000 “active”cases in states with zero reported recoveries. To label all these cases “active” is factually incorrect.
States not reporting recovered cases:
Alabama
Arizona
Colorado
Connecticut
Georgia
Indiana
Kansas
Mississippi
Missouri
Nebraska
Nevada
North Carolina
Ohio
Oklahoma
Oregon
Rhode Island
South Carolina
Utah
Vermont
Virginia
Also many entire countries not reporting recovered cases, including these:
Argentina
Brazil
Chile
Denmark
England
Germany
Hungary
Ireland
Netherlands
Norway
Poland
Portugal
Sweden
There is worldometer, and there you find recovered cases.
Some, but not all. There are still 20 states in the U.S. not reporting recovered cases at all.
Recoveries are being vastly under-reported.
Also many entire countries not reporting recovered cases, including these: Really ?
Copying your list (recovered)
Argentina 685
Brazil 14.026
Chile 4.035
Denmark 3.847
England n/a
Germany 88.000
Hungary 250
Ireland 77
Netherlands 250
Norway 32
Poland 1.040
Portugal 610
Sweden 550
England is the only country not reporting reovered cases, beside the US states.
But, at least, England has 2 known: primeminister Johnson and Prince Charles.
Portugal is reporting «recovered cases», on a daily basis… The accumulated figure for today is 610, as opposed to a total of 714 deaths, in a population of 10.300.000.
Unfortunately, we are not INDIVIDUALLY omniscient. But through the “wisdom of the crowd” (modern-day “crowdsourcing”) we can often find the answers.
Just because we INDIVIDUALLY can’t find the answer does NOT mean the information doesn’t exist.
Try to find out how many die of a disease they were vaccinated for. I’m guessing that many do, and not just from the vaccine but from being infected by the disease while the vaccine should have been protecting them from it. Nothing is 100% effective.
How do you determine the effectiveness of a vaccine for a deadly disease? Any volunteers for the placebo control group?
covid19live.info/us/ shows Arizona has 327 recovered. I live in Arizona and I know that there are recovered patients here. We had one of the first reported cases of a student from ASU coming back with the virus. That person also recovered.
My bigger question is, why does the US as a whole show so few recoveries when compared to other nations? What are they doing that we aren’t?
From what I understand, they aren’t treating this thing unless you become so severe that you have to become hospitalized. At least that is what I’m hearing from people who work in the hospitals here in AZ. Is that the same situation in other places?
I don’t want to go into detail about what I thought of what Lord Monckton said in his article. I will leave that for others to discuss so that I don’t say something rude or out of line.
WASHINGTON (Reuters) – President Donald Trump said on Tuesday he is close to completing a plan to end the coronavirus shutdown and reopen the battered U.S. economy with some parts of the country likely to be ready to go before May 1.
https://uk.reuters.com/article/us-health-coronavirus-trump/trump-says-close-to-plan-to-reopen-economy-possibly-in-part-before-may-1-idUKKCN21X060
What is Bill Gates going to do with his vaccine when we get back to normal before the end of June which seems very possible. What excuse will be proffered to roll it out ?
I will say this for Lord Monckton: He is an unusually generous and trusting man. Researchers at Oxford have developed a vaccine and are producing a million doses, and the efficacy of the vaccine will not be subject to clinical trials? Well, call my cynical, but that might just be a swindle, unless they’re providing the vaccine for free.
Ian Coleman
Thanks for that. I didn’t get to the end.
‘UK scientists to make a million potential COVID-19 vaccines before proof
Asked when the shot – if proven to work – might be able to be made widely available to the public, Hill said the best case scenario would be for regulators to grant it “emergency use approval” – something that could be achieved within six weeks beyond the point at which data show whether it is effective.
That, he said, could mean around six weeks from September, when the team hopes to have positive trial data.
https://www.reuters.com/article/us-health-coronavirus-vaccine-oxford/uk-scientists-to-make-a-million-potential-covid-19-vaccines-before-proof-idUSKBN21Z25M
So this really is a desperate race against time. Can they get their vaccine out before the virus is deemed harmless ?
They are pushing an unproven drug on the market. For healthy people.
But that’s OK because it isn’t hydroxychloroquine.
The one statistical comparison I can’t find anywhere: What was the total number of deaths per day for every day in April, 2019, and what is the total number of deaths per day for every day in April, 2020?
Deaths in 2020 minus deaths in 2019 will begin to give us any idea of whether the virus really did anything different from what happened a year ago. Without that data, we’re all just guessing.
Actually, we will probably need a whole year’s data, so that we can tell if some deaths were merely hastened a few days or weeks by the virus. However, I agree that comparing current data on total deaths may be useful, although skewed by two issues in the lockdowns: fewer accidents and less transmission of other contagions.
One April week in the UK average of last 5 years 10,000 in 2020 16,000.
And that was before the peak.
“They are taking the risk, because they think they have the answer”
The answer is that provax is a demented cult. The answer is that the regulator is in their pocket.
The evidence is overwhelming.
I do keep wondering if this particular pony knows any other tricks
The Swedish government didn’t have to lock down the country. Swedes had already done it. They are not dumb. They could read what was happening elsewhere and what they had to do. They didn’t have to wait like sheep for their government to tell them what to do.
As for the worldwide figures the numbers of cases and deaths are both considerably understated. Countries with fairly poor health systems are unable to test much because of lack of facilities and trained personnel. Therefore few are recorded. The real numbers of infected in these countries could be 100 times the numbers reported. Even in advanced countries like the UK there is under reporting of both cases and deaths. When a health system is stressed there is no point in testing a dead person just to find out if they died with COVID-19. Much better to concentrate on keeping alive the people with severe symptoms of COVID-19.
The reason s why Australia and NZ have come out it it well so far are: Australia’s PM called the Pandemic 12 days before WHO a d NZ followed. So both countries had more time to better prepare. Neither country has much high density living (except for seniors accommodation in retirement villages and nursing homes) so less chance for spread (except in seniors high density accommodation -where special precautions are being taken). Lots of sun and wind. UV kills the virus, wind disperses it when spread outside. Populations are generally fitter and healthier because of spending more time outdoors doing things that keep us fit. Vitamin D levels are higher because of more time spent outdoors.
As an Aussie, I would say the reverse and say we have not come out of this well at all. The clear original intention of flatten the curve was to prevent the number of cases overwhelming the health system. All the charts had a line showing hospital capacity and the bell curve when flattened falling just slightly below this capacity.
Currently in my state, Victoria, we have 29 people in hospital with COVID-19 of which 10 are in ICU. Victoria has spent $1.3B to up our number of ICU beds to 4,500. So we are currently running at 0.22% capacity in ICU! Victoria has a population of approx 6.4 million and we have had 1328 cases or 0.02% of the population. We had 15 new cases over night, none of which were community transmission.
The government has made clear they are not going for eradication like NZ, instead a slow controlled spread. At the current slow controlled spread it will take centuries to get this through the community. (6.4m * 0.6) – 1328)/ 15 = 255,911 days (701 years) to reach the so called 60% heard immunity level
Worse, we are currently coming out of the warmer months where viruses find it harder to survive, peoples Vitamin D levels are higher and pneumonia type conditions are less frequent. So, at the moment it would be the best time to be having a larger controlled spread of COVID-19 in the population as once we hit winter the death rate per infection is likely to go up based on current Northern Hemisphere data (Winter/Spring) vs current Sothern Hemisphere data (summer/autumn).
There is absolutely no logical reason for my state to keep the harsh lockdown rules that it currently has in place unless they have changed to eradication mode, which all governments in Australia are still saying is not the aim.
I wasn’t aware that they were not trying for eradication. That would seem the most-nearly valid reason for trashing the economy.
We can do it, too, unlike most countries because we are so isolated and Oz & NZ being Islands. The UK could too, but aren’t even trying.
Trying to completely eradicate the coronavirus in Australia is not worth the economic cost and would be extremely difficult to achieve, Prime Minister Scott Morrison has warned.
The Australian leader said on Thursday night (16 Apr) there was ‘no clear additional benefit’ to tightening social distancing rules to an extent the economy was left in complete ruin.
The phrase ‘suppression phase’ is instead being used by the government to describe the fight against COVID-19 as the national growth rate in cases continues to slow.
https://www.dailymail.co.uk/news/article-8225699/Scott-Morrison-explains-Australia-ISNT-trying-completely-eradicate-coronavirus.html
So looks like just keep a really slow spread going, slowly remove restrictions for parts of the economy, with borders closed until sometime in 2021 for us in Aus.
The measure of how well a country is doing is how many people they have to bury.
Australia with 70 and mostly incomings and New Zealand with 12 are doing very well.
There appears to be a major problem. Mathematicians have really nice models into which they want to plug values. They unthinkingly take values from the real world that are actually mistyped to their models.
These include:
* Death caused by COVID-19 is what they want to model but they use a value that is death while infected with COVID-19 or indeed the NYC would have lived but for the COVID-19 restrictions. The median age for COVID-19 fatalities is in the 80’s and almost all have co-morbidities
* Number infected with COVID-19 is what they want to model as the denominator but they use the number of positive tests for presence of virus in a self-selected group of sick patients who are only allowed to be tested if they are already severely ill with symptoms of COVID-19.
In consequence of this mistyping – the case fatality rate is increased as the denominator is significantly decreased and the models are wildly incorrect. Not only that an increase in deaths due to inclusion of those considered to have died (that would have lived but for COVID-19 Restrictions) is taken at face vale as a real increase in death rate; an increase in number of testing stations, hence more tests carried out, but still only testing positive cases only – is taken as an actual increase in cases. Do these modelers ever check the source and reliability of their input values.
This is a classic garbage in garbage out and worryingly as shown in this post it is being disregarded by the modelers who publish results claiming that they mean something . On those results more (il)logical reasoning is based and those results and reasoning are being presented to and used by innumerate politicians to make extremely far reaching decisions on the future of the country. The politicians trust in these extremely qualified mathematicians and modelers is misplaced.
Note that like the worst climate models, there are no error bars or confidence levels in Figure 1 or Figure 2. Yet it is being shown by serological tests for antibodies in multiple places that the actual number of people infected by COVID-19, the denominator, is significantly, perhaps orders of magnitude, larger – disregarded by this post.
The economy of the world is in freefall and businesses crashing, because modelers falsely claimed millions will die, well not millions hundreds of thousands, well not hundreds perhaps tens of thousands. Each time inflating the Case Fatality Rate to a level that the politicians felt they had to do something.
In the many postmortems on this pandemic, it will be shown that unaccountable modelers generating scary but incorrect information, forced inappropriate responses from the politicians of the world making ‘the cure worse than the disease’.
“almost all have co-morbidities”
Each flu vaccination = co-morbidity?
OK then
I’ve seen this one

Are the 40,000 dead in the USA or not?
Did they all die in just one month or not?
@A C Osborn
Did they all die of COVID-19? No.
See Goodhart’s Law
The arguments in the post were based on trends and exponential rates. When the data input is not what the modeler expects but includes people who had a heart attack at home because they wouldn’t go to the hospital because of fear of COVID-19 and those who died of cancer because ‘elective surgery’ was canceled by the hospital due to COVID-19 , then using those numbers and when the death occurs as a trend in COVID-19 deaths is wrong.
Similarly as testing increases the number of people testing positive increases – this is not the infection rate nor is it the count of people infected.
So claiming trends from these figures is completely misleading.
It is the trends that are being used in the post and by politicians to make decisions that affect the recovery of the economy and if the economy of the world does not recover the numbers dying will dwarf the COVID-19 numbers.
It is essential that decision makers are given the correct figures, There are times when an honest modeler should say we don’t have the correct data to be able to model what is happening. OR build the model but put error bars and confidence levels.
Figures coming in from serological testing are showing that the denominator being used is grossly underestimated and therefore the case fatality rate is grossly overestimated.
Dying of a corona virus infection not nice, nor is dying of any other diseases which are currently being disregarded. There are complex risk assessments that need to be done by individuals and government. If the inputs to those decisions are skewed the decisions made will be wrong.
Lockdown seems to have little to do with death toll.
With respect to lockdown, comparing Sweden to Norway with respect to the total confirmed cases relative to the population (Tot cases / 1M Pop):
– no significant difference between those two countries.
Comparing Belgium (strict lockdown) to Netherlands (weak lockdown) :
– again, no significant difference between those countries with respect to Tot cases / 1M Pop.
https://www.worldometers.info/coronavirus/
Conversely, age distribution, comorbidity distribution, the healthcare system (ICU beds, pre-existing nosocomial infections, etc.) and the applied strategy to detect and treat the infected all may have an actual impact on the death toll.
Some thoughts trying to have a clue on what’s going on :
(All that follows are assumptions based on poorly reliable data :
https://www.worldometers.info/coronavirus/)
Here is another possibly relevant criteria which seems to be correlated to the death ratio (number of deaths / number of confirmed cases) :
– the mean lag (in days) between the daily confirmed cases peak (or local maximum) CP and the daily deaths peak (or local maximum) DP .
(CPDP).
I make the assumption that :
– the lags between actual deaths and published daily deaths are similar among countries,
– the lags between actual cases and published daily cases are similar among countries.
According to https://www.worldometers.info/coronavirus/ :
When CPDP is under a week, the apparent death ratio is around 10-12%.
When CPDP is about 10 days or higher, the apparent death ratio is around 1-3%
A short CPDP could mean that the cases are detected too late (the death mostly happens a few days after the case is confirmed).
The apparent difference in death ratio between countries with short CPDP and countries with long CPDP could mean that some used treatment must be efficient to reduce the death ratio when applied at an early stage of the desease.
Some examples :
– in France and in Netherlands, people are told to stay at home until the desease is serious (fiever, difficulty to breathe, etc.). The apparent death ratio is huge and CPDP is under or about a week. This seems to be the case also for Italy, Spain, Sweden, Belgium, etc.
Other countries seem to manage a lower death ratio possibly – among other reasons – because they have a somewhat efficient treatment applied in the earlier stage of the desease :
– Switzerland, India, Russia, Australia, Israel, Greece, Finland, Island, Norway, Germany, Austria, Chili, India, South Corea, and possibly others.
Most of their CPDP is higher than a week (except for Greece where CPDP is near 0 … I wonder if they treated before even testing or perhaps the lag between the tests and the results are higher …).
Don’t know if this is relevant, but among those countries, some are using, producing, have bought or imported Chloroquine (HCQ or Chloroquine Phosphate) :
– India, Russia, Australia, Israel, Greece, Finland, Island, Chili, India, South Corea. Possibly others. Does that mean that they actually use QC on a large scale ? Have no idea.
Again : I’m just wandering.
In Marseille, people are encouraged by Didier Raoult to get tested and receive treatment, not to crowd the hospitals…
Comparing Belgium (strict lockdown) to Netherlands (weak lockdown) :
– again, no significant difference between those countries with respect to Tot cases / 1M Pop.”
How are the two populations BEHAVING?
Belgium
Travel to retail DOWN 79%
Netherlands:
Travel to retail, DOWN 88%
This is quite simple
The AXE you are using to chop data ( hard lock versus weak lock )
is a DULL AXE.
it doesn’t look at what matters; COMPLIANCE with the lockdown and actual behavior
Belgium: Travel to grocery store -25%
Netherlands Travel to grocery store -33%
parks?
Belgium down 20%
Nethrlands down 75%
Train stations
Belgium Down 60%
Netherlands Down 82%
Work
Belgium Down 47%
Netherlands Down 58%
time spent at home
Belgium Up 20%
Dutch up 24%
In every category of travel the Dutch are moving around less in their “weak lock down” than
the Belgians are with their hard lock
I really wish people would understand that looking at
national POLICY tells you NOTHING ABOUT PEOPLES ACTUAL BEHAVIOR
Belgians with a “hard” lockdown are moving about more than the dutch who have a weaker lockdown
Great point. Thanks
PS. Given that China is artificially keeping numbers low and the USA is artificially raising them I wonder about all the assumptions and policies because GIGO. The data from those 2 countries is not something you can use IMHO.
I have been sure it is not what leaders make for policy, it is how people are behaving.
People were isolating and making decisions before any lockdowns were decreed.
Some percentage of people are doing whatever they can to not get sick, because no one wants to get viral pneumonia.
Not wanting to get really sick is not panic and is not irrational.
Survival, personal survival, is as rational as it gets.
When people perceive that danger is past, that is when things will get back to normal.
When it is clear that one or more treatments are working, they are available to anyone who gets a bad case…that, I predict, is when the perception of personal danger will change.
And that is when behavior will change.
Study results will be coming.
There are a lot of studies going on, lots of people getting many different treatments.
Plasma may be one that works, and as more and more people recover, and if it turns out they have plasma which will cure, there will be more recovered people than sick people.
Plasma will likely work for the not severely sick yet.
Remdesivir may be working for people who are severely ill.
IL-6 blockers may be a part of the more effective treatments.
Perhaps some others, and more will be coming.
Malaria drugs are still not proven.
The trickles of data are not, so far at least, matching up with assertions of mazing efficacy.
We can hope that large numbers will show good results, but so far there is little to suggest anything spectacular.
One recent item: Lupus and other patients CAN and ARE getting ‘Rona:
https://techstartups.com/2020/04/19/hydroxychloroquine-autoimmune-drugs-not-fully-effective-protecting-coronavirus-early-data-compiled-global-rheumatology-alliance-shows/
Petit_Barde April 18, 2020 at 6:50 pm
Starts off with an outright lie by ommission.
“With respect to lockdown, comparing Sweden to Norway with respect to the total confirmed cases relative to the population (Tot cases / 1M Pop):
– no significant difference between those two countries.”
By using total confirmed cases which relies totally on the number of tests conducted hides the truth.
Sweden deaths/M = 150
Norway deaths/M = 30
Now when I went to school 30 has never equalled 150.
Mortality is 5 times higher in Sweden.