


(Photo credits: NOAA)
By WUWT regular “Just The Facts”
Your help is needed in building the new WUWT “Extreme Weather” Reference Page. My recent article A Big Picture Look At “Earth’s Temperature” – “Extreme Weather” Update appears to have struck a cord with some of our Warmist friends, as I earned an “Extreme Denial” label from Tamino.
Apparently Tamino took issue with the fact that I only debunked the “Climate Change” = “Extreme Warming” meme from one angle, i.e. by showing that little if any warming has occurred over the last 15 years, thus claims that “Extreme Weather” has recently “arrived” and become “the new normal” are unfounded and erroneous. Tamino seemed disappointed that I had not attempted to debunk claims that there’s been a “dramatic increase in weather-related catastrophes”. He offered in support of this claim, an insurance company’s marketing materials and 3 charts (1, 2, 3) from the United States, which represents less than 2% of Earth’s surface area. Not particularly compelling.
I will address Tamino’s charts in further detail below, but the first order of business is to see if we can figure out whether there has been a “dramatic increase in weather-related catastrophes” and “Extreme Weather”. As such, I’ve created the WUWT “Extreme Weather” Reference Page and populated it with all of the credible 3rd party data on weather extremes that I am aware of. I am sure there’s more. Please post links to any credible data sources on weather extremes below or in comments of the WUWT “Extreme Weather” Reference Page, and we’ll review them for inclusion on the “Extreme Weather” reference page.
The credible global weather extremes charts I have found thus far are as follows:
Tropical Cyclones
Global Tropical Cyclone Accumulated Cyclone Energy (ACE)y – 1971 to Present
y - 1971 to Present")
Global Tropical Cyclone Frequency- 1971 to Present

Global Hurricane Frequency – 1978 to Present

Precipitation/Drought
Global Precipitation

Global Palmer Drought Severity Index (PDSI)

Tornadoes
US Strong to Violent Tornadoes (EF3-EF5) – 1950 to Present chart;

is also significant as “Tornado researcher Tom Grazulis estimates that about 75 percent of the world’s tornadoes occur in the United States.” Chicago Tribune However, this may be misleading in that “many countries do not keep records of their tornadoes. The actual number of tornadoes outside the U.S. is not known.” Answers.com
If you are aware of any other global or semi-global weather extremes charts from credible data sources, please post them in comments.
Returning to the charts that Tamino thinks I am in “Extreme Denial” of, the first chart Tamino offers is from the marketing materials of German Insurer Munich RE:

Munich RE is “one of the world’s leading reinsurers” “with income from reinsurance premiums alone at nearly €26.5bn (2011)”. Their “What we do” section begins with, “What happens if the sea level rises by one metre? How do offshore wind farms affect risks in the shipping business?” Furthermore, if you look at this Munich RE marketing press release from November 11, 2011, you’ll see that they have a clear financial interest in marketing and promoting the “Extreme Weather” meme:
Over the last 30 years, Asia Pacific has experienced more than 50% of all fatalities from natural catastrophes, almost 40% of all economic losses but less than 9% of the insured losses.
This shows the urgent need for wider natural catastrophe insurance coverage. This can be met through a variety of measures, from traditional insurance and reinsurance, to public-private partnerships or pooling of natural catastrophe risks nationwide.
Munich Re has the expertise and experience, and is discussing natural catastrophe schemes with governments all over Asia. The support can be twofold: on the one hand, driving the discussion in greatly exposed economies to structure country-wide solutions; on the other, finding solutions for governmental infrastructure assets such as roads and bridges. Munich RE
Clearly Munich RE has a significant financial interest in “discussing natural catastrophe schemes with governments”, thus it’s marketing materials cannot be considered a credible source for unbiased scientific data. It would be akin to a skeptic posting a temperature chart from Exxon Mobil, laughable.
This Federal Emergency Management Agency (FEMA) Disasters Declared chart is the second undeniable plot Tamino posted:

However, it appears more indicative of changes to the “disaster declaration” criteria versus a change in weather extremes, i.e.:
“FEMA was established under the 1978 Reorganization Plan No. 3, and activated April 1, 1979, by President Jimmy Carter in his Executive Order 12127″ Wikipedia.
“A review of data for a seven-year period from 1988 to 1995 reveals that large expenditures, as funded by supplemental bills, relate to declarations issued for the largest events. During this time period, disaster declarations were made for Hurricane Hugo, the Loma Prieta earthquake, Hurricane Andrew, the Midwest floods of 1993, and the Northridge earthquake. However, these were not the only events deemed worthy of presidential action and of cost to the federal treasury.”
“But like the tail of a comet, over 200 other declarations accounted for one quarter of such outlays, many of them of relatively minute cost and extent. While of lesser impact on the national treasury, such “low end” declarations have become, to some observers, new sources of federal spending at the local level, long referred to in other contexts as “pork barrel spending.” Congressional Research Service
“In 1996, the agency was elevated to cabinet rank.” which correlates well with the spike in Disasters Declared in the second half of the 1990s. Furthermore, if you look at this 2011 FEMA list of 99 “Major Disasters” versus these lists from 1958 and 1959 with 7 “Major Disasters” each, it seems apparent that the FEMA data is biased by changes in disaster declaration criteria, e.g. “events deemed worthy of presidential action and of cost to the federal treasury”. As such the FEMA Disaster Declaration data is not a credible proxy for “Extreme Weather”.
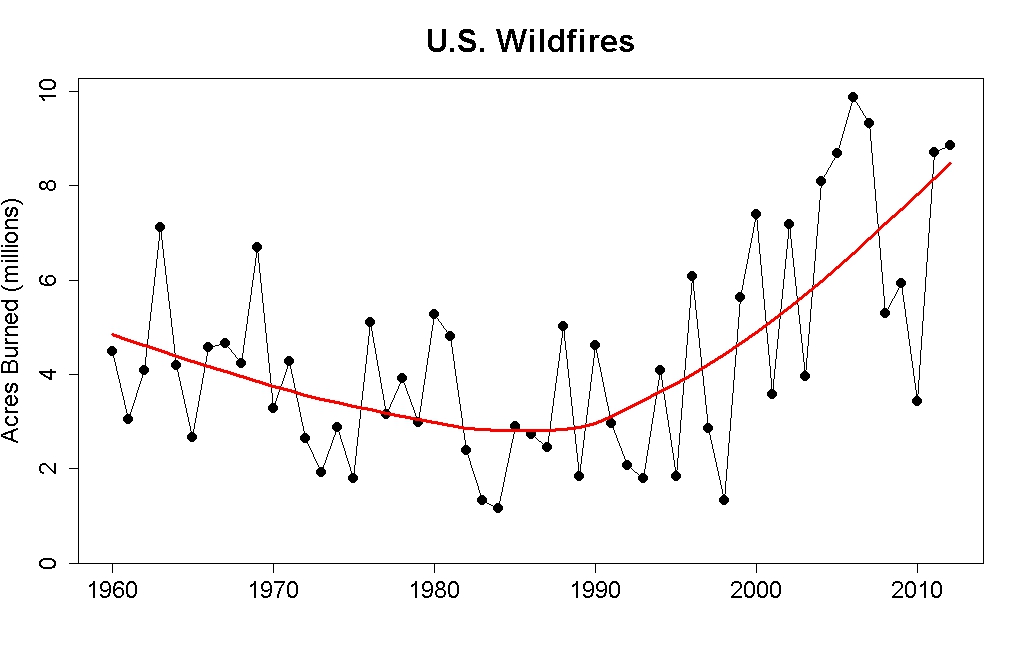
Third Tamino’s posted this US Wildfire chart;

however, it only shows Acres Burned, whereas the following chart shows the US Acres Per Wildfire and the Number of Wildfires Per Year:

This is an important distinction as the associated article elaborates:
This graph shows the inverse relationship between numbers and sizes of US wildfires over time. Note the greater number and smaller sizes of fires between the creation of Wilderness in 1964 and the beginning of the modern wildfire era in 1987 and 1988 (with Silver Complex and Yellowstone fires of those years), as compared with the smaller number and greater size of recent fires. One factor may be the shift in USFS policy from rapid suppression to “let it burn,” which has allowed for numerous smaller fires – previously extinguished individually — to coalesce into larger fires and singular complexes.Evergreen
For reference;
“Forest managers agree that the current fire risk is primarily a combination of two factors — higher-than-average temperatures and a profusion of fuel, the product of nearly a century of fire suppression policies.”
“Recognizing widespread overgrowth in American forests, in the late 1970s the Forest Service began reintroducing policies of prescribed burning and allowed many smaller, natural fires to burn out on their own, provided they didn’t threaten lives or property. The decision this summer to attack all fires, while not a direct reversal of this policy, does represent a departure from that practice of natural restoration, said Jennifer Jones, a public affairs specialist with the Forest Service. Scientific America
The shift in thinking was formalized in a 1995 statement of federal fire policy, and strengthened in a 2001 revision. The policy recognizes that fire is “an essential ecological process,” and that decades of trying to keep fires from burning have led, ironically, to “larger and more severe” conflagrations because of the buildup of underbrush and other fuel. USA Today
As such, US Forest Fire data is biased by “nearly a century of fire suppression policies” and “the shift in USFS policy from rapid suppression to ‘let it burn,'”, which begin “in the late 1970s”, “was formalized in a 1995 statement of federal fire policy, and strengthened in a 2001 revision.” US Forest Fire data is not a credible proxy for “Extreme Weather.”
Finally, Tamino offers this NOAA Extremes in 1-Day Precipitation chart;

which is relevant, but it is only illustrates the “Contiguous U.S.”, which is just “1.58% of the total surface area of the Earth” and the chart ends in 2011. Fortunately, this NOAA Extremes in 1-Day Precipitation – 1910 to Present – Year to Date chart;

shows the full US, which is at least closer to 2% of Earth’s surface area, whatever that means, and the chart is current through October 2012, so it shows the drop in Extremes in 1-Day Precipitation that has occurred during 2012. This Extremes in 1-Day Precipitation chart was one of a number US climate extreme charts that were already included in the WUWT US Climatic History Reference Page, which I’ve now added, along with an array of other US centric weather extreme charts, to the WUWT “Extreme Weather” Reference Page
Tamino didn’t do so well supporting claims that there’s been a “dramatic increase in weather-related catastrophes”, “Extreme Weather” has “arrived” and is now the “new normal”. Perhaps you can do better? Please post all credible charts on weather extremes in comments and we will review for inclusion on the WUWT “Extreme Weather” Reference Page. Thank you in advance for your assistance.
Please note that WUWT cannot vouch for the accuracy of the data/graphics within this article, nor influence the format or form of any of the graphics, as they are all linked from third party sources and WUWT is simply an aggregator. You can view each graphic at its source by simply clicking on it.
Mark Ro says: November 23, 2012 at 12:18 pm National Oceanic and Atmospheric Administration (NOAA) – Storm Prediction Center- Click the pic to view at sourceUnited States (US) Weather Extremes[/caption]
http://www.spc.noaa.gov/wcm/torgraph-big.png
NOAA’S Inflation Adjusted Annual Tornado Running Total ??
Yes, added under Tornadoes:
US Inflation Adjusted Annual Tornado Trend and Percentile Ranks
[caption id="" align="alignnone" width="578"]
Thank you
Anthony: These have references to Canadian wild fires. Number and Acres (hectares) are falling.
http://www.ciffc.ca/index.php?option=com_content&task=view&id=27&Itemid=29
This has a number of charts.
http://www.ciffc.ca/firewire/current.php
This has a table at the bottom, with the 5, 10, 15, 20 and 25 year average for numbers and area.
The 5 year average is the lowest in the record.
On Boreal forest fires.
and
and
and
Enough of observations in a warming world since the end of the Little Ice Age. How about some future speculation eh???
Yeah, right. Observations win every time my friends. We really need a Journal of Future Speculation Driven By Prospect Of Future Funding.
Bob Shapiro says: November 23, 2012 at 12:45 pm
What is Munich Re’s definition of a Weather Catastrophe? If it’s a dollar amount, then maybe it’s a moving target that should be adjusted for inflation and population density.
According to this document;
http://www.munichre.com/app_pages/www/@res/pdf/NatCatService/great_natural_catastrophes/NatCatSERVICE_Great_1950_2011_definition_en.pdf
That document, along with an array of other Munich RE marketing materials can be found in their “Business & Solutions Online Flyer”:
http://www.munichre.com/en/reinsurance/business/non-life/georisks/natcatservice/great_natural_catastrophes.aspx
sorry, justthefacts, I should have read the byeline.
[snip. Labeling others as being in “dnial” violates site Policy. — mod.]
On tornadoes. [my bold]
When it comes to weather and extreme events , the ‘default’ postion being taken by the alarmists seems to be ‘it must be due to global warming’ whether it is true or not . If you cannot explain it , it must be due to man made green house gases. It is the only game in town for them since they got the co2 level rise causing unprecedented warming argument or claim so wrong . I recall during the past several winters ,when there was the slight rise in the number of snowstorms coming up the US east coast, they blamed it on global warming. Yet very few went back and checked the record . During the winter of 1740/1741 there were 23 strong snow storms in New England . During 1747/1748 winter there were 30 snow storms.[ per Perley2001] and the Climate 4You web page. Snow depths reached 3 meters . Yet the alarmists continue to blame every weather event ever so slightly bigger on climate change due to global warming . Some of Greenland glaciers are melting .It must be due to global warming caused by man . Greenland ice core records[gisp2] show that there were major warming periods in Greenland every 1000 years for the past 9000 years ..European winters are getting warmer . Yet the European winter temperatures have been flat for 20 years now , fluctuating yes, but the trend is flat and even cooling since 2007.. The best approach to counter this massive misinformation being spread in the name climate science can only be accomplished by immediately publishing the truth as is being done by this web page. Good work Anthony.
When it comes to weather and extreme events , the ‘default’ postion being taken by the alarmists seems to be ‘it must be due to global warming’ whether it is true or not . If you cannot explain it , it must be due to man made green house gases. It is the only game in town for them since they got the co2 level rise causing unprecedented warming argument or claim so wrong . I recall during the past several winters ,when there was the slight rise in the number of snowstorms coming up the US east coast, they blamed it on global warming. Yet very few went back and checked the record . During the winter of 1740/1741 there were 23 strong snow storms in New England . During 1747/1748 winter there were 30 snow storms.[ per Perley2001] and the Climate 4You web page. Snow depths reached 3 meters . Yet the alarmists continue to blame every weather event ever so slightly bigger on climate change due to global warming . Some of Greenland glaciers are melting .It must be due to global warming caused by man . Greenland ice core records[gisp2] show that there were major warming periods in Greenland every 1000 years for the past 9000 years ..European winters are getting warmer . Yet the European winter temperatures have been flat for 20 years now , fluctuating yes, but the trend is flat and even cooling since 2007.. The best approach to counter this massive misinformation being spread in the name climate science can only be accomplished by immediately publishing the truth as is being done by this web page. Good work Anthony.
Please consider adding the following as a crowdsource reference – Southern California Rainfall from 1769 to 2000. I submitted this reference earlier in response to Dr. John Christie’s WUWT February 2, 2012 WUWT article at
http://wattsupwiththat.com/2012/02/18/christy-on-sierra-snowfall-over-the-last-130-years-no-trend-no-effect-from-co2/
My response was posted as follows.
Neil Jordan says:
February 18, 2012 at 1:00 pm
Dr. Christy: Thank you for your effort in bringing old records to light. There is another set of California records going back to 1769
that you might consider, related to the “Lynch Index” that was in the California Weather Sumary CD. Jim Goodridge sent me a California
Weather CD in 2002 that contained the file “Lynch Index.xls” that tabulates Southern California rainfall from 1769-1770 to 1999-2000.
The CA Weather CD updated to 2009 does not appear to have that file. The state climatologist at
http://www.water.ca.gov/floodmgmt/hafoo/csc/ might provide some information.
The Lynch Index was based on the August 1931 report, “Rainfall and Stream Run-Off in Southern California Since 1769″ by H. B. Lynch,
for the Metropolitan Water District of Southern California. The report is available on-line at
http://cepsym.info/history/RainfallStreamRunoffSoCA_since1769.pdf
and
http://books.google.com/books/about/Rainfall_and_stream_run_off_in_Southern.html?id=sJMJAQAAIAAJ
The Lynch Index spreadsheet correlates the index from the 1931 report with the rainfall record for Los Angeles. The index stops at 1930, and DWR did an extension to 2000. I did a linear regression analysis on the data, and also an extension (ref Bedient & Huber) of the data to present. Slopes of the regression lines are close to zero.
Moderators: The following text is verbatim from the spreadsheet. Truncate if it does not fit within your format and perhaps I can provide the information another way.
Thank you.
6.698624097
Lynch Year LA Rain Los Angeles
155 1770 23.14 1
125 1771 18.66 2
145 1772 21.65 3
110 1773 16.42 4
115 1774 17.17 5
90 1775 13.44 6
135 1776 20.15 7
75 1777 11.20 8
75 1778 11.20 9
125 1779 18.66 10
135 1780 20.15 11
125 1781 18.66 12
55 1782 8.21 13
65 1783 9.70 14
115 1784 17.17 15
110 1785 16.42 16
75 1786 11.20 17
90 1787 13.44 18
75 1788 11.20 19
135 1789 20.15 20
10 1790 1.49 21
90 1791 13.44 22 0.318
115 1792 17.17 23 0.338
85 1793 12.69 24 0.339
65 1794 9.70 25 0.342
65 1795 9.70 26 0.345
95 1796 14.18 27 0.347
65 1797 9.70 28 0.348
55 1798 8.21 29 0.350
115 1799 17.17 30 0.352
85 1800 12.69 31 0.355
95 1801 14.18 32 0.361
73 1802 10.90 33 0.397
80 1803 11.94 34 0.410
125 1804 18.66 35 0.407
75 1805 11.20 36 0.405
125 1806 18.66 37 0.422
65 1807 9.70 38 0.426
75 1808 11.20 39 0.432
65 1809 9.70 40 0.443
115 1810 17.17 41 0.448
155 1811 23.14 42 0.446
110 1812 16.42 43 0.416
85 1813 12.69 44 0.415
110 1814 16.42 45 0.415
195 1815 29.11 0.414
85 1816 12.69 0.410
155 1817 23.14 0.426
135 1818 20.15 0.441
135 1819 20.15 0.435
85 1820 12.69 0.432
145 1821 21.65 0.446
65 1822 9.70 0.450
65 1823 9.70 0.455
65 1824 9.70 0.450
220 1825 32.84 0.446
45 1826 6.72 0.451
65 1827 9.70 0.447
75 1828 11.20 0.456
35 1829 5.22 0.450
75 1830 11.20 0.444
55 1831 8.21 0.438
45 1832 6.72 0.438
165 1833 24.63 0.438
120 1834 17.91 0.452
110 1835 16.42 0.452
105 1836 15.67 0.459
95 1837 14.18 0.444
100 1838 14.93 0.443
145 1839 21.65 0.467
210 1840 31.35 0.482
40 1841 5.97 0.493
145 1842 21.65 0.491
65 1843 9.70 0.490
45 1844 6.72 0.483
65 1845 9.70 0.477
70 1846 10.45 0.470
135 1847 20.15 0.452
110 1848 16.42 0.450
75 1849 11.20 0.448
135 1850 20.15 0.444
60 1851 8.96 0.432
95 1852 14.18 0.427
125 1853 18.66 0.424
100 1854 14.93 0.428
120 1855 17.91 0.424
85 1856 12.69 0.429
45 1857 6.72 0.429
85 1858 12.69 0.431
65 1859 9.70 0.436
125 1860 18.66 0.439
90 1861 13.44 0.480
220 1862 32.84 0.472
40 1863 5.97 0.458
50 1864 7.46 0.459
95 1865 14.18 0.453
110 1866 16.42 0.439
135 1867 20.15 0.455
140 1868 20.90 0.451
110 1869 16.42 0.456
55 1870 8.21 0.461
50 1871 7.46 0.468
75 1872 11.20 0.469
80 1873 14.84 0.470
129 1874 23.78 0.468
92 1875 18.93 0.482
143 1876 26.07 0.498
38 1877 5.54 0.510
124 1878 21.26 0.507
54 1879 11.35 0.499
118 1880 20.34 0.495
71 1881 13.13 0.497
69 1882 10.40 0.497
68 1883 12.11 0.494
240 1884 38.18 0.475
61 1885 9.21 0.462
147 1886 22.76 0.449
90 1887 13.82 0.451
118 1888 13.76 0.450
134 1889 19.78 0.457
206 1890 34.32 0.460
109 1891 13.33 0.462
79 1892 11.80 0.451
158 1893 26.27 0.438
49 1894 7.47 0.434
123 1895 15.37 0.434
62 1896 8.54 0.441
119 1897 16.83 0.447
50 1898 7.15 0.442
41 1899 5.51 0.424
64 1900 7.90 0.431
117 1901 16.41 0.442
72 1902 10.48 0.452
137 1903 19.75 0.450
61 1904 8.74 0.443
137 1905 19.07 0.447
134 1906 18.75 0.398
152 1907 19.20 0.394
88 1908 13.02 0.391
140 1909 17.92 0.390
95 1910 12.64 0.392
121 1911 17.36 0.391
82 1912 10.37 0.345
81 1913 13.45 0.346
163 1914 23.63 0.351
120 1915 17.04 0.342
131 1916 20.69 0.332
100 1917 14.49 0.333
92 1918 14.53 0.377
66 1919 9.20 0.381
97 1920 11.27 0.369
103 1921 14.23 0.350
150 1922 19.04 0.344
72 1923 10.14 0.349
53 1924 6.12 0.345
64 1925 7.94 0.358
115 1926 17.56 0.361
119 1927 17.76 0.366
69 1928 9.77 0.378
76 1929 12.98 0.391
82 1930 11.21 0.395
1931 12.78 0.397
1932 16.83 0.397
1933 11.75 0.397
1934 14.68 0.397
1935 21.63 0.400
1936 12.02 0.410
1937 22.35 0.418
1938 23.44 0.432
1939 18.74 0.434
1940 13.54 0.438
1941 35.60 0.443
1942 11.80 0.439
1943 19.65 0.439
1944 18.78 0.442
1945 10.87 0.436
1946 11.07 0.434
1947 13.08 0.434
1948 7.00 0.438
1949 7.73 0.450
1950 10.65 0.444
1951 7.47 0.442
1952 26.98 0.439
1953 9.76 0.443
1954 13.07 0.447
1955 12.79 0.462
1956 18.17 0.461
1957 10.66 0.466
1958 23.37 0.471
1959 6.13 0.475
1960 9.37 0.495
1961 5.59 0.506
1962 21.46 0.508
1963 10.88 0.478
1964 7.12 0.490
1965 15.57 0.494
1966 18.92 0.503
1967 22.84 0.511
1968 15.72 0.506
1969 27.81 0.505
1970 7.77 0.500
1971 12.09 0.499
1972 7.43 0.496
1973 21.14 0.487
1974 14.92 0.483
1975 14.35 0.489
1976 10.12 0.495
1977 11.67 0.497
1978 31.57 0.498
1979 19.29 0.522
1980 26.46
1981 8.98
1982 11.53
1983 33.63
1984 8.28
1985 12.38
1986 19.82
1987 5.61
1988 12.47
1989 8.34
1990 7.02
1991 16.03
1992 20.86
1993 27.36
1994 8.11
1995 24.37
1996 12.44
1997 12.85
1998 30.57
1999 9.08
2000 11.79
Average 15.02
1884 Max 38.18
1790 Min 1.49
Count 230
I don’t know why some insurance companies are so interested in the climate.
BusinessGreen 3 April 2009
“Insurers seize climate change opportunity with over 600 new products”
[my bold]
Catlin Arctic Survey sponsored by Catlin Insurance
“…I earned an ‘Extreme Denial’ label from Tamino.”
———————————————————————
Excellent! Wear it with pride 🙂
As wealth grows, so do the potential losses from any type event.
We have certainly grown wealthier “globally” over the last 50 years.
I found this an interesting interactive graphic.
http://ngm.nationalgeographic.com/2011/03/age-of-man/map-interactive
Chris B says: November 23, 2012 at 12:55 pm
How about Earthquakes? ( Graph at bottom)
http://www.johnstonsarchive.net/other/quake1.html
Earthquakes have very little to do with weather, i.e. weather is “the state of the atmosphere with respect to wind, temperature, cloudiness, moisture, pressure, etc.”
http://dictionary.reference.com/browse/weather
It is noteworthy that;
and :
As such, while I don’t think that Earthquakes belong on the “Extreme Weather” Reference Page. I did add both charts; Wm. Robert Johnston – JohnstonArchive.net – Click the pic to view at source[/caption]

Annual Energy Release in Earthquakes Magnitude 6.0 or Greater:
[caption id="" align="alignnone" width="564"]
Annual Worldwide Earthquake Deaths, Per Million Population:
to the draft WUWT Earthquake Reference Page.
Thank you
Now I know why the insurance industry is interested in the ‘weatherclimate’
PreventClimateChange was founded by John Rowlinson, the founder of PtS who are into property. Mr Rowlinson should get out of property sales as each sale promotes co2 output. Get off the grid and give your money to the ‘sinking’ Pacific islanders. He sounds like a Gore clone – do as I say and don’t do as I do.
http://www.pts.co.uk/
http://www.preventclimatechange.co.uk/aboutoursite.html
How do these idiots propose we prevent climate change????
Reduce our trace rise of the trace gas co2 (which has already done most of the warming that it can by itself)??? Bollocks. Positive feedback I’m still waiting after over 15 years of steady co2 output and a standstill in global mean temps.
Data is the enemy of warmest orthodoxy.
Warmist. Another auto spell crime.
justthefactswuwt says:
“Earthquakes have very little to do with weather, …”
To the extent that deep underground water can lubricate a fault line so that slippage occurs before more tension can build, there might be a low correlation between increased precipitation and more frequent, but less catastrophic earthquakes. Does anyone know of any research done on this?
Its worth repeating that a Munich Re employee (now ex-employee) was one of the climate “scientists” at the “28gate” meeting, that was cited by the BBC as their shameful justification for abandoning their Charter duty to remain unbiased with respect to AGW.
From
http://www.theregister.co.uk/2012/11/19/the_virus_that_ate_the_bbc/page3.html
Helen Boaden, the BBC’s director of news said she was particularly impressed by the testimony of a representative of the insurance industry at the 2006 seminar. For Boaden, this attendee’s belief that cost of climate change will increase carried enormous weight. This is an odd statement: since profit-seeking insurance companies pocket revenue from premiums, they materially benefit from the higher premiums that accompany predictions of catastrophic climate change. Without the warnings of catastrophe, there is no need for higher premiums, so it’s not an impartial observation.
It was an extraordinary thing to say. An accomplished and experienced factual editor, Boaden has first-hand experience of large corporate lobbying, and works for an organisation suspicious of big business. Yet for that moment, she suspended her judgement. It was the climate virus attacking, once again. Insurance company Munich Re set up a climate division and published some wildly alarming material before being disbanded this year.
And now we know who the “insurance man” was. He was actually a former insurance man called Andrew Dlugolecki, who was attached to the Climatic Research Unit at the Univesity of East Anglia. Tyndall director Mike Hulme described him as a lone gun: “An independent consultant close to the insurance and investment communities.” In 2002 he was promoting climate work sponsored by the UN Environment Program (UNEP), the IPCC’s parent, at the BBC.
http://www.ec.gc.ca/ouragans-hurricanes/default.asp?lang=en&n=23B1454D-1
Unnamed (October 28 to November 2, 1991)
The Storm
A strong extratropical low formed off the coast of Nova Scotia on October 28, 1991. The low moved southward and developed into an extratropical storm 625 kilometres south of Halifax. This storm made a counter clockwise loop and moved northeastward through Nova Scotia and Prince Edward Island. Meanwhile, out in the Atlantic on October 29th, a cold front encountered a dissipating Hurricane Grace and the storm weakened quickly. A new circulation was visible on the GOES photographs late on October 29th forming an extratropical low pressure centre. Moisture that was previously associated with Hurricane Grace moved north-northeastwards and combined with the new low pressure centre. At 1200 UTC on October 30th, this new storm reached its maximum intensity of approximately 975 millibars. At 0355 UTC on October 30th, a buoy 425 kilometres south-southeast of Halifax reported a peak wave height of 30.5 metres. This represents the highest wave height ever measured on the Scotian Shelf. The 30.5 metre max waves reported represent the physical limitations of the instruments on the buoy. The buoy was incapable of reporting a bigger number, so undoubtedly, the max waves were actually bigger.
After reaching peak intensity as an extratropical system, the low turned southward and the central pressure rose to 998 millibars on November 1st. This movement to the south brought the low over the warm waters of the Gulf Stream. At 1200 UTC on November 2nd, the storm was declared by the U.S. National Hurricane Centre to be of hurricane strength. The cyclone accelerated northeastward on November 2nd encountering the much colder waters of the continental shelf and began to weaken rapidly. By the time it reached the Nova Scotia coast near Halifax at 1400 UTC, its maximum sustained winds had diminished to near 40 knots.
Naming This Storm
By the time the tropical system had formed on November 2nd, the extratropical system was on the wane and conditions were improving on the coasts. It was felt by the Canadian Hurricane Centre and the U.S. National Hurricane Centre that naming or re-naming this storm would cause major confusion on the part of the media and the public. The storm is now referred to by meteorologists as ‘The Perfect Storm’, ‘The Unnamed Storm’, and ‘The Hallowe’en Storm’.
Damage
The Hallowe’en 1991 storm caused widespread damage along most of the east coast of North America from Florida to Newfoundland. Many boats, wharves, and seaside properties were damaged or destroyed. Beaches suffered extreme erosion and coastal roads were flooded and damaged. Four incidents took place offshore including the tragic loss of the Andrea Gail, a U.S. swordfishing boat whose normal fishing ground is near 44° North 56° West. On the 31st, she was reported overdue. In the ensuing search, debris from this vessel was found at Sable Island and the crew members were presumed drowned.
(Sandy Shmandy)
http://www.thestormking.com/Weather/Sierra_Snowfall/sierra_snowfall.html
..might be interesting to compare to other areas as well.
[“Denial blogs”? You don’t learn, do you? Read the site Policy for guidance. — mod.]
Michael says: November 23, 2012 at 1:47 pm
http://www.parc.ca/saskadapt/adaptation-options/theme-assessments/water-drought
The information on this site is provided by PARC Prairie Adaptation Research Collaborative whose motto is “climate science informing action”. A statement in the body of the work, “global climate scenarios suggest that we will experience deeper and longer droughts in the future” is contradicted by their own graph showing that the 3 most severe droughts in the past occurred between 1480 and 1570. The drought conditions of the 1930’s and 1980’s pale in comparison.
I’m afraid that the world of climate science is chock-full of this kind of logic. The information that they have in their own possession seems to hold little value when a larger more alarmist narrative has to be told.