By Joe Bastardi, Weatherbell Analytics
When the PDO turned cold, most of the meteorological and climate community understood that the pattern was turning very similar the last time of the PDO reversal, the 1950s, and it was a matter of time before the global temperatures, which have leveled off, would start falling in the same herby jerky fashion they had risen when the PDO turned warm at the end of the 1970s. I am not going to rehash the sordid details of how the AGW crowd simply ignores the major drivers of a cyclical nature. We all know that. Nor am I going to question them as to why they believe a trace gas like CO2 (needed for life on the planet) with a specific gravity of 1.5 as compared to the atmospheres 1.0, was going to mix with air in a way to affect the earth’s temperatures. Instead I am going to drive home points I have been making since 2007 and are now dramatically validating.
The La Ninas of 2008-09 and now this one had rapid mid level temperature drops that followed their onset and this years was nothing short of the most dramatic mid tropospheric drop since the start of the millennium. It is much more plausible to believe that rapid cooling in the mid levels would have an effect at leading to extremes, rather than what the warmingistas claim, which of course is anything that happens. In any case, one very interesting level that cooled to record cold levels was 400 mb, the very levels that the so called trapping hot spots were going to show up because of CO2…again a neat trick since somehow CO2 was going to defy the laws of Gravity, since, as mentioned above, its specific gravity is higher than the atmosphere (of course even if it was, it a) has not been proven to cause warming and b) man’s contribution is so tiny as to render it a non item anyway in climate considerations.
However first came the flip in the PDO, seen nicely here on the Multivariate Enso Index chart, which clearly illustrates the colder Pacific when the earth was colder, the start of the warming period coinciding with the satellite era, and now.

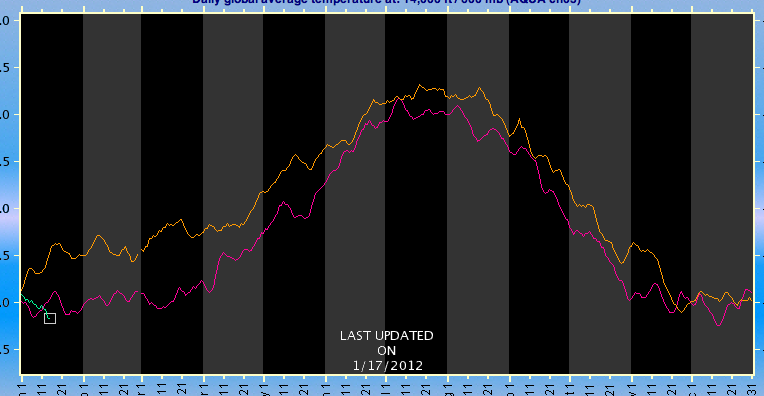
Now from the AMSU site, the amazing one year drop in temperature, the orange tan line being after the El Nino of 2009/10, the purplish line this past year and one can see the green this year, we are near record cold levels again.

600 mb (14,000 feet) (enlarged)
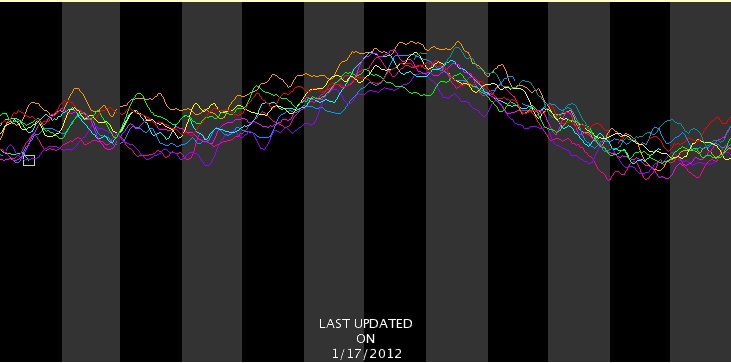
And oh my my, the trapping hot spot itself.. 400mb or 25,000 feet… coldest in the entore decade

But the 2 meter temperatures, being in the boundary layer, do not respond as fast as the ocean, or a transparent atmosphere above
Nevertheless three downturns in a jagged fashion started predictably after the last El Nino now falling again in fits and spurts through December.
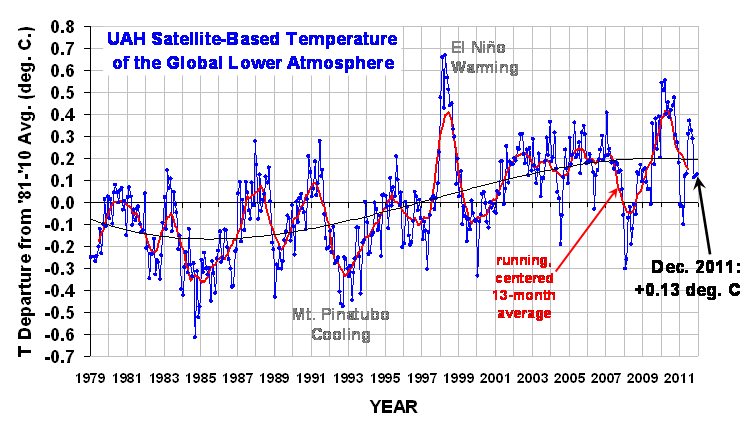
From Dr Roy Spencer’s site:

(enlarged)
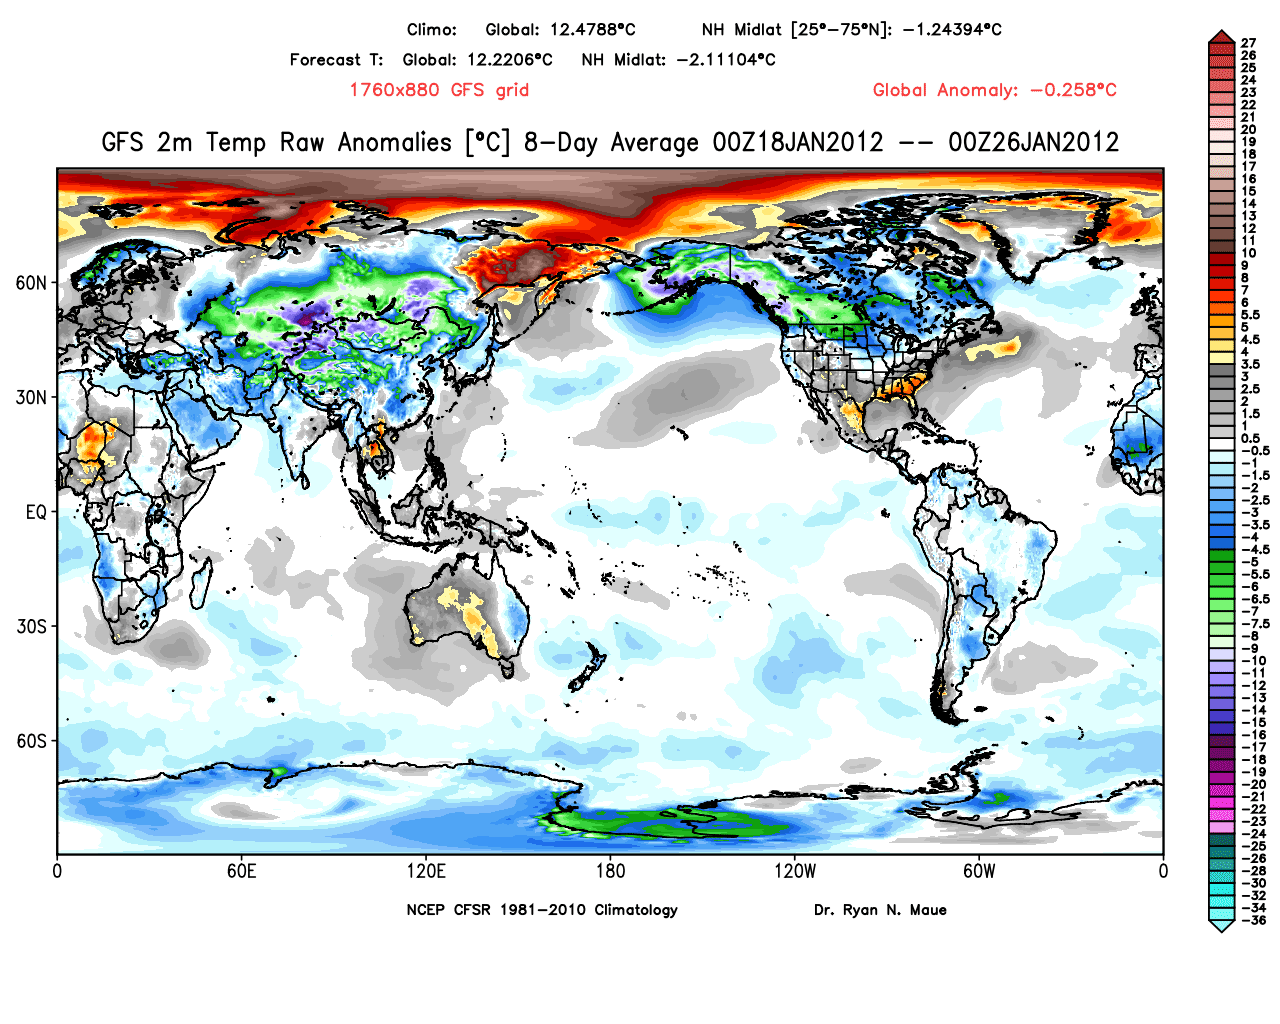
In May, I forecasted the global temperatures to fall to -0.15C in one of the months – Jan, Feb or Mar this year, and perhaps as low as levels we saw in the 2008 La Nina. A rapid free fall has begun. Dr. Ryan Maue at his site (http://policlimate.com/weather/) maintains a plethora of useful forecast information including GFS global temp projections over the next 16 days.
They have been routinely reading greater than 0.2 C below normal and I suspect the Jan reading will plummet quite a bit from December with February even lower. An example of this can be seen with these two charts off Ryan’s site,

-0.258 C globally for 2 meters. (enlarged)

Day 8.5-16 a whopping -0.352 C (enlarged)
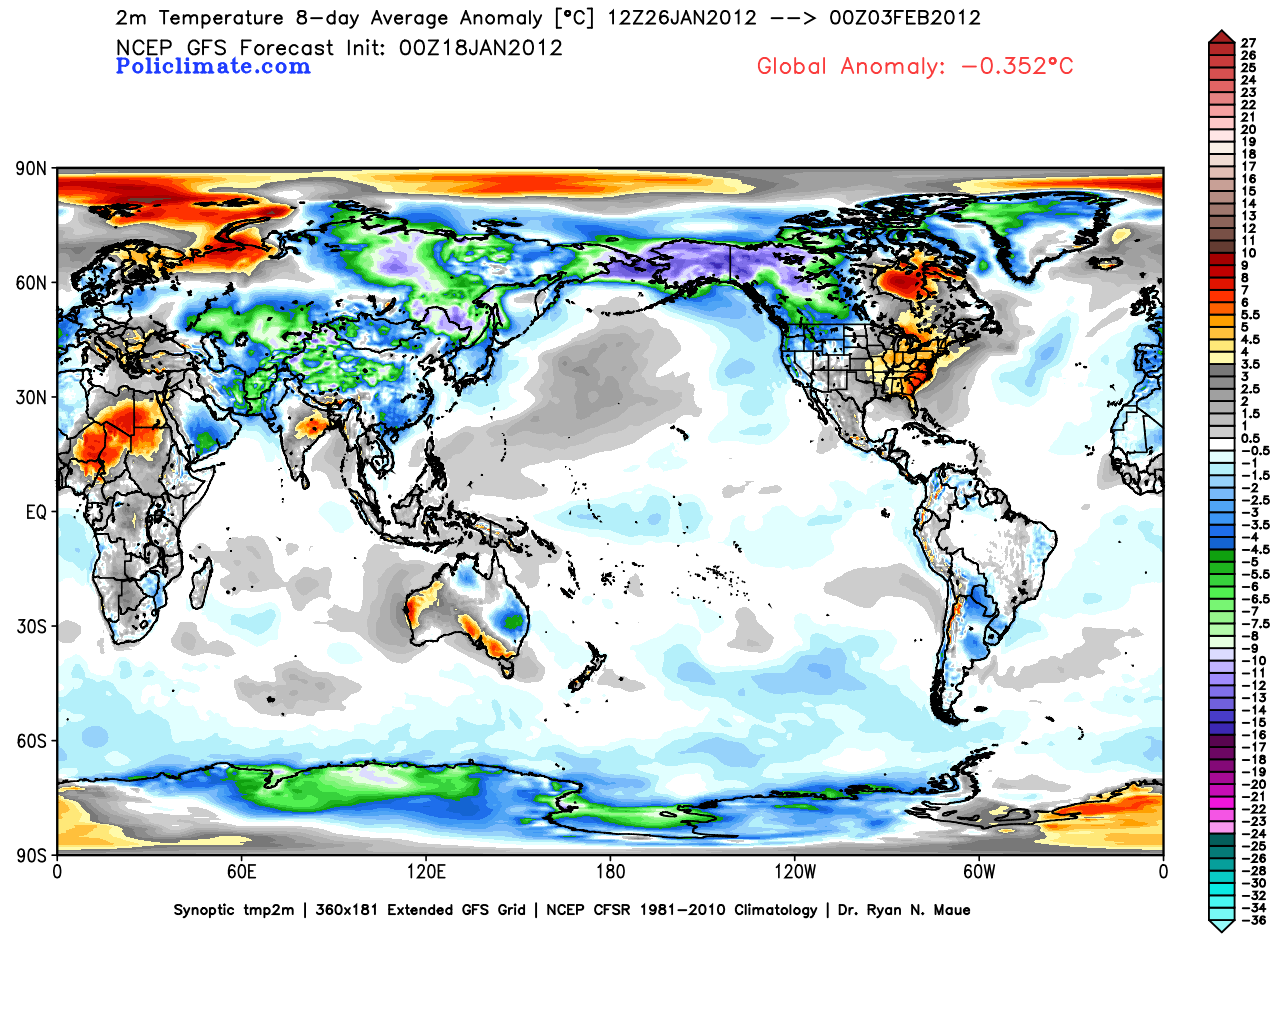
The reason the arctic looks warm is that it has been stormy, and when it’s windy the air is well mixed and so the temperatures are not as low as if it’s calm, but it’s still frigid. Notice in the second map, that the arctic cools because the arctic oscillation is starting to go negative, leading to higher pressures and lighter winds. But the most astounding aspect of this is the northern hemisphere mid latitude temperatures, at -2.1 C.
Currently, with gas so high because we are being handcuffed by an administration that won’t drill (if gas was a 1.50 lower, it would be worth a half trillion dollars to the economy) and an EPA that is causing untold economic damage (I would conservatively etiolate a half trillion dollars, from jobs lost to burdensome regulations) along with a 100 billion dollar subsidy to fight global warming world wide, it is costing each ACTUAL TAX PAYER close to 7000 dollars (1.1 trillion divided by 150 million tax payers).
One has to wonder, how even the most dogmatic of them don’t look at the actual facts, how they can continue to carry on their denial while the results of such things handcuff the American economy and cause untold misery for many as our wealth is not only redistributed, but dwindles. One can only conclude this is being done on purpose, and with purpose.
See PDF with enlarged images.
UPDATE: Bob Tisdale disagrees with portions of this analysis and has an essay here.
Erinome says @ur momisugly January 19, 2012 at 9:44 pm: “Obama is not drilling for oil? US oil production is up 2.7% from one year ago.”
The increased oil production is taking place outside of where the Obama jurisdiction, and it is primarily due to a technology developed without the Administration blessing — fracking. Even there, the Obama administration is lending support to stop the use of this private technological development. Can oil production continue to increase despite the Administration efforts? Interesting question.
Erinome says @ur momisugly “. . . why is the stratosphere cooling?”
It is hard for me to believe that a reasonable person could look at a chart of lower stratospheric temperatures over the satellite record: http://img232.imageshack.us/img232/29/lowerstratospheretemps.png , and not observe that the decrease is clustered around major low-latitude volcanic eruptions, and since the last eruption, the lower stratospheric temperatures have been mostly flat. In 1996, the average lower stratospheric temperature anomaly was -.46. In 2011, it was -.4075. That is an increase, not cooling.
Erinome says “Actually my electricity rate is the lowest it’s been in years: 6.9 cents/kWh, due to a strong emphasis on renewable power in my region.”
I have spend a good number of my years analyzing utility rates, and I still keep up on the issue. I have never seen the development of wind, solar, geothermal, . . . decrease rates. The power cost adjustments is always positive despite the huge federal and local tax subsidies. (The federal tax subsidy for wind is greater than the operating cost of a coal plant — which the wind generation typically displaces.)
It is possible to have large rate decreases in an area heavily dependent of hydro-electricity (you know, those dams that wreck havoc on salmon populations and devastate valley ecosystems). Low water levels can lead a high electric price for a couple of reasons but low electric prices can follow later when high water levels return.
By the way, that $3 per month contribution you make for green technology, means that you are funding a program so that somebody can develop wind or solar. It does not mean that “green” electrons are reaching your home.
Ammonite says:
January 21, 2012 at 1:53 am
The fact that you can hold your breath for a minute does not mean it is a good idea to live underwater.
==========================================================================
True, but that’s where you’re missing the key point. Warmth is a good thing. It always has been. Civilization, mankind, the flora and fauna ecosystems always thrives better in warm than cold. It isn’t like holding your breath, its like inhaling more fresh air.
It looks like in the next few days we are heading into the coldest days on planet earth in a decade-
http://discover.itsc.uah.edu/amsutemps/execute.csh?amsutemps
–it must be because of CO2
Smokey: Why drill for more oil if the US is now a net exporter of petroleum?
[snip. Peak oil discussion is off-topic. ~dbs, mod.]
Werner Brozack: “Under this scenario, we do not have to wait another 10 years to see 30 years of no temperature change, but we only need to wait 10 years.”
Great you are on record as saying the next 10 years. So, given the warming trend has continued unabated – and even the satellite guys keep amending their results upward – I trust we can count you as someone who understands the science well enough to be an AGW supporter (hopefully you won’t need the FULL 10 years of warming – the next El Nino will likely be a another (quote unquote) step change – ie a new floor, a new place to begin cherry picking anew, etc., etc.
Welcome the (scientific) light.
Actually Thoughtful
You have yet to post a comment that is not simple to deconstruct.
The current warming is a continuation of the planet’s natural emergence from the LIA. CO2 has had no measurable effect. And despite your statement, that warming has not accelerated. The long term trend line remains unbroken.
You also say: “…5F is 2.8C – well within the range of likely outcomes for my region. As is 8C.” Note the huge leap of faith between the spuriously predicted “2.8°C” and “8°C”. I guess a miracle occurs between those two numbers.☺
Whatever you’re trying to sell, it certainly isn’t science.
True Belief? Yes. Science? No.
Smokey–I agree. Actually there is no proof the tiny tiny blip of climate noise over the past 30yrs has anything to do with CO2:
http://wattsupwiththat.files.wordpress.com/2009/12/noaa_gisp2_icecore_anim3.gif
As we continue to recover from the last ice age:
http://pielkeclimatesci.wordpress.com/2010/12/27/guest-post-the-continuing-recovery-from-the-little-ice-age-by-syun-ichi-akasofu/
James Sexton says:
Warmth is a good thing. It always has been. Civilization, mankind, the flora and fauna ecosystems always thrives better in warm than cold. It isn’t like holding your breath, its like inhaling more fresh air.
Perhaps on average — across the entire globe, across all species, across all human societies, and across a large span of time.
So what?
The question of climate change is about adjustment to new climates, and that occurs on local area, on the level of individual species, individual cultures, and decadal lifetimes.
Your point paints far too broad a picture — the broadest imaginable. But individual species don’t live on that canvas — we live on the one we’ve gotten used to and built our current civilization on.
Bob B says:
Actually there is no proof the tiny tiny blip of climate noise over the past 30yrs has anything to do with CO2
In fact, there is such proof:
“Increases in greenhouse forcing inferred from the outgoing longwave radiation spectra of the Earth in 1970 and 1997,” J.E. Harries et al, Nature 410, 355-357 (15 March 2001).
http://www.nature.com/nature/journal/v410/n6826/abs/410355a0.html
An Inquirer says:
It is hard for me to believe that a reasonable person could look at a chart of lower stratospheric temperatures over the satellite record: http://img232.imageshack.us/img232/29/lowerstratospheretemps.png , and not observe that the decrease is clustered around major low-latitude volcanic eruptions, and since the last eruption, the lower stratospheric temperatures have been mostly flat.
It has not been flat over the last 15 years. The linear trend of the UAH LS in that time period is -0.067 +/- 0.025 C/decade.
“Actually Thoughtful says:
January 21, 2012 at 9:49 am
So, given the warming trend has continued unabated”
….as someone who understands the science well enough”
Even Phil Jones disagrees with the first point. See:
http://news.bbc.co.uk/2/hi/science/nature/8511670.stm
“C – Do you agree that from January 2002 to the present there has been statistically significant global cooling?
No. This period is even shorter than 1995-2009. The trend this time is negative (-0.12C per decade), but this trend is not statistically significant.”
He said the above about 2 years ago and it referred to the latest 8 years. Two years have passed and it is now over 10 years that there has been no warming. I know you do not trust HadCrut3 and RSS, but this fact is true for GISS as well.
As for “….as someone who understands the science well enough” again Phil Jones agreed about identical trends since 1860:
A – Do you agree that according to the global temperature record used by the IPCC, the rates of global warming from 1860-1880, 1910-1940 and 1975-1998 were identical?
Here are the trends and significances for each period:
Period Length Trend
(Degrees C per decade) Significance
1860-1880 21 0.163 Yes
1910-1940 31 0.15 Yes
1975-1998 24 0.166 Yes
1975-2009 35 0.161 Yes
So the bottom line is that there is no proof that greatly increased CO2 since 1945 did anything unusual since 1975. If you know something Phil Jones doesn’t, I am sure he would like to know.
Smokey says:
“What I’m unhappy about, though, is the ~ 3 cents/kWh power generation via fossil fuels adds to everyone’s health costs.”
That is rank, baseless and false speculation.
It is not — it comes from:
“Hidden Costs of Energy: Unpriced Consequences of Energy Production and Use”
National Research Council, 2010
http://books.nap.edu/catalog/12794.html
This study found that US fossil fuel damages were $120 billion for 2005, and that doesn’t include climate change. The authors said it was likely a “substantial underestimate.”
Electricity generation via coal: external cost = 3.2 cents/kWh ($32/MWh), with damages due to CC of another 3 cents/kWh (for CO2e priced at $30/tonne).
Transportation damage costs = 1.2 cents per mile, at a minimum, with at least another 0.5 cents for CC.
Renewables had essentially zero external damage costs.
These are all huge subsidies received by the fossil fuel industry, and a big reason why renewables don’t, at first glance, appear competitive on the so-called “free market.”
Werner Brozek – you invoke Phil Jones and your partial quote (changing his intent). So, what does Phil Jones say now? If you want to appeal to the authority of Phil Jones and his >decade of study to become a climate scientists, and his decades of work to become an expert in climate science – it is incumbent upon you to accept his whole body of work in this area.
Anything else is just a cherry pick.
As for your tortured analysis of 1910-1940 vs 1970-2010 – your co-travelers would like to blame the quiet sun for the warming now (where it isn’t) – yet ignore the solar activity of the 1910-1940 period (where it was). A typical Orwellian opposite day approach.
We are seeing warming continue unabated during a quiet sun and La Nina conditions. What will happen when the sun returns to normal activity, and we are in an El Nino? And how will you morph your confusion to handle the new reality?
If you pull away all the tricks and games you find the world is warming and man is to blame.
Ask Phil Jones.
James Sexton says:
Actually my electricity rate is the lowest it’s been in years: 6.9 cents/kWh, due to a strong emphasis on renewable power in my region. Four years ago it was 11.1 cents/kWh, and 8 years ago, in another region, it was 16.2 cents/kWh.
=======================================================
Prove it. That’s one of the most fallacious babbling piece of misinformation I can imagine!!!
I have kept a spreadsheet of my electricity bills since June 2004. In 2011 I used 8,163 kWh and paid a total of $578.18. That’s an average of 7.1 cents/kWh. (The 6.9 cents/kWh I gave earlier was from my January bill.)
By the way, my current usage is the highest it’s been since I’ve been keeping track — partly because it’s cheaper, and partly because earlier I was living in an apartment building and my apartment did not need heat or cooling. Then I was using about 4,800 kWh/yr at an average of 8.7 cents/kWh. My region is blessed with an abundance of cheap, renewable energy, and I live rather simply.
Werner Brozek says:
Even Phil Jones disagrees with the first point. See:
http://news.bbc.co.uk/2/hi/science/nature/8511670.stm
“C – Do you agree that from January 2002 to the present there has been statistically significant global cooling?
I find that since that interview (Feb 2010) the cooling is significant. (Of course, we’ve had a strong La Nina and are now having another one.) The trend of the HadCRUT3 data from Jan 2002 is -0.080 +/- 0.028 C/decade, R^2=0.07. (I haven’t worked out the p-value yet.) But the time interval is too short to draw conclusions about climate.
Erinome – you could easily achieve the results you describe by adding wind or solar to your home (for which I salute you). But you should add in the levelized cost (to you) over the 40 years or so that renewable power source will reliably provide power.
If not that – what region do you live in? As you have noted, low power prices tend to work against minimizing electricity usage (which also points out that almost ALL of us have very easy moves to reduce our electrical consumption
James Sexton says:
CO2 effecting the temp is supposedly logarithmic. In the last 100 years or so we’ve gained 1° …. Of course, we’ve lost a tenth or so in the last decade…… but to get to 3, we must, according to current theory and observations, we’re going to have to get to about 1500ppm. I think we’ll be ok.
You are ignoring feedbacks. Feedbacks happen, and are already starting.
By the way, the forcing of CO2 is only approximately proportional to ln(C). A better fit is A*ln(C+bC^2) where A=4.996 W/m2, b=0.0005, and C is in units of ppm. The difference starts to get significant as C increases — it is 15% at 500 ppm, and 22% at 1000 ppm. There are even better fits with a higher order polynomial as the logarithm’s argument (Hansen notes this in his 1988 paper (I think it was)).
Actually Thoughtful says:
January 21, 2012 at 12:56 pm
We are seeing warming continue unabated during a quiet sun and La Nina conditions.
If you were asked to justify your assertion of “unabated” warming you would of course refer to the timescale of the last few decades, especially the 1970s onwards. However an ENSO cycle event is only 1-2 years in duration. Therefore it makes no sense to discuss the two together – i.e. a long term trend over several decades is unaffected by a 1-2 year fluctuation. This observation is obvious and trivial. This is the sort of smoke and mirrors and sleight of hand that are the ubiquitous signature of all AGW argument.
Geoff Sharp says:
January 19, 2012 at 8:14 pm
While there is evidence the PDO and ENSO are connected there is insufficient evidence to say that the PDO index is an after effect of ENSO.
Basil Copeland …
…The PDO is capable of driving ENSO.
This was observed in the back to back La Nina last year where we also saw the PDO index lead the ENSO index (which is not that unusual).
While science agrees that the north Pacific SST’s have a reasonable component of NON ENSO variability there is no way we can say the PDO is an after effect of ENSO.
There is a way out of the “chicken and egg” argument about whether ENSO drives PDO or vice versa. ENSO could be a nonlinear oscillator, and as such would be driven by an attractor. One possible type of attractor is a “butterfly” Lorenz attractor with 2 wings – one labelled “el Nino” and the other labelled “La Nina”. In this paradigm, ENSO does not “lead” PDO nor does PDO lead ENSO. Instead the warm phase PDO is when the ENSO gets stuck in one butterfly attractor wing, and the cool phase is the ENSO system sticking to the other wing.
This nonlinear oscillator paradigm for ENSO is discussed at:
http://wattsupwiththat.com/2011/01/25/is-the-enso-a-nonlinear-oscillator-of-the-belousov-zhabotinsky-reaction-type/
Geoff Sharp copied my comment that read, “It sure does look to me like the Miller et al. paper agrees with everything I’ve been saying to you all along.”
And Geoff Sharp says: “Incorrect. Both Miller and Copeland very clearly show the Aleutian Low (NPI) is an important component/driver of the PDO. “
Anyone who can read English and who has bothered to read the Copeland post and the Miller at al paper will understand that they agree with my comments on this thread about the PDO. Here’s the link to the Copeland post:
http://wattsupwiththat.com/2009/05/12/pdo-enso-aleutian-low-or-some-of-each/
For example, when discussing Miller et al, Basil Copeland writes, “While acknowledging a tropical forcing (ENSO) on North Pacific SSTs, they contend that there is another, distinct forcing that is independent of the tropical forcing, related on decadal time scales to the behavior of the Aleutian Low.”
This agrees with my comments about the PDO. Why is it only you who insists on creating a separate reality?
Geoff Sharp says: “The PDO index incorporates the NPI, not by accident one would think.”
This is another falsehood on your part. The PDO is only calculated using the Sea Surface Temperatures of the North Pacific. Read the first paragraph in the description on the JISAO webpage that describes how the PDO is calculated. There’s no mention that it “incorporated the NPI”:
http://jisao.washington.edu/pdo/PDO.latest
In your comment, you disagreed with JISAO about how the PDO is calculated. But that’s no surprise. You also disagreed with the basic definition of the PDO over on the Foster thread. Why is it that your understanding of how the PDO is calculated differs from the organization who calculates the data, Geoff? And why is it that your definition of the PDO is different than JISAO, who are the keepers of the PDO data, Geoff?
Geoff Sharp says: “Miller shows north Pacific SST’s being affected by the strength of the Aleutian Low, a diagram that perhaps you missed is shown below.”
Miller et al discussed many things that impact the North Pacific SST anomalies. One of them is the NPI. How did you miss the rest of them, Geoff?
Geoff Sharp says: “Copeland shows a stronger correlation between PDO/NPI than what the PDO/ENSO is capable of.”
It seems there’s an epidemic of fabrications in your comments on this thread, Geoff. If you had read the Copeland post you would have come across his conclusions. Basil writes: “The bottom line? While ENSO forced variation may drive the PDO out to decadal time scales, it does not fully account for PDO variation on longer time scales.”
Well, there you have it! Exactly as I have been saying. ENSO drives the PDO, but there is something else that influences it. Why is that so hard for you to see that what Basil and I have written are basically the same things, Geoff? Everybody else can see it.
Basil continues, “That latter is more likely related to long term, low frequency, oscillations in the behavior of the Aleutian Low, which set up what is really the more uniquely characteristic pattern of the PDO.”
In other words, the behavior of the Aleutian Low, represented by the NPI in his post, accounts for the additional variability of the PDO that can’t be explained by ENSO. Didn’t I write a post about this very same thing? Why yes I did! I wrote about it in April 2010, approaching 2 years ago. Here’s a link once again for you:
http://bobtisdale.wordpress.com/2010/04/16/is-the-difference-between-nino3-4-sst-anomalies-and-the-pdo-a-function-of-sea-level-pressure/
Geoff Sharp says: “By restricting yourself to a ENSO only driver of PDO is demonstrating your lack of understanding once again.”
Anyone who has read this thread knows that this is yet another fabrication on your part. In my January 19, 2012 at 5:41 pm reply to JP, I wrote, “JP, people give too much credit to the PDO. You may think this is nit picking, but the negative PDO simply means that ENSO has shifted and/or that North Pacific Sea Level Pressure has shifted. In my January 20, 2012 at 10:38 am reply to Caleb, I wrote, “There is another well-known factor that influences the spatial pattern of the North Pacific. And of course, the dominant (most often occurring) spatial pattern is known as the PDO pattern. And in addition to ENSO, the other factor that causes the variations in that pattern is Sea Level Pressure.”
Geoff Sharp says: “By not taking account of all possible factors you display bad science that you are passing on to the public.”
Anyone who has read this thread understands my science is sound and that you are simply fabricating untruths for some unknown reason. I and the rest of the readers here understand you, for some reason, feel the need to misrepresent my understandings, my comments, and my posts on these subjects, but what we do not understand is why you insist on doing it since it has to be time consuming for you.
Geoff Sharp says: “On a similar note, have you amended your El Nino Rossby wave references to show this phenomenon is NOT a regular occurrence?”
The discussion of Rossby waves was written clearly in the Foster and Rahmstof post. There is no need for me to amend it. You apparently did not understand the plain language in which it was written. Everyone else seemed to.
Since I feel no need to respond to any more of your fabrications, innuendos, and misrepresentations on this thread, I will say to you:
Good bye, Geoff.
Erinome says:
“Why drill for more oil if the US is now a net exporter of petroleum?”
Answer: an increased supply will result in lower cost. In this economy that is a Good Thing. The cost of energy is factored into almost everything. Artificially limiting its supply causes the cost of everything to rise, and that hurts the poor the most. But of course, that is the point, isn’t it?
Whoa! Phlogiston – not even a hint of a suggestion, on my part, that 1-2 years be considered anything other than weather. However, given that we know La Nina favors a cooler temperature, and low solar activity favor a cooler temperature, and both are happening simultaneously and we still had the 9th warmest year on record – it doesn’t bode well for the trend. Certainly it doesn’t bode well for a claim of a cooling trend.
But I urge you and anyone else interested in the question of whether the world is warming or cooling to consider the temperature record from 1970-2011 (we are up to 41 years in that range – 35 of which are warmer than the 1950-1980 average (all those 35 years are after 1975).
So your small point -that climate is over 30 years-is correct and not counter to what I said.
Your statement of smoke and mirrors is particularly interesting -as if you look in that mirror you will indeed find who is utilizing sleight of hand -the implication that the world is not warming, nor is ma to blame, is clearly false, your bigger point is a FAIL.
My vote is for the meteorologist, Joe Bastardi.
Global temps are due to fall because the heights they herky-jerky rose to required heat energy.
They have to have sustained heat energy inputs to maintain them, unlike the 1940’s to 1970’s where they were not as high to begin with.
The globe warmed because inputs and cycles were positioned to cause it to warm.
When the oceanic heat is exhausted, it can only come back in through 2 sources.
Solar warming and internal (tectonic).
Volcanic activity can warm the oceans, but it also cuts off the Solar input side.
When that has run its course, there is only one input left standing.
On the brink of the precipice dangles the potential slope to the next Ice Age…one of many that preceeded it.
America is currently holding hands with an idealistic and utopian lobster, also on the brink.
The lobster will survive the plunge.