By Joe Bastardi, Weatherbell Analytics
When the PDO turned cold, most of the meteorological and climate community understood that the pattern was turning very similar the last time of the PDO reversal, the 1950s, and it was a matter of time before the global temperatures, which have leveled off, would start falling in the same herby jerky fashion they had risen when the PDO turned warm at the end of the 1970s. I am not going to rehash the sordid details of how the AGW crowd simply ignores the major drivers of a cyclical nature. We all know that. Nor am I going to question them as to why they believe a trace gas like CO2 (needed for life on the planet) with a specific gravity of 1.5 as compared to the atmospheres 1.0, was going to mix with air in a way to affect the earth’s temperatures. Instead I am going to drive home points I have been making since 2007 and are now dramatically validating.
The La Ninas of 2008-09 and now this one had rapid mid level temperature drops that followed their onset and this years was nothing short of the most dramatic mid tropospheric drop since the start of the millennium. It is much more plausible to believe that rapid cooling in the mid levels would have an effect at leading to extremes, rather than what the warmingistas claim, which of course is anything that happens. In any case, one very interesting level that cooled to record cold levels was 400 mb, the very levels that the so called trapping hot spots were going to show up because of CO2…again a neat trick since somehow CO2 was going to defy the laws of Gravity, since, as mentioned above, its specific gravity is higher than the atmosphere (of course even if it was, it a) has not been proven to cause warming and b) man’s contribution is so tiny as to render it a non item anyway in climate considerations.
However first came the flip in the PDO, seen nicely here on the Multivariate Enso Index chart, which clearly illustrates the colder Pacific when the earth was colder, the start of the warming period coinciding with the satellite era, and now.
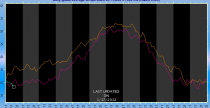
Now from the AMSU site, the amazing one year drop in temperature, the orange tan line being after the El Nino of 2009/10, the purplish line this past year and one can see the green this year, we are near record cold levels again.
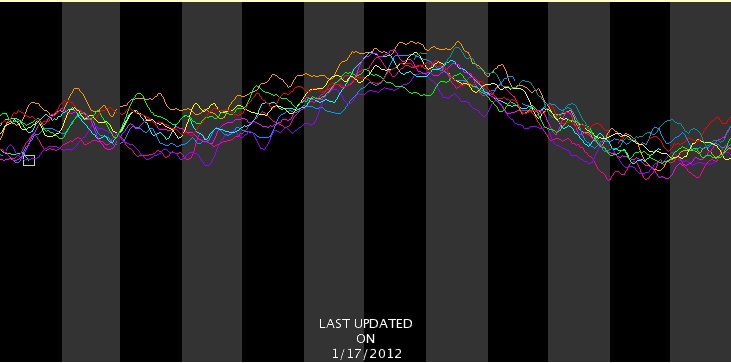
600 mb (14,000 feet) (enlarged)
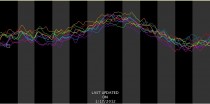
And oh my my, the trapping hot spot itself.. 400mb or 25,000 feet… coldest in the entore decade
But the 2 meter temperatures, being in the boundary layer, do not respond as fast as the ocean, or a transparent atmosphere above
Nevertheless three downturns in a jagged fashion started predictably after the last El Nino now falling again in fits and spurts through December.
From Dr Roy Spencer’s site:
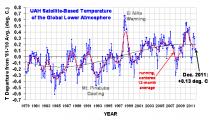
(enlarged)
In May, I forecasted the global temperatures to fall to -0.15C in one of the months – Jan, Feb or Mar this year, and perhaps as low as levels we saw in the 2008 La Nina. A rapid free fall has begun. Dr. Ryan Maue at his site (http://policlimate.com/weather/) maintains a plethora of useful forecast information including GFS global temp projections over the next 16 days.
They have been routinely reading greater than 0.2 C below normal and I suspect the Jan reading will plummet quite a bit from December with February even lower. An example of this can be seen with these two charts off Ryan’s site,
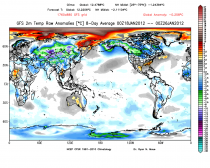
-0.258 C globally for 2 meters. (enlarged)

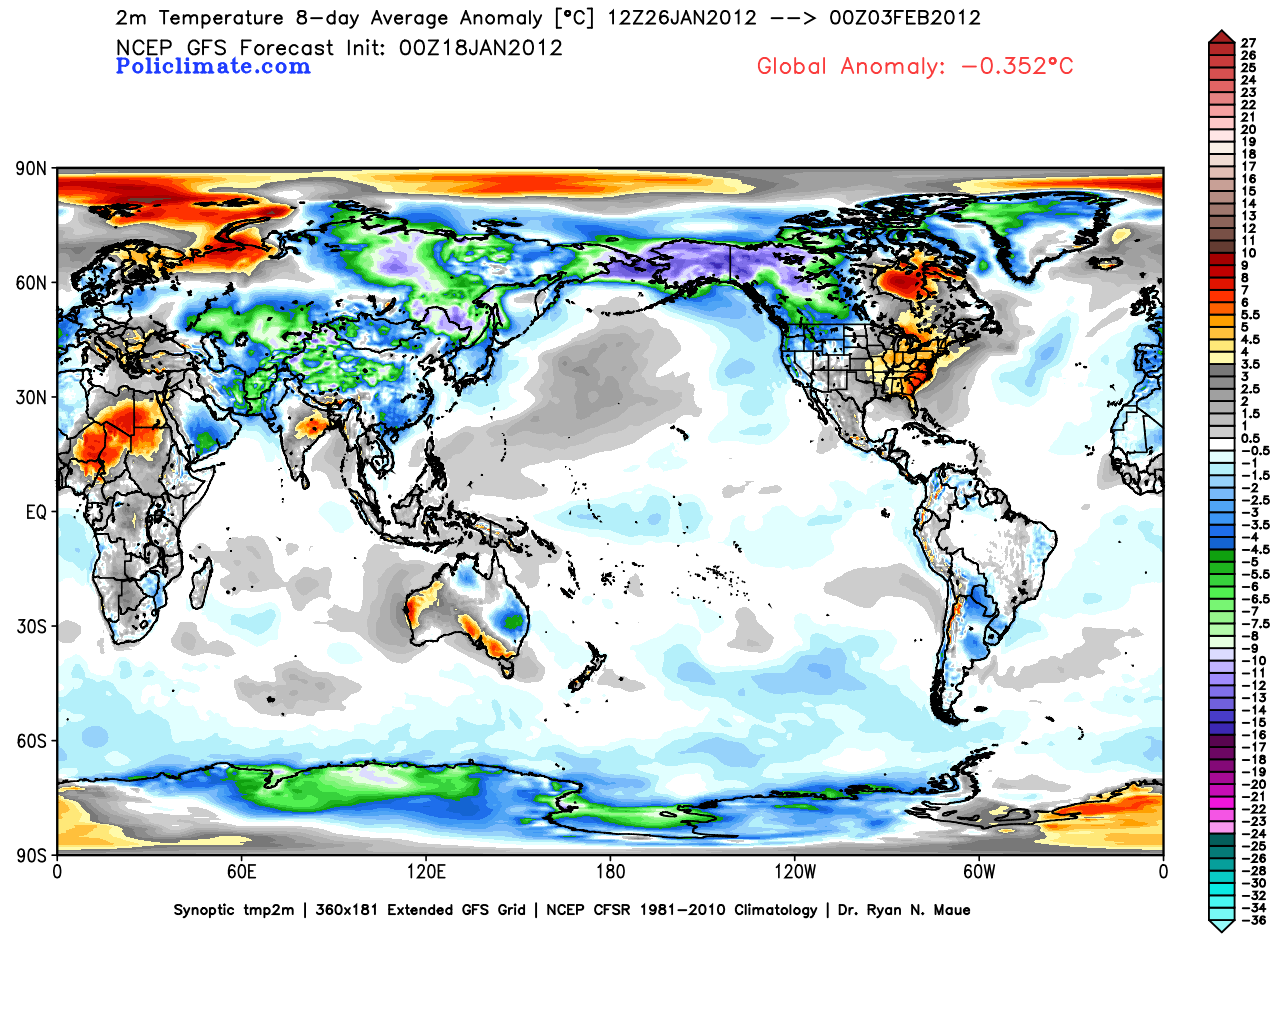
Day 8.5-16 a whopping -0.352 C (enlarged)
The reason the arctic looks warm is that it has been stormy, and when it’s windy the air is well mixed and so the temperatures are not as low as if it’s calm, but it’s still frigid. Notice in the second map, that the arctic cools because the arctic oscillation is starting to go negative, leading to higher pressures and lighter winds. But the most astounding aspect of this is the northern hemisphere mid latitude temperatures, at -2.1 C.
Currently, with gas so high because we are being handcuffed by an administration that won’t drill (if gas was a 1.50 lower, it would be worth a half trillion dollars to the economy) and an EPA that is causing untold economic damage (I would conservatively etiolate a half trillion dollars, from jobs lost to burdensome regulations) along with a 100 billion dollar subsidy to fight global warming world wide, it is costing each ACTUAL TAX PAYER close to 7000 dollars (1.1 trillion divided by 150 million tax payers).
One has to wonder, how even the most dogmatic of them don’t look at the actual facts, how they can continue to carry on their denial while the results of such things handcuff the American economy and cause untold misery for many as our wealth is not only redistributed, but dwindles. One can only conclude this is being done on purpose, and with purpose.
See PDF with enlarged images.
UPDATE: Bob Tisdale disagrees with portions of this analysis and has an essay here.
Torgeir Hansson, you say “the Obama Administration has accelerated the permitting process for drilling”. Maybe you mean as compared to their previously glacial pace for approving drilling:
http://lonelyconservative.com/2011/02/obama-admin-issues-one-drilling-permit-wont-issue-more-without-increased-funding/ This administration has been openly hostile to any energy production that is not done by their phony “green” cronies, such as now bankrupt Solyndra. The gulf drilling moratorium alone cost tens of thousands of jobs:
http://heritageaction.com/2011/07/obama%E2%80%99s-drilling-ban-by-the-numbers/
Obama’s recently decision against the XL Pipeline project will cost us many thousands of private sector jobs and undermine attempts to secure “friendly” oil supplies. The fabulous success of recent new drilling technology, such as fracking, has been achieved despite Obama’s administration, not because of it. These new techniques have helped lower our natural gas prices to 10 year lows, so the left-wing environmental community predictably wants to ban them.
Actually Thoughtful says:
January 19, 2012 at 8:14 pm
With a statement like that, you should seriously consider a different name–“Actually Thoughtful” is nowhere near accurate.
(Last time I looked, all of the foods I eat are carbon-based, which is part of the “cushy existence” I enjoy on this planet–all enhanced in their growth by the burning of coal and other carbon-based fuels. The electricity I use comes predominantly from a carbon energy source, and the automobile I drive uses a carbon-based fuel. Even if you drive one of those fire-upon-impact-prone Chevy Volts, I hate to break it to ya–that car is coal-powered because your “fuel” comes from plugging it into the coal/gas-fired electrical grid. Only if you own your own windmill and recharge it with that will I cut you some slack, although it was manufactured largely with carbon-based fuels.)
May I ask for the source reference for your statements so we all may see who sponsors such drivel? Oh, and a list of where you went to college is also requested, and whether you graduated at all.
Thanks.
Richard G – I invite you to look upthread to my challenge to Bastardi or any other so-called skeptic to commit to a time when the magic PDO will reverse all warming since 1980.
Been crickets since I issued the challenge.
Regarding CO2 and the atmosphere, the only place I know that has a sufficient environment for collection of said gas is in underground mine workings and some natural caves with little or no air movement. There, “dead air” has a particularly serious side effect–it will render you asphyxiated in short order and you’ll be just like the air–dead.
I belive there’s too much movement in the atmosphere for CO2 to collect or segregate in any meaningful way just based on its delta g.
Alan D McIntire says:
After reading McKitric’s postings, I figure that the earth will show a global “cooling” with our current economic downtrend. A lot of what we’re measuring is not global average temperatures, but waste heat from industrial activity.
Then why is the stratosphere cooling? (Ozone loss does not explain all of it — the lower stratosphere continues to cool; the rate for UAH LS in the last 10 years is -0.19 C/decade.)
Obama is not drilling for oil? US oil production is up 2.7% from one year ago. The US was a net exporter of petroleum products in 2011, for the first time in 62 years:
http://www.foxnews.com/us/2011/12/05/us-on-pace-to-become-net-fuel-exporter/
“Actually Thoughtful says:
January 19, 2012 at 11:12 am
no Hadcrut3 here – those guys manipulate data!). Nope It is GISS for us.”
Even GISS shows absolutely no positive slope for the last 10 years and 4 months. See
http://www.woodfortrees.org/plot/gistemp/from:1980/plot/gistemp/from:2001.67/trend
#Selected data from 2001.67
#Least squares trend line; slope = -3.86942e-06 per year
Now I realize this is not 30 years, but at the same time, it is too long to just ignore and to spend huge amounts of money to ameliorate.
I have a question. Why are we even arguing about the levels of CO2? Isn’t increased CO2 supposed to be good for the planet? Don’t we like our planet warm instead of cold? Don’t plants like more CO2? Wasn’t this planet just shrouded in plant life the last time CO2 was extremely high? And weren’t there animals alive then too? Is it not true that humans can survive an even MUCH higher level of CO2 than was present ages ago?
I tell you what, coming from a place that lives in winter half the year, I would love to have a longer growing season, heartier plants, increased production from my fruit\vegetable-producing plants, and a much easier livelihood.
Tell the people of Alaska and Washington right now that warm weather is a bad thing.
steven mosher says:January 19, 2012 at 7:24 am ………
Steve, nice film. Proof positive that CO2 is opaque to IR @ur momisugly 100% concentration. Yes CO2 blocks IR.
A small criticism of the film: Nice parlor trick with no practical relevance to AGW debate.
The film shows absorption @ur momisugly 0.038%(380ppm) concentration (ambient air) to be nil, and @ur momisugly 100% concentration to be near total. He ran quite a bit into the chamber before any effect was visible. Please show absorption @ur momisugly 0.070% (doubling of ambient). I would wager that no effect will be seen.
Convince me, please.
The argument is not whether CO2 absorbs IR, it is how much. The argument is not IF there is warming or cooling (the record is clearly variable), it is whether warming is good or bad, whether cooling is good or bad. Warming is a boon to the biosphere. Cold kills people. Increased CO2 is provably beneficial to the plant kingdom, and thus to the animal kingdom.
The notion of a global “average” temperature as something we can calculate, or has any real meaning across the varied globe is silly. My Goode’s World Atlas from 1970 (when an Ice Age was the rage) has a page: Climates of the Earth. Please notice the plural usage Climates. It maps 14 types of Climates (by Glenn T. Trewartha, *simplified* from Koppen) with 21 regions and subtypes. A global average is laughably simplistic.
I fervently hope you are right and it is warming. Warming is good
As to more CO2?…MORE SUGAR!!!
GregO says: January 19, 2012 at 8:59 pm
OK I read the Knutti and Hegerl (K & H) paper. I am unmoved. The paper was published in 2008 and here in 2012 RSS reads -.01… I believe the point of this post is to pose the question: Where’s the heat? What are the 2012 measurements and what is the state of empirical evidence for planetary warming? Look at the data for January 2012 with clear, open minded clarity: -.01. Where’s the heat? No heat. Where’s the problem? No problem.
Hi GregO. As mentioned in my original response, many people confuse short term fluctuation with long term trends. Knutti and Hegerl is a paper about equilibrium climate sensitivity. It is concerned with long term climate response, not what happens across the next decade and certainly not what happens this month. Note that there are scores of studies using multiple independent approaches to estimate the rise in temperature associated with a doubling of atmospheric CO2. All are positive and the median of each separate technique sits close to +3C.
For shorter term response I suggest you study the Foster and Rahmstorf link. The consistency of the underlying trend belies your “no heat” assessment. You link above to a cyclic fit of temperature. You have an empirical basis to measure against as time goes forward. We will all see how good a predictor this technique proves. Best of luck.
Werner Brozek – why is 10 years too long to ignore? Why have you cherry picked your dates so carefully?
Climate is defined as 30 years. We often see trends in less than 30 years. SkS has some great graphs the show how you see the world (your carefully picked time periods (down to the month!) and the actual over-riding trend (ie up and to the right – relentlessly, just as man-made CO2 emissions have increased). (and opposite or low/no correlation to obvious things like solar output, volcanoes, etc)
Will you slavishly follow your tiny time periods during the next El Nino? Or when the sun cycles into higher activity? Or when both happen at once?
Despite the desperately hopeful PDO piece posted to this same site, I assure you the future trend is warmer, not cooler. And I have no doubt you know this to be true.
You appear to be too smart to be taken in by the weather. Yet your post speaks a different message.
Actually Thoughtful says:January 19, 2012 at 9:24 pm ………………
A.T.
I don’t presume to *predict* the weather beyond 2 hours and even then I get it wrong. You have the vision of a cricket who only sees the grass in front of you, little one. Lift your eyes and you can see mountains in the far distance. Look farther than 1980 my friend and you will see 1940 towering in the distance, and try to remember how they recorded temperatures before the advent of thermometers in 1724. (They didn’t.) That is prehistory and the realm of conjecture. The more we learn the more we should know how little we know.
And let us presume for a moment that you are right about all of this. There is not a thing you or I can do to stop it no matter how much you tax or spend. We are on an enormous ball careening through space for crying out loud. There are no brakes and the steering wheel isn’t really connected to anything. It just gives you the illusion that we can steer this thing. So lets all argue over who gets to steer next.
What I find interesting about people such as Ammonite is that they have set the bar so low (a decade of no trend is “meaningless” yet I suspect a month of, say, very low sea ice, is extremely significant), that if we hypothetically ended up with .5C-1C of mild and probably beneficial warming towards the end of this century, I suspect he would still regard this result as “vindication” of climate models.
Citing Foster and Rahmstorf (2011) is curious. If what happened didn’t happen, there would still be warming. Ah, OK…. The actual point of the paper is that natural variability is so great it masks the tiny CO2 influence. Not perhaps what Foster and Rahmstorf set out to prove, but the only reasonable conclusion to draw.
Michael D Smith says:
January 19, 2012 at 7:34 pm
The rate I get short term is as high as 8.3 ppmv/°C/year (!) . This was done by looking at CO2 only during the el nino of 1998. dCO2/dt rate responds extremely fast to temperature, but temperature peaks and valleys don’t last long, so you don’t see much in an integrated total.
One objection: the response to short term temperature fluctuations is about 4 ppmv/°C, but not per year! That is based on the fast response of oceans and vegetation to temperature changes like the 1992 Pinatubo eruption and the 1998 El Niño. Any sustained temperature change will give an initial fast response, but that levels out over time as the CO2 levels reach a new steady state for the new temperature. That is what you see in the ice cores, heavely smoothed (560-600 years) in the Vostok and Dome C long time records, but already with better resolution (40 years) in the Law Dome record for the MWP-LIA transition. Anyway, the 100 ppmv increase can’t be caused by temperature, as the main fast responses are the oceans, which have the wrong 13C/12C ratio or vegetation, which grows better with higher temperatures, thus becomes a larger sink… So, the current 4 ppmv/°C response around the upgoing trend is caused by temperature changes, but the trend itself is not caused by sustained temperature changes.
I checked out the GFS animation of anomalies for the next 16 days at http://policlimate.com/weather/current/ext_raw_temp_c.html
Currently the 12z31JAN run shows a global anomaly of minus 0.599. Yowza! Of course, the computer model does jump around a bit. Twelve hours later, on February 1, the global anomaly is “only” minus 0.405.
Let us do a little “fact check” on the GFS computer on the last day of January. I’ll bet a nickle, (if I still have one,) that the global anomaly is not minus 0.599.
I don’t know much about the inner workings of computers. For example, I did not know they have gaskets and rockers. However obviously they do, for the GFS has blown a gasket and is off its rocker.
What makes me curious is the data going in, that is causing the GFS to go so whacko. Even though I suspect the GFS is wrong on the details, (Major thaw in the east, with terrible cold charging down from Alaska, on January 31,) it may be, in some way, “sniffing something out.”
And that is where I turn to the mind of Mr. Bastardi. On a regular basis he beats the GFS “like a rented mule.” When he perks up, and even starts to say his earlier forecast may need adjusting, (to a colder February,) I shut up and listen.
> You folks that are coming at me about co2 sg, apparently dont understand that simply put, it does not mix well with air. There was just an article about that here on WUWT.
Oh dear, this is funny. Mr Bastardi is proving that even when his own side tell him he is wrong, politely and clearly, he still isn’t capable of seeing sense.
Here is something that might help: http://amsglossary.allenpress.com/glossary/search?id=homosphere1
Or would you prefer some actual measurements?
Michael D Smith says:
January 19, 2012 at 7:34 pm
Reaction on the second part:
The rate of transfer that is calculated by seasonal effects (that results in a back of the envelope time constant of 7 years), is the MINIMUM velocity that shows up in total. i.e, the fact that we can calculate such a rate indicates that the net of inflows and outflows cannot change at less than this rate.
One need to make a differentiation between fast responses and slow responses, especially for vegetation. The main seasonal flows are from warming/cooling mid-latitude oceans and vegetation. The tropic oceans are permanent sources and the polar oceans are permanent sinks, opposite for vegetation on land, both hardly influenced by seasonal changes. The main change in vegetation is the start of the growing season and the deterioration of leaves in fall . That is visible in the regional CO2 records, mainly in the NH.
A sudden increase of temperature increases average uptake of CO2 by mid-latitude vegetation, but also increases the CO2 release by the mid-latitude oceans. As one looks at the global influence of temperature, we see a global seasonal increase of about 5 ppmv for an about 1°C global increase during NH summer (more land). Again not more than 5 ppmv/°C on very short term. While the exchanges are huge, the natural variations in CO2 uptake/release are relatively small (less than 3% of the flows). Probably a result that oceans and vegetation react in opposite direction for temperature changes… But again, once the temperature is fixed at a different level, the CO2 rate of change levels off to zero when the new steady state is reached. In reality, that never happens as there are always year by year changes in temperature, but the longer term average is measurable in ice cores (and recently confirmed for 2 million years in sediments).
The long term changes include deep ocean temperature changes and ice cover / vegetation area changes, which brings the long term influence to about 8 ppmv/°C.
What we miss in the record is the reaction of CO2 levels to mid-term temperature variations from years to decades. But it would be quite strange that this would be different from the very short and very long term ratios…
sydney australia having a cold summer have not turned on the air con this summer
Geoff Sharp @ur momisugly January 19, 2012 at 8:14 pm
I’m sorry to have to tell you this, Geoff, but I think you made a mistake by thinking Basil Copeland’s post disagrees with me. Over in the comment section of the Foster Part 2 post, I have been saying the PDO is the function of ENSO and North Pacific sea level pressure. Basil refers to the NPI and I believe you’ll discover the NPI is a sea level pressure index for the North Pacific. So that part of the Copeland post does not disagree with me.
Basil Copeland quoted Miller et al. a few times and said it disagreed with Newman et al., but I can’t find where it disagrees. Here’s the entire section of the Miller paper from which that Basil quoted [The CAPS are mine, as are the bracketed comments]:
“2.2 Mechanisms of decadal variability
“The mechanisms by which the Aleutian Low might
vary on decadal timescales are uncertain, but stochastic
excitation by midlatitude weather disturbances certainly
exerts a strong influence. The stochastic forcing climate
models of Hasselmann (1976) and Barsugli and Battisti
(1998), for SST, and Frankignoul et al. (1997), for ocean
currents, constitute zero-order models of midlatitude
decadal variability. However, deviations (i.e., spectral
peaks, or enhancements of variance) from the simple spectra
predicted by those theories are significant, and many
ideas have been advanced to explain them. Some of these
involve spectral peaks arising with only stochastic atmospheric
forcing (Jin, 1997; Saravanan and McWilliams,
1998; Neelin and Weng, 1999; Qiu, 2003), while others
rely on feedback loops or remote forcing.”
[That does not disagree with Newman et al. or with what I’ve been saying.]
“Deterministic forcing from the tropics clearly has an
effect in establishing decadal SST variability in the
midlatitudes. The forcing of the canonical SST pattern
(around the subtropical front) has long been linked to atmospheric
teleconnections from the tropics associated
with El Niño/Southern Oscillation (ENSO) events on
interannual timescales (Alexander et al., 2002). The forcing
of the KOE SST pattern (around the subarctic front)
is only weakly linked to tropical teleconnections, because
the nodal line of the ENSO-forced pattern runs through
the KOE region (e.g., Hanawa et al., 1988). The independent
behavior of the KOE SST has been clarified
through its enhanced decadal variance relative to the canonical
SST pattern (Deser and Blackmon, 1995;
Nakamura et al., 1997) and through its links to decadal
wind-stress curl forcing (Deser et al., 1996, 1999; Miller
et al., 1998).”
[Miller et al. just said the mid latitudes are forced from ENSO in the tropics. This agrees with what I’ve been telling you.]
“Recent studies with a simple first-order
Markov model with forcing specified by the tropical SST
index, damping rate specified by SST persistence (with
re-emergence) and white noise forcing (simulating
midlatitude weather) reveals that the BULK of the PDO
index is explicable by atmospheric forcing from tropical
teleconnections (Newman et al., 2003).
[Miller et al just said that most of the variations in the North Pacific are explained by forcing from ENSO. Isn’t that what I’ve been telling you?]
The forcing with
tropical origins (Graham et al., 1994; Giese and Carton,
1999; Schwing et al., 2002b; Yasunaka and Hanawa, 2003;
Deser et al., 2003b) clearly drives the canonical SST pattern
portion of the PDO.
[And Miller et al. just said 4 other papers agree that the pattern originates in the tropics with ENSO, Geoff.]
However, THE SIMPLE MODEL RESULT
IS SOMEWHAT DEFICIENT IN DECADAL TIMESCALE ENERGY.
This suggests that the KOE SST pattern portion of the
PDO is not simply driven by (OR AT LEAST IS NOT IN PHASE WITH)
this tropical forcing.”
[All Miller et al. just said Newman et al. is not complete, but Newman et al. had said that in their paper.]
“Adding a lagged KOE response
pattern, mimicking the gyre-scale spin-up delay, may
improve the fit of the Newman et al. (2003) simple model.
Alternatively, midlatitude ocean-atmosphere, or oceanatmosphere-
ecosystem, feedbacks may be important.”
Miller et al. doesn’t disagree with Newman et al, Geoff. They are saying that Newman needs to include a time-delay response where the KOE region lags ENSO because of gyre spin-up (and the KOE region is in the Northwest Pacific and that’s the area you’ve been talking about on this thread and over in the Foster comment section). That would only make the KOE a little out of phase with ENSO and with the Northeast Pacific. And didn’t I mention something about gyre spin up to you over in the Foster comment section? Look, spin-up is even mentioned by Miller et al.
It sure does look to me like the Miller et al. paper agrees with everything I’ve been saying to you all along.
Maybe you should try to understand the topics you’re discussing before you comment.
Good bye, Geoff
Erinome says:
January 19, 2012 at 9:37 pm
Then why is the stratosphere cooling? (Ozone loss does not explain all of it — the lower stratosphere continues to cool; the rate for UAH LS in the last 10 years is -0.19 C/decade.)
Any GHG increase in the troposphere will increase the temperature of the surface by blocking more outgoing IR. And therefore give a stratospheric cooling. But that doesn’t mean the current cooling of the stratosphere is due to CO2 (the cooling is more stepwise than in ratio with CO2 increase). Water vapour will do the same job even more easely. There are few measurements which can make the distinction between the two causes.
As the average earth temperature increased over the past century, more water vapour is hold up in the troposphere, thus more cooling of the stratosphere… If the increased temperature is due to CO2 is a matter of debate, as at least halve of the temperature increase in the previous century is natural: 100% of the first halve century plus part of the second halve… The temperature increase also is stepwise and not in ratio with the CO2 increase.
Will Nitschke says: January 20, 2012 at 12:04 am
“What I find interesting about people such as Ammonite is that they have set the bar so low (a decade of no trend is “meaningless” yet I suspect a month of, say, very low sea ice, is extremely significant), that if we hypothetically ended up with .5C-1C of mild and probably beneficial warming towards the end of this century, I suspect he would still regard this result as “vindication” of climate models.
Citing Foster and Rahmstorf (2011) is curious. If what happened didn’t happen, there would still be warming. Ah, OK…. The actual point of the paper is that natural variability is so great it masks the tiny CO2 influence. Not perhaps what Foster and Rahmstorf set out to prove, but the only reasonable conclusion to draw.”
Hi Will. Lets agree not to put words in each others mouths. The underlying trend from Foster and Rahmstorf is ~ +0.16C/decade for satellite and terrestrial based systems. If that were all due to CO2 would you consider it “tiny”? If such a trend persisted an El Nino excursion of +0.3C would be eaten up in under 20 years to become the new norm under neutral conditions. +0.5C is only 31 years away at this rate.
The actual point of the paper is to indicate that known causes of variability are sitting on top of a rising trend. Further, F&Rs method of trend identification reduces volatility (residuals) to the point that statistical significance is achievable at ~ 5 years. So lets raise that bar. I predict that in ten years time the F&R series will read +0.16C (near enough) from its current value. Where do you stand?
Richard G says:
January 19, 2012 at 10:54 pm
The film shows absorption @ur momisugly 0.038%(380ppm) concentration (ambient air) to be nil, and @ur momisugly 100% concentration to be near total. He ran quite a bit into the chamber before any effect was visible. Please show absorption @ur momisugly 0.070% (doubling of ambient). I would wager that no effect will be seen.
Convince me, please.
The effect of 0.038% ppmv CO2 is hardly measurable on a small distance (although CO2 levels are measured by absorption at certain wavelengths), but is measurable over 100 m height in the atmosphere. The relative effect increases with height, as water vapour rapidely drops with height. But even at full water vapour saturation, there is an effect of CO2, as that mainly absorbs at wavelengths where water is less active for outgoing IR radiation over the full air column. See:
http://barrettbellamyclimate.com/page11.htm
The change in effect also is measured by satellites (with as caveat that different equipment was used) over the period 1970-1993:
http://www.sp.ph.ic.ac.uk/news/newsmar01.html
There is a more recent version, but forgot to save it…
steven mosher says:
January 19, 2012 at 7:24 am
From what Joe says about trace gas and from what he says about specific gravity it looks like Joe utterly misunderstands the mechanism of global warming. He thinks C02 traps heat. It doesnt. that is not the theory.
Mosher then links to a video clip in which the statement “effectively traps the heat” is made.
Brilliant.
jorgekafkazar says:
My 1964 University Physics by Sears and Zemansky (p. 281) reads:
In cross-checking the definition in my Mark’s Standard Handbook for Mechanical Engineers, I see that you are correct and all these years I’ve been misinformed.Thanks for correcting me.
Ferdinand:
Thanks for the detailed explanation, you have quite an understanding of CO2 flows.
You also explain:
The effect of 0.038% ppmv CO2 is hardly measurable on a small distance (although CO2 levels are measured by absorption at certain wavelengths), but is measurable over 100 m height in the atmosphere. The relative effect increases with height, as water vapour rapidely drops with height. But even at full water vapour saturation, there is an effect of CO2, as that mainly absorbs at wavelengths where water is less active for outgoing IR radiation over the full air column.
We know water vapor is by far the better GHG, when available, AND it has the ability to also transfer enormous amounts of heat due to phase change, (which transports the heat to high altitude where there is a better radiation window) so doesn’t the effect of CO2 simply change the height at which, all else being the same, H20 phase changes occur? I realize there is a wavelength difference, but isn’t the effect of CO2 in a H20-rich environment largely overridden? More CO2 makes clouds higher? I think this would make the effect of CO2 for the majority of the planet where clouds form basically zero.