By Joe Bastardi, Weatherbell Analytics
When the PDO turned cold, most of the meteorological and climate community understood that the pattern was turning very similar the last time of the PDO reversal, the 1950s, and it was a matter of time before the global temperatures, which have leveled off, would start falling in the same herby jerky fashion they had risen when the PDO turned warm at the end of the 1970s. I am not going to rehash the sordid details of how the AGW crowd simply ignores the major drivers of a cyclical nature. We all know that. Nor am I going to question them as to why they believe a trace gas like CO2 (needed for life on the planet) with a specific gravity of 1.5 as compared to the atmospheres 1.0, was going to mix with air in a way to affect the earth’s temperatures. Instead I am going to drive home points I have been making since 2007 and are now dramatically validating.
The La Ninas of 2008-09 and now this one had rapid mid level temperature drops that followed their onset and this years was nothing short of the most dramatic mid tropospheric drop since the start of the millennium. It is much more plausible to believe that rapid cooling in the mid levels would have an effect at leading to extremes, rather than what the warmingistas claim, which of course is anything that happens. In any case, one very interesting level that cooled to record cold levels was 400 mb, the very levels that the so called trapping hot spots were going to show up because of CO2…again a neat trick since somehow CO2 was going to defy the laws of Gravity, since, as mentioned above, its specific gravity is higher than the atmosphere (of course even if it was, it a) has not been proven to cause warming and b) man’s contribution is so tiny as to render it a non item anyway in climate considerations.
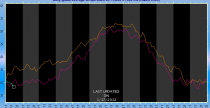
However first came the flip in the PDO, seen nicely here on the Multivariate Enso Index chart, which clearly illustrates the colder Pacific when the earth was colder, the start of the warming period coinciding with the satellite era, and now.
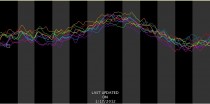
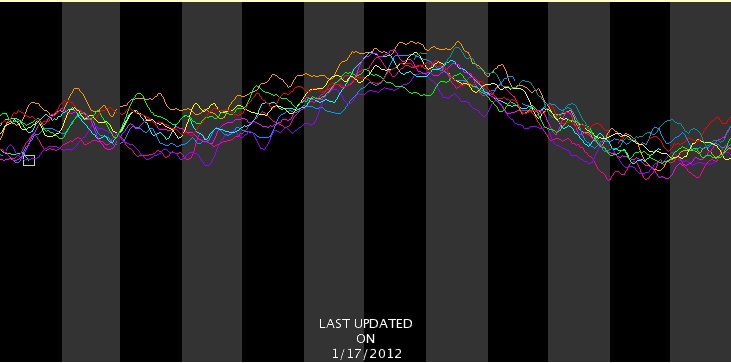
Now from the AMSU site, the amazing one year drop in temperature, the orange tan line being after the El Nino of 2009/10, the purplish line this past year and one can see the green this year, we are near record cold levels again.
600 mb (14,000 feet) (enlarged)
And oh my my, the trapping hot spot itself.. 400mb or 25,000 feet… coldest in the entore decade
But the 2 meter temperatures, being in the boundary layer, do not respond as fast as the ocean, or a transparent atmosphere above
Nevertheless three downturns in a jagged fashion started predictably after the last El Nino now falling again in fits and spurts through December.
From Dr Roy Spencer’s site:
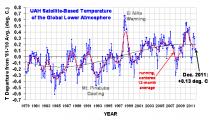
(enlarged)
In May, I forecasted the global temperatures to fall to -0.15C in one of the months – Jan, Feb or Mar this year, and perhaps as low as levels we saw in the 2008 La Nina. A rapid free fall has begun. Dr. Ryan Maue at his site (http://policlimate.com/weather/) maintains a plethora of useful forecast information including GFS global temp projections over the next 16 days.
They have been routinely reading greater than 0.2 C below normal and I suspect the Jan reading will plummet quite a bit from December with February even lower. An example of this can be seen with these two charts off Ryan’s site,
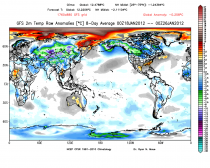
-0.258 C globally for 2 meters. (enlarged)

Day 8.5-16 a whopping -0.352 C (enlarged)
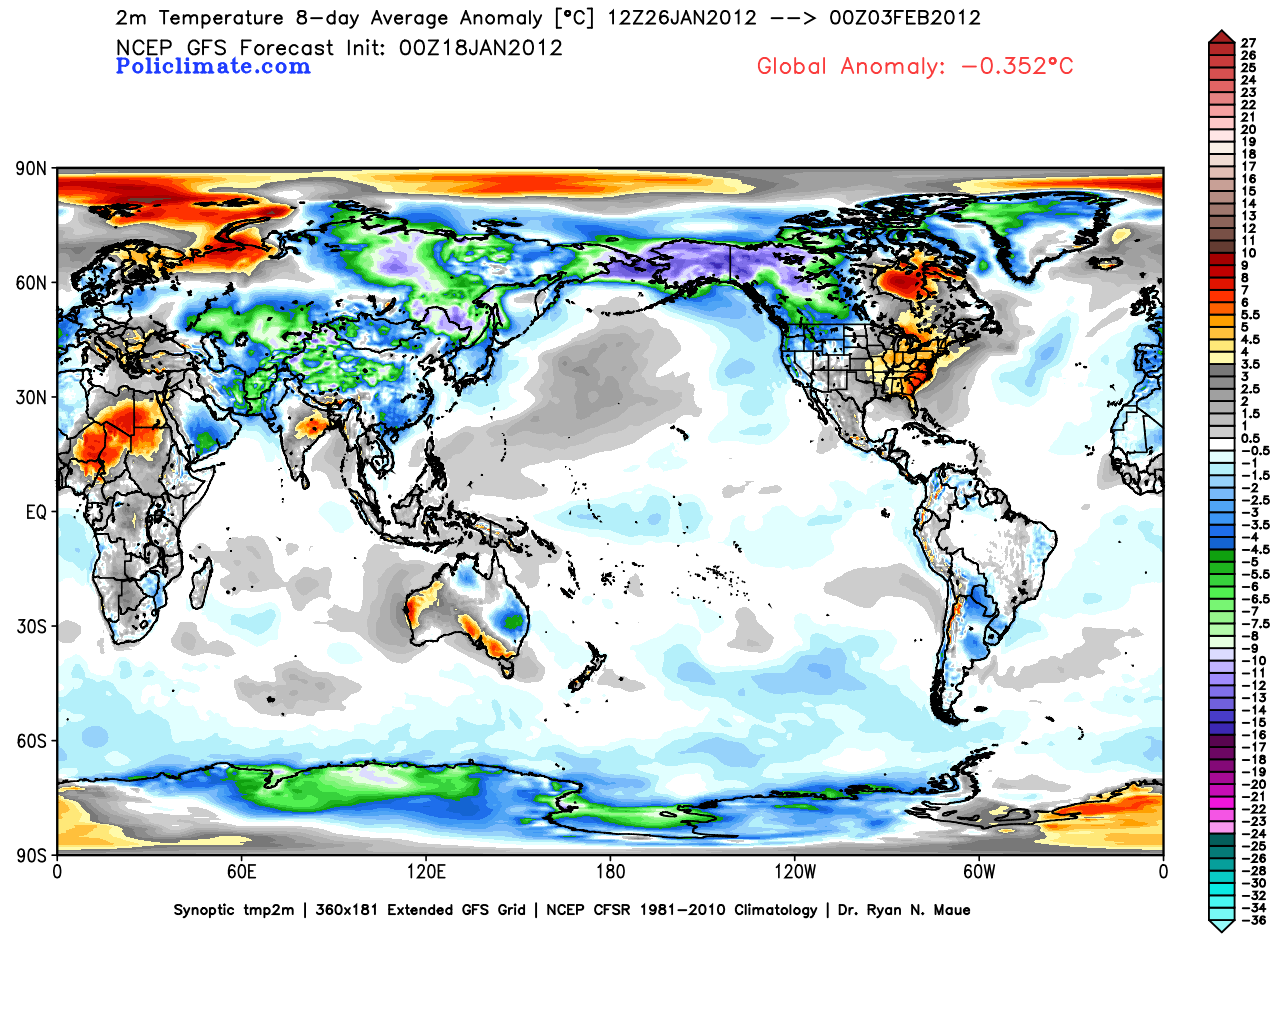
The reason the arctic looks warm is that it has been stormy, and when it’s windy the air is well mixed and so the temperatures are not as low as if it’s calm, but it’s still frigid. Notice in the second map, that the arctic cools because the arctic oscillation is starting to go negative, leading to higher pressures and lighter winds. But the most astounding aspect of this is the northern hemisphere mid latitude temperatures, at -2.1 C.
Currently, with gas so high because we are being handcuffed by an administration that won’t drill (if gas was a 1.50 lower, it would be worth a half trillion dollars to the economy) and an EPA that is causing untold economic damage (I would conservatively etiolate a half trillion dollars, from jobs lost to burdensome regulations) along with a 100 billion dollar subsidy to fight global warming world wide, it is costing each ACTUAL TAX PAYER close to 7000 dollars (1.1 trillion divided by 150 million tax payers).
One has to wonder, how even the most dogmatic of them don’t look at the actual facts, how they can continue to carry on their denial while the results of such things handcuff the American economy and cause untold misery for many as our wealth is not only redistributed, but dwindles. One can only conclude this is being done on purpose, and with purpose.
See PDF with enlarged images.
UPDATE: Bob Tisdale disagrees with portions of this analysis and has an essay here.
#1 – Performing simple mathematics is not claiming omniscience in economics. Learn to add, subtract, multiply and divide for yourself.
#2 – The US spends nowhere NEAR 1.5 trillion on the security apparatus. About half that is closer to the truth.
Stop being lazy and do your own research.
Erinome says:
January 19, 2012 at 9:37 pm
“Then why is the stratosphere cooling?”
I don’t disagree with you. The point I was trying to make was that part of the previously measured warming was increase in the heat island effect due to increases in economic output.
Additional industrial output could partially mask any natural cooling, but we ain’t gong to get that with the current administration’s policies.
<i?Erinome says:
January 19, 2012 at 9:37 pm
[Alan D McIntire says:
After reading McKitric’s postings, I figure that the earth will show a global “cooling” with our current economic downtrend. A lot of what we’re measuring is not global average temperatures, but waste heat from industrial activity.]
Then why is the stratosphere cooling?
At least part of it could be increased CO2. It radiates some of the kinetic energy of the stratosphere to space.
Oil production has gone up but it’s not due to the Obama administration.
http://blog.heritage.org/2012/01/18/under-obama-oil-and-gas-production-on-federal-lands-is-down-40/
An inversion layer causes smogs by preventing smoke from rising. Does it do the same thing to CO2? You can see smoke from a chimney falling downward as it leaves a chimney whereas normally it would be rising!
Ammonite,
Thanks for the response. I downloaded and plotted RSS last night and had my spreadsheet calculate a least squares linear regression and indeed it is increasing at something close to .16 C per decade. Correlation coefficient not too good and no surprise there.
Questions I ask myself;
1. Has GATA ever risen in relation to an arbitrarily chosen base number like this in the past prior to Man-made CO2? My answer: Probably. Ref Minoan/Roman/Medieval warm periods which we are at least a bit uncertain about so that’s why my answer is probably, but add the paleo records to the historic records and to me I accept it as a reasonable assertion that since recorded history climate has changed with temperature going up and down – why it does I haven’t the faintest idea – but I accept that temperatures and climates can and do change and further I would posit that those changes are likely to show up in local climates in more extreme versions. Maybe that’s what happened to some ancient cultures like the Indus Valley people, Mayans, Bronze Age dark ages, I don’t know, but climate change having a bad to catastrophic effect, particularly on a localized geographic area, and specifically if the population and their organizing governments cannot adapt to the new conditions is entirely plausible.
2. What is the correct temperature of the earth? For the sake of discussion, there are various starting points I have seen chosen in order to establish delta T with respect to some baseline. I believe the discussion here in this thread references the beginning of the satellite record for example. OK. I have also seen the beginning of the industrial era. OK. One could start anywhere. But is that starting point anything other than a convenient, arbitrary point for the sake of constructing a delta T versus time plot, or is there some branch of earth science (or any science) that by some means specific to their technical training, it is known by them that the earth should be some specific temperature? I mean this as a serious question and not rhetorical. I will ask the question another way – is there a temperature the earth should be right now, other than what it happens to be? An answer could be something like “the temperature of the earth should be 0.5431 degrees C cooler than it is now because (list rationale for earth not being at the right temperature – Man-Made blah-blah-blah, termites and methane, whatever…) and if only it was 0.5431 degrees cooler it would be great because (list things that would be better – more wild animals, better corals, bigger and better glaciers, more Arctic ice – tell me how the world would be better were it not for the heating above “normal”).
3. What about the correct level of CO2? Is there a correct level of CO2? It is claimed earth should never have more than 350 ppm CO2 because more than 350 ppm will result in heating (now in front of the word “heating” insert “Man-Made”, “Catastrophic”, “Meaningless”, “A steady DC offset from the natural”, blah, blah, La, La, – I think you get the point). CO2 concentration is now at something like 390+ ppm. This is a data point. RSS is at -.01 from its baseline. This is a data point. How does this lead to “blah-blah” in front of the word heating? This month the heating is a negative number.
Thank you for your best wishes and good luck to you as well.
Joe Bastardi wrote:
You cant just blow that off, especially when you can see what temps have done in relation to the PDO in the past, and the fact that they have leveled off the last 15 years even as co2 has marched up.
Joe, please look at the data! It is NOT true that temperatures have “leveled off the last 15 years”. Here are the trends for that interval:
UAH LT: +0.097 C/decade
UAH MT: +0.007 C/decade
UAH LS: -0.067 C/decade
Erinome says:
“Obama is not drilling for oil? US oil production is up 2.7% from one year ago.”
That is despite the Obama Administration’s obstructionism.
Obama can take no credit whatever for any new U.S. oil production, since he adamantly refuses to allow any new drilling, or even any exploration, in the red areas.
Next time you compare your new utility bill with the ones you got when the last adult, President G.W. Bush, was in charge, you can thank Obama for jacking up your rates.
Bob Tisdale,
I always appreciate your keen powers of observation.
Here are some things I’ve observed.
The cold PDO seems to lead to more ice forming up in the Bering Straights. This effects air coming across from Siberia via “cross polar flow,” allowing it to stay colder.
The cold PDO has colder water just off California, and warmer water out towards Hawaii, which often encourages high pressure off the west coast. When this high locks in, it loops air up towards Alaska, but also encourages the “cross polar flow” to charge straight down on the east side of the Rockies, and in severe cases (such as the winter of 1976-77,) the entire east stays in the icebox for several months.
In conclusion, because the “cold” PDO has such different weather patterns from the “warm” PDO, it may not matter all that much if the “warm” one turns out to be slightly colder than the “cold” one, in terms of averaging out the entire Pacific. What matters is the system of delivery. Perhaps the “cold” PDO is called “cold” because we in North America are more likely to have our butts frozen off.
Lastly, during the last warm El Nino the signature of a “cold” PDO, ( a backwards letter “C” in the Pacific, with the cold curving from south of Hawaii to the west coast and then back out to sea up by Alaska,) never completely faded away, though it did weaken. It was never replaced by a warm letter “C” in the anamoly maps. Wouldn’t that suggest it has a life of its own, and is not merely a responce to ENSO?
Caleb says: “Wouldn’t that suggest it [the PDO] has a life of its own, and is not merely a responce to ENSO?”
There is another well-known factor that influences the spatial pattern of the North Pacific. And of course, the dominant (most often occurring) spatial pattern is known as the PDO pattern. And in addition to ENSO, the other factor that causes the variations in that pattern is Sea Level Pressure. Also Central Pacific ENSO events (El Nino Modoki) have slightly different spatial patterns that East Pacific ENSO events, which adds to the flavors.
In looking at the rest of your comment, let me throw this past you. When trying to determine the impacts of the North Pacific Sea Surface Temperatures on Northern Hemisphere surface temperatures, it seems logical to me to use the Sea Surface Temperature itself, and not the dominant spatial pattern of the North Pacific Sea Surface Temperature (the PDO), which as you noted, is not present all of the time.
Smokey says:
Obama can take no credit whatever for any new U.S. oil production, since he adamantly refuses to allow any new drilling, or even any exploration, in the red areas.
Without knowing the provenance of this chart, I am suspicious of its veracity. In any case, why should the US be drilling in some of the most populous areas of the country, the seaboards? Moreover, federal land is for everyone to use and enjoy, not just energy companies.
Next time you compare your new utility bill with the ones you got when the last adult, President G.W. Bush, was in charge, you can thank Obama for jacking up your rates.
Actually my electricity rate is the lowest it’s been in years: 6.9 cents/kWh, due to a strong emphasis on renewable power in my region. Four years ago it was 11.1 cents/kWh, and 8 years ago, in another region, it was 16.2 cents/kWh.
I’m very happy with my rate, and would purchase green power if my provider offered it. (My previous provider did; it added $3/month.) What I’m unhappy about, though, is the ~ 3 cents/kWh power generation via fossil fuels adds to everyone’s health costs. You would apparently like that to be higher.
Bob Tisdale,
Thanks for the food for thought.
I haven’t properly digested the meal you served me yet, but my intital responce is to prefer the anomaly map to the temperature map, because the anomaly shows you where the system is getting “tweaked,” as it were. If you were running a climate in a test tube, and you added a little heat here and subtracted a little there, how would the circulation patterns change? If you just look at the temperature maps, all you see is that it is hot down south and cold up north. You don’t really see the “tweaking” going on.
It’s pretty obvious the ENSO cycle influences the trade winds. I think what fellows like Bastardi have gleaned, through their observations over the years, is that patterns to the north change as well.
Maybe they haven’t got the nuts and bolts of the changes down, but they have been studying maps longer than you and I put together, and they have “bags of tricks.” In Bastardi’s case, it is the second generation of studying maps.
What is important is to observe. Observe, observe, observe!
“Actually Thoughtful says:
January 19, 2012 at 11:19 pm
Werner Brozek – why is 10 years too long to ignore? Why have you cherry picked your dates so carefully?
Climate is defined as 30 years.”
I believe that both 10 years and 30 years are not correct. The real value should be 60 years since there seems to be a 60 year cycle as the following shows:
http://wattsupwiththat.files.wordpress.com/2009/03/akasofu_ipcc.jpg
Let me apply an analogy. Let us suppose that the day is warmest at 12 noon just for discussion sake. What the 30 year period does is take the trend from 2 A.M to 2 P.M. and says we are warming rapidly. What really should be considered is what happened from 2 A.M one day to 2 A.M the next day. So the 10 years of flatness in this analogy is from 10 A.M to 2 P.M. The way I see it is that in the big picture, the last 10 years of flatness merely confirms the 60 year cycle is still working and that we are now headed into a cooling mode. Under this scenario, we do not have to wait another 10 years to see 30 years of no temperature change, but we only need to wait 10 years. Using the clock analogy, when an hour passes to 3 P.M., you have to back to 9 A.M to get a straight line again. This is more or less what happened to RSS and HadCrut3 over the last month of cooling.
Then there is the other matter of us coming out of the LIA so there is a slight upward slope. How much of this slope is due to CO2 is a matter of debate, but I am convinced it is not enough to be the least bit concerned about.
Erinome says:
“Without knowing the provenance of this chart, I am suspicious of its veracity.”
Simple solution, then: provide us with evidence that the Obama Administration has reformed its regulations, and now encourages offshore drilling. Next, Erinome wonders:
“…why should the US be drilling in some of the most populous areas of the country, the seaboards?”
I haven’t noticed any “populous areas” a mile under water and five miles offshore. As to why we should be drilling there, it’s pretty obvious: that’s where the oil is. [Please don’t waste everyone’s time with scare stories about oil spills. BP’s Deepwater Horizon was a relatively rare event, and even though it gushed oil for months, today there is almost no sign of damage. The planet has been dealing with oil seeps for millions of years; some bacteria eat it up. Also, China and Cuba are drilling only 30 miles off the U.S. coast, and they have abysmal environmental records. But of course Erinome is silent about that]. Next, Erinome says:
“Moreover, federal land is for everyone to use and enjoy, not just energy companies.”
Since that federal land is on the seabed, I’m sure Erinome could go to the sea floor and enjoy it to his heart’s content, along with Spongebob. It’s not like the energy companies would mind. Finally, Erinome says:
“What I’m unhappy about, though, is the ~ 3 cents/kWh power generation via fossil fuels adds to everyone’s health costs.”
That is rank, baseless and false speculation. Life expectancy has greatly increased since oil was first discovered [and it literally saved the whales]. People live longer and healthier lives due to fossil fuels. I suspect Erinome drives a car, heats his home, uses plastic, eats food grown with fossil fuel-produced fertilizer, buys food and other products delivered by trucks and trains, and in general lives a much healthier, fuller and more comfortable life as a direct result of his fossil fuel use. But if Erinome actually walks the talk and shuns the use and benefits of fossil fuels, I’m sure he will tell us right away. Because hypocrisy isn’t pretty.
[BTW, this is probably why erinome’s utility bill went down, not because of ultra expensive “green” power.]
GregO says: January 20, 2012 at 7:50 am
I downloaded and plotted RSS last night and had my spreadsheet calculate a least squares linear regression and indeed it is increasing at something close to .16 C per decade. Correlation coefficient not too good and no surprise there.
Thank you GregO. These basic sanity checks go a long way. (Note that this trend represents the transient temperature response to longer term forcings without identifying what those forcings are. It is hard to see how this could be caused purely by an energy redistribution given that ocean heat content has risen across the satellite era.)
Your points regarding the “correct” temperature for the earth require a bit of discussion. There is nothing intrinsically special about 1975… It is not so much that there is a correct temperature as that the relatively stable climate of the holocene has allowed agricultural development (corn/maize for example took 1000s of years of human selection to become what it is today) which in turn has bootstrapped specialization and technology. (Why didn’t we have satellites 15,000 years ago?) +3C threatens to push many agricultural regions outside the norms of the last 10,000 years at a time when global population is expected to top 9 billion. Any system with a reserve can suffer excursions from “normality” for a while. That is not necessarily true for a persistent change and if that change is rapid adaptation may prove a challenge. Check out the evolution of the Palmer Drought Index.
Michael D Smith says:
January 20, 2012 at 4:53 am
We know water vapor is by far the better GHG, when available, AND it has the ability to also transfer enormous amounts of heat due to phase change, (which transports the heat to high altitude where there is a better radiation window) so doesn’t the effect of CO2 simply change the height at which, all else being the same, H20 phase changes occur?
Pure based on (laboratory measured) radiation energy absorption/re-emission, the influence of a CO2 doubling is not more than 0.9°C. That increase makes that more water vapour can hold in the atmosphere, which increases the GHG effect to 1.3°C. That is pure theoretical, but based on laboratory measurements for different single and combined air/GHG mixtures at different air pressures. So far so good.
The problems begin with clouds. The in/out energy balance of different types of clouds ánd changes in total cloud cover are some of the many big problems in climate models: In general, low level clouds have an overall cooling effect while high level clouds have an overall warming effect. But how much is a matter of debate and how higher temperatures affect cloud cover (or reverse!)? Even the sign of cloud cover response to temperature changes is not known for sure.
And you are right, water vapour changes states, not only in altitude but also in latitude: it is one of the main mechanisms that prevents overheating of the tropics and deep freezing of the near polar regions (except during glacial periods).
Thus in my opinion the climate models largely overestimate the positive feedbacks and even may have the sign wrong in the case of clouds. Therefore the effect of 2xCO2 is not zero, but lower than the 1.5°C low border of the IPCC/models range. After all we are very lucky to live on a water planet…
steven mosher says:
January 19, 2012 at 7:24 am
“…..As we add more GHGs we fill up the holes over time and the atmosphere becomes more opaque. This means the effective radiating height of the atmosphere will increase. Energy still escapes back to space, but the earth radiates from a higher and colder altitude. This latter factor is important. With more GHGs the atmosphere is more opaque. Earth then re radiates from a higher colder altitude. The rate at which energy is lost back to space is thereby slowed and the surface is warmer than it would be otherwise. You see GHGs dont warm the planet by getting hot themselves, they slow the cooling of the surface. Slowly, bit by bit, over very long stretches of time….”
The real truth is not in all the esoteric equations and the physics that everyone likes to repeat ad nauseam, it’s in the darned observations! You guys seem to get caught up in all this inside the air conditioned building, computerized modelling and physical law stuff and never look out the window anymore.
The guy in the link below has been keeping records at his house, a couple of miles from my house, from 2004 onwards. Do you see any freaking trend there?
http://www.wunderground.com/weatherstation/WXDailyHistory.asp?ID=KFLSAINT5&graphspan=custom&month=1&day=19&year=2004&monthend=1&dayend=20&yearend=2012
Time to quit the dependence on all these “non-violate” physical laws and all of the other modelling BS and start looking out the window again for a change – jeez! It could be refreshing :).
Best,
J.
Bob Tisdale says:
January 20, 2012 at 3:13 am
It sure does look to me like the Miller et al. paper agrees with everything I’ve been saying to you all along.
Incorrect. Both Miller and Copeland very clearly show the Aleutian Low (NPI) is an important component/driver of the PDO. The PDO index incorporates the NPI, not by accident one would think. Miller shows north Pacific SST’s being affected by the strength of the Aleutian Low, a diagram that perhaps you missed is shown below.
http://tinyurl.com/2dg9u22/images/aleutianlow.png
Copeland shows a stronger correlation between PDO/NPI than what the PDO/ENSO is capable of. By restricting yourself to a ENSO only driver of PDO is demonstrating your lack of understanding once again. By not taking account of all possible factors you display bad science that you are passing on to the public. On a similar note, have you amended your El Nino Rossby wave references to show this phenomenon is NOT a regular occurrence?
“”””” steven mosher says:
January 19, 2012 at 7:24 am
………………………………
Short wave in, longwave out. The various gases in the atmosphere including water vapor are more or less transparent to IR energy. Some of them really transparent, others not so transparent. C02 is rather opaque to IR. How do we know this? Well years of measurements. In fact, we build devices that depend upon this IR blocking fact. Yes, some C02 detectors depend upon this being true. And If you work on IR missiles you also would know this. Here is a simple demonstration showing how C02 is opaque to IR. “””””
So Steven, you say ‘water vapor is more or less transparent to IR’ Then for comparison, you say ‘CO2 is rather opaque to IR’.
Common English language usage, would then interpret these two statements, as being equivalent to stating that CO2 is far more opaque to IR than H2O is; or alternatively, H2O is far more transparent to IR than CO2 is.
Can you provide a link to some transmission or absorption graph, that demonstrates this superiority in IR absorption of CO2 over H2O.
Every such graph, I have ever found in peer reviewed literature or Text Books, claims exactly the opposite is the case.
Also, as to your British friend’s video demonstration (nice demo); would it be more believable if instead of using a many hundred deg C candle flame as an IR source, he used something closer to the real situation; such as perhaps an ordinary bottle of water at room Temperature (300 K).
Presuming that this chap is some sort of scientist; it would be nice if he was a bit more quantitative in his experiments, and his reports; such as for example stating the IR wavelength spectral region over which his camera is sensitive, and also how many parts per million of CO2 he actually added to his glass tube atmosphere.
I’d really like to know where I could buy a video camera that can take good resolution movies at 15 micron wavelength; which is the earth emitted wavelength region, that actually can get absorbed by CO2 in the atmosphere. Gee it is unfortunate, that it never crossed the chap’s mind to try adding water vapor to his tube of air just to demonstrate that it really is transparent to IR.
Steven Mosher
says
“From what Joe says about trace gas and from what he says about specific gravity it looks like Joe utterly misunderstands the mechanism of global warming. He thinks C02 traps heat. It doesnt. that is not the theory.”
Steven
Did you even listen to the video you provided as your proof?
On several occasions it says CO2 traps the heat!!
Do you need to aplogize to Joe?
Erinome says:
January 20, 2012 at 11:10 am
Actually my electricity rate is the lowest it’s been in years: 6.9 cents/kWh, due to a strong emphasis on renewable power in my region. Four years ago it was 11.1 cents/kWh, and 8 years ago, in another region, it was 16.2 cents/kWh.
=======================================================
Prove it. That’s one of the most fallacious babbling piece of misinformation I can imagine!!!
Today, I had to explain to a customer why a non-profit electric co-operative has a thing we call an electric purchase cost adjustment. We have those because when our nuclear plants and coal plants shut down for maintenance, we have to buy our energy from other sources. I live in Kansas, care to guess what asinine POS alternative fuel we’re buy that compels us to charge more than what we normally would? It isn’t hydro.
Pull your head out or quit trying to deceive people. Just because you want the lie to be true doesn’t mean it is. Show us the numbers hot-rod.
“”””” Ferdinand Engelbeen says:
January 20, 2012 at 3:26 pm
“”””” Michael D Smith says:
January 20, 2012 at 4:53 am
……………………………………… “””””
The problems begin with clouds. The in/out energy balance of different types of clouds ánd changes in total cloud cover are some of the many big problems in climate models: In general, low level clouds have an overall cooling effect while high level clouds have an overall warming effect. But how much is a matter of debate and how higher temperatures affect cloud cover (or reverse!)? Even the sign of cloud cover response to temperature changes is not known for sure “””””.
Well I have experienced a great many clouds, of all different types and at all different altitudes from ground level up to as high as clouds can exist.
Never once have I experienced the Temperature to WARM up when ANY CLOUD ANYWHERE gets between me and the sun. It ALWAYS COOLS.
As to the effect of height on cloud effect, the shadow cast by a cloud is essentially indpendent of the cloud height, because the sun is a near point source with a half degree divergence, so it forms sharp shadows.
The ground or atmospheric IR emittance is at least Lambertian (cosine theta) or even isotropic, so the cloud interception diminishes with at least the inverse square law, so the higher the cloud, the less IR it intercepts.
Now practical clouds do get less dense with higher altitudes, and as a result of that molecular density reduction, they actually absorb less sunlight, and also scatter (albedo reflect) less sunlight directly back into space.
BUT !!! for the very same reason of diminished density with height, the cloud also intercepts an ever diminishing part of the surface IR THAT ACTUALLY HITS THE CLOUD, but the inverse square law wins and IR interception decreases faster than ground level sunlight decreases, due to the wide angular dispersion of the surface emitted IR.
Net result is that clouds (ANY CLOUDS) always reduce ground level sunlight, and always reduce it more than they do the surface emitted IR; and ther higher the clouds, the less of both gets absorbed or reflected. There is NO cloud height, at which the Temperature at the surface goes up, because of the presence of the cloud.
Now there is a correlation between the surface Temperature and humidity, and the height of the clouds that subseqently form as a result. The warmer the surface Temperatures, the higher the moisture must go, before the natural Temperature lapse rate gets it down to the dew point so clouds can form; and the lower the surface humidity, the lower will be the dew point so again the clouds will form at a higher altitude; and they will still always result in surface cooling (when the sun goes down, and stops heating the ground).
Ammonite says:
January 20, 2012 at 12:50 pm
Your points regarding the “correct” temperature for the earth require a bit of discussion. There is nothing intrinsically special about 1975… It is not so much that there is a correct temperature as that the relatively stable climate of the holocene has allowed agricultural development (corn/maize for example took 1000s of years of human selection to become what it is today) which in turn has bootstrapped specialization and technology. (Why didn’t we have satellites 15,000 years ago?) +3C threatens to push many agricultural regions outside the norms of the last 10,000 years at a time when global population is expected to top 9 billion. Any system with a reserve can suffer excursions from “normality” for a while. That is not necessarily true for a persistent change and if that change is rapid adaptation may prove a challenge. Check out the evolution of the Palmer Drought Index.
=============================================================
Ammonite, I hate to interject, mostly because Greg has adequately muted most of your points, but, yes, we should check the Palmer Drought index, but we should also compare it in an historical context….. it’s relevance sort of falls by the wayside when we do. +3C? When is that going to happen? CO2 effecting the temp is supposedly logarithmic. In the last 100 years or so we’ve gained 1° …. Of course, we’ve lost a tenth or so in the last decade…… but to get to 3, we must, according to current theory and observations, we’re going to have to get to about 1500ppm. I think we’ll be ok.
Here, try this…. http://suyts.wordpress.com/2011/12/06/if-only/
Even if the prognostications were to be true, you honestly believe 3°C would do anything other than strengthen the flora and fauna? This time of year the flora and fauna, in my part of the world undergo more than 3 degree change a day. Which, btw, the higher part of the increase seems to correlate with the flora and fauna thriving. Weird, …. isn’t it?
The flora and fauna present today is because of their adaptability. This shouldn’t require thought, but I’d ask you to dwell on this for a moment.
James Sexton says: January 20, 2012 at 8:30 pm
Even if the prognostications were to be true, you honestly believe 3°C would do anything other than strengthen the flora and fauna? This time of year the flora and fauna, in my part of the world undergo more than 3 degree change a day.
Hi James. You are responding to an entry above that states “Any system with a reserve can suffer excursions from “normality” for a while. That is not necessarily true for a persistent change and if that change is rapid adaptation may prove a challenge.”
The fact that you can hold your breath for a minute does not mean it is a good idea to live underwater. I suggest Mark Lynas “Six Degrees” for potential impacts should a +3C change eventuate. It provides copious references to primary literature. I do not share your optimism that such a change would bring only benign effects and benefits.
George E. Smith; says:
January 20, 2012 at 8:02 pm
Net result is that clouds (ANY CLOUDS) always reduce ground level sunlight, and always reduce it more than they do the surface emitted IR; and ther higher the clouds, the less of both gets absorbed or reflected.
It is more complicated than that…
The net effect of (icy) cirrus clouds is warming: while reflecting sunlight during the day, they reflect more IR over the full 24 hours of a day, as ice in the IR spectrum is a near black body. Even low level clouds in the mid latitudes are near radiation neutral: more sunlight is reflected upward, but more IR is reflected downward too. Compare the day/night temperatures with and without clouds: full cloud cover keeps the surface cool during the day, but the night temperature doesn’t get (much) lower than the day temperature…
Water vapour also plays a role: compare the diurnal temperature in a desert with cloudless days in areas where the air humidity is much higher…
the cloud also intercepts an ever diminishing part of the surface IR THAT ACTUALLY HITS THE CLOUD
That would be true if the ground radiation was from a point source. But as the whole surface emits IR, it hardly matters, as the cloud receives IR from every part of the surface up to the horizon. Only the increase in total area between ground level and some 10 km height plays a very small role (0.2%)…
—————
Anyway, there are a lot of unknowns in cloud matters…
The current climate models all expect a positive feedback from clouds, quite different for different models but all expect that higher temperatures give less clouds. But if one asks any specialist in cloud matters, he/she expects a negative impact… Moreover, Dr. Spencer defends the theory that cloud cover changes (caused by pressure changes, solar changes,…) are the main cause of the temperature changes…