By Joe Bastardi, Weatherbell Analytics
When the PDO turned cold, most of the meteorological and climate community understood that the pattern was turning very similar the last time of the PDO reversal, the 1950s, and it was a matter of time before the global temperatures, which have leveled off, would start falling in the same herby jerky fashion they had risen when the PDO turned warm at the end of the 1970s. I am not going to rehash the sordid details of how the AGW crowd simply ignores the major drivers of a cyclical nature. We all know that. Nor am I going to question them as to why they believe a trace gas like CO2 (needed for life on the planet) with a specific gravity of 1.5 as compared to the atmospheres 1.0, was going to mix with air in a way to affect the earth’s temperatures. Instead I am going to drive home points I have been making since 2007 and are now dramatically validating.
The La Ninas of 2008-09 and now this one had rapid mid level temperature drops that followed their onset and this years was nothing short of the most dramatic mid tropospheric drop since the start of the millennium. It is much more plausible to believe that rapid cooling in the mid levels would have an effect at leading to extremes, rather than what the warmingistas claim, which of course is anything that happens. In any case, one very interesting level that cooled to record cold levels was 400 mb, the very levels that the so called trapping hot spots were going to show up because of CO2…again a neat trick since somehow CO2 was going to defy the laws of Gravity, since, as mentioned above, its specific gravity is higher than the atmosphere (of course even if it was, it a) has not been proven to cause warming and b) man’s contribution is so tiny as to render it a non item anyway in climate considerations.
However first came the flip in the PDO, seen nicely here on the Multivariate Enso Index chart, which clearly illustrates the colder Pacific when the earth was colder, the start of the warming period coinciding with the satellite era, and now.

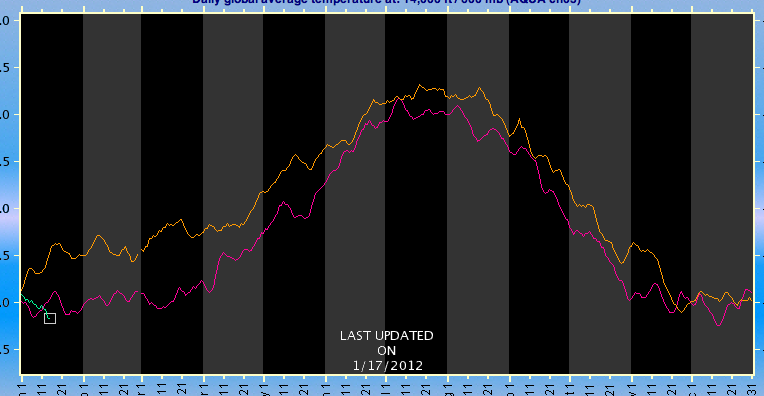
Now from the AMSU site, the amazing one year drop in temperature, the orange tan line being after the El Nino of 2009/10, the purplish line this past year and one can see the green this year, we are near record cold levels again.

600 mb (14,000 feet) (enlarged)
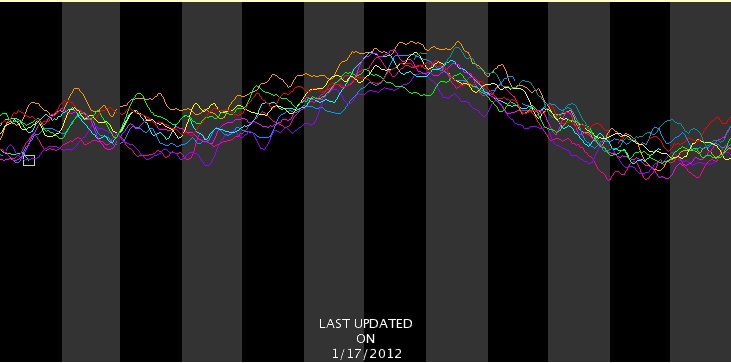
And oh my my, the trapping hot spot itself.. 400mb or 25,000 feet… coldest in the entore decade

But the 2 meter temperatures, being in the boundary layer, do not respond as fast as the ocean, or a transparent atmosphere above
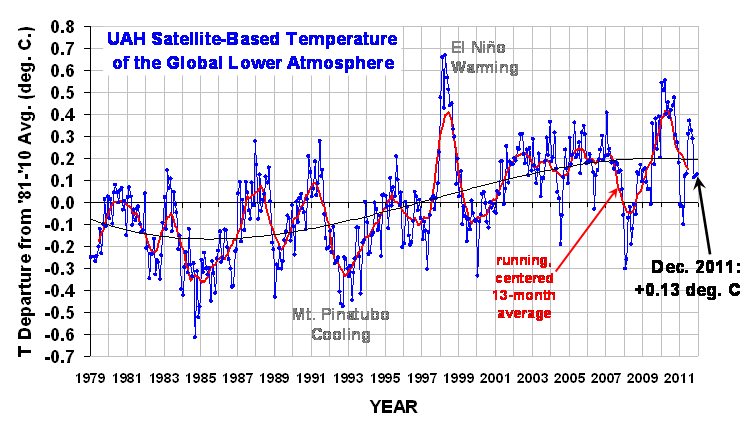
Nevertheless three downturns in a jagged fashion started predictably after the last El Nino now falling again in fits and spurts through December.
From Dr Roy Spencer’s site:

(enlarged)
In May, I forecasted the global temperatures to fall to -0.15C in one of the months – Jan, Feb or Mar this year, and perhaps as low as levels we saw in the 2008 La Nina. A rapid free fall has begun. Dr. Ryan Maue at his site (http://policlimate.com/weather/) maintains a plethora of useful forecast information including GFS global temp projections over the next 16 days.
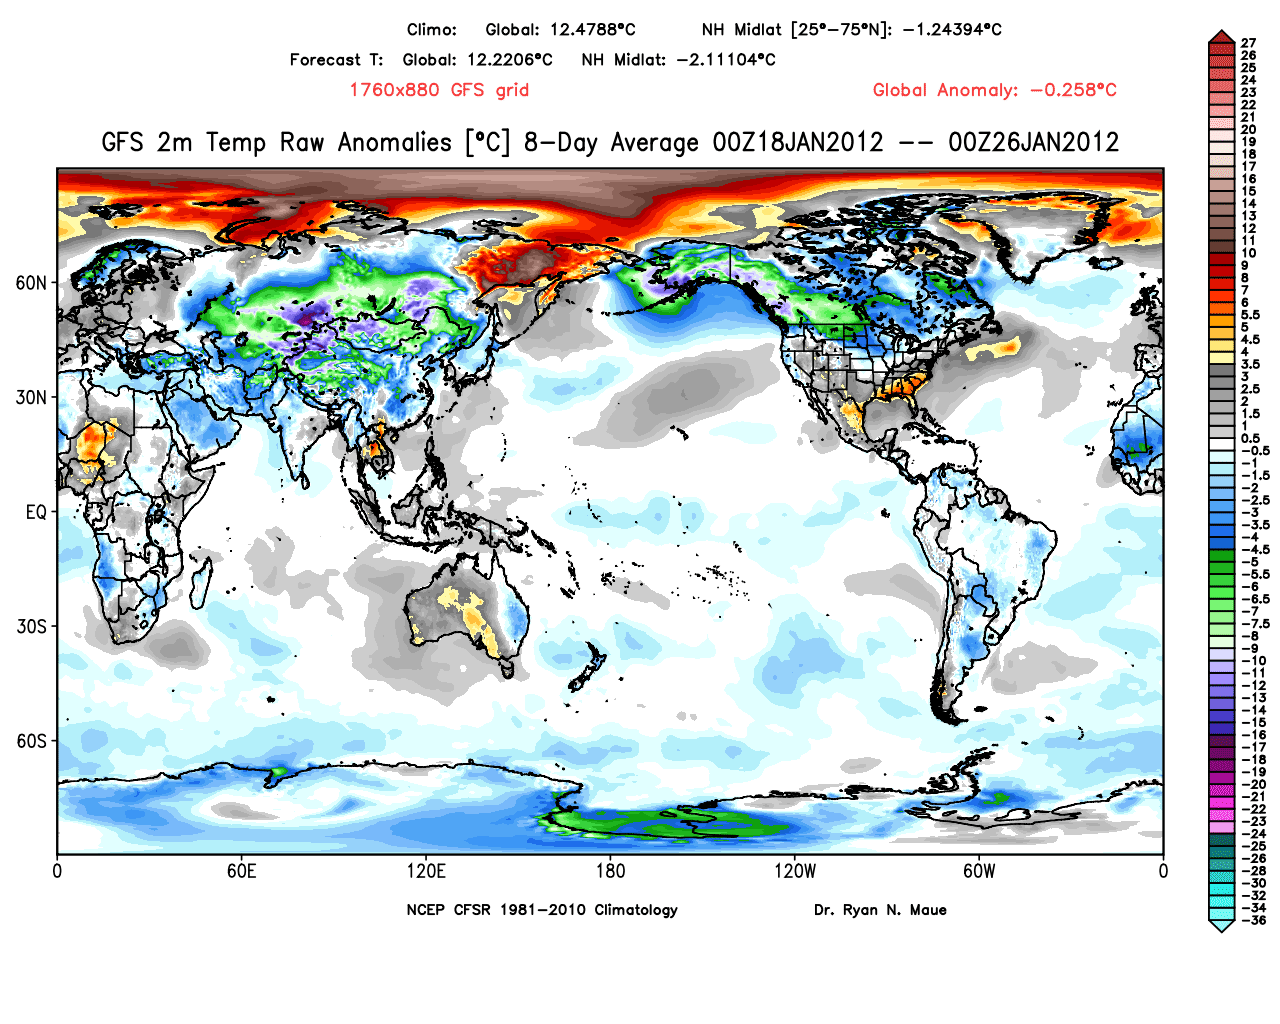
They have been routinely reading greater than 0.2 C below normal and I suspect the Jan reading will plummet quite a bit from December with February even lower. An example of this can be seen with these two charts off Ryan’s site,

-0.258 C globally for 2 meters. (enlarged)

Day 8.5-16 a whopping -0.352 C (enlarged)
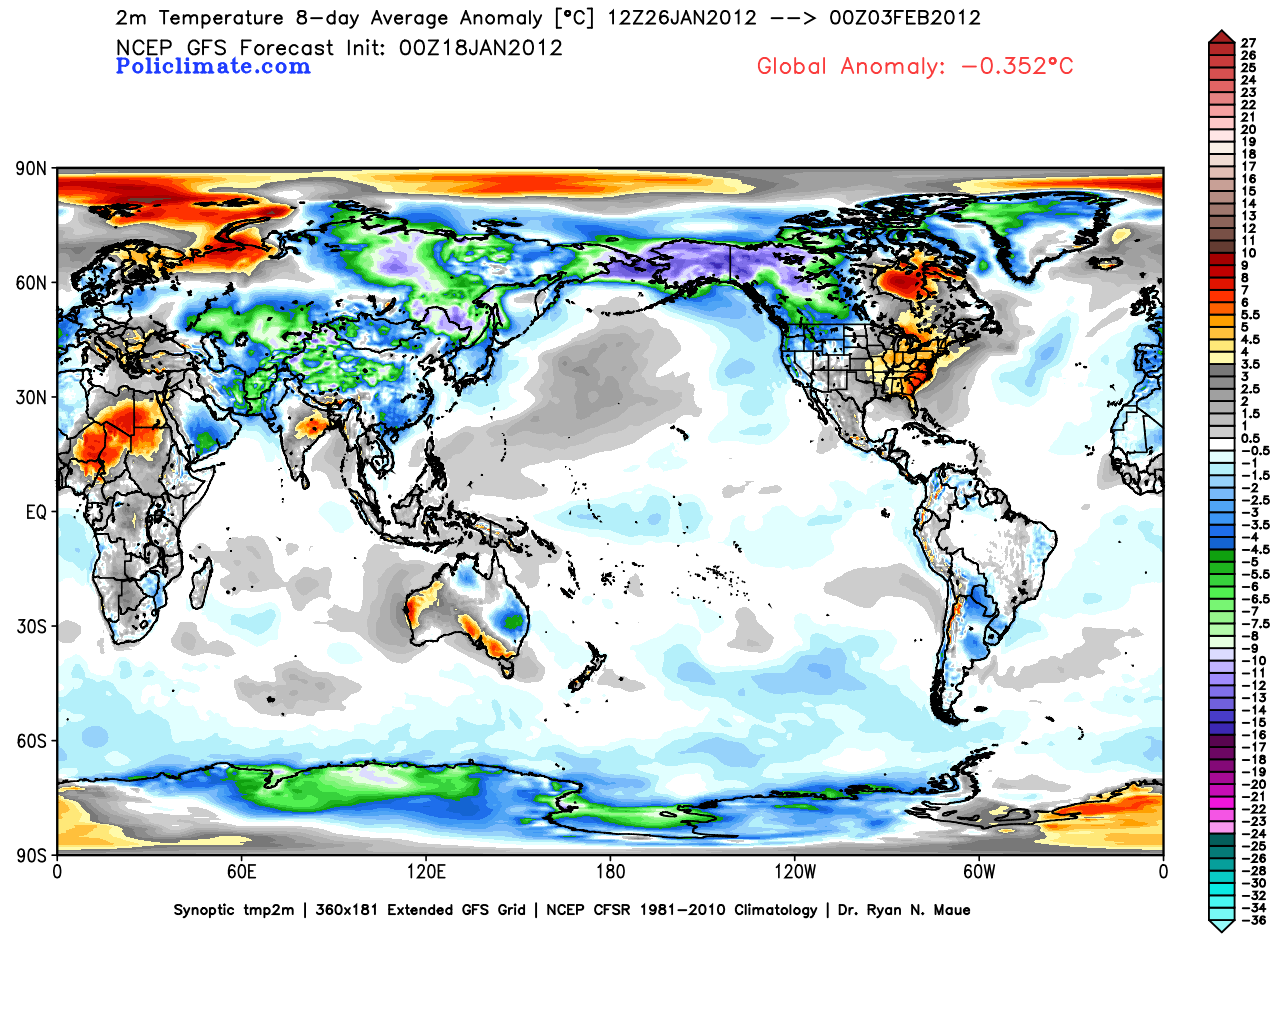
The reason the arctic looks warm is that it has been stormy, and when it’s windy the air is well mixed and so the temperatures are not as low as if it’s calm, but it’s still frigid. Notice in the second map, that the arctic cools because the arctic oscillation is starting to go negative, leading to higher pressures and lighter winds. But the most astounding aspect of this is the northern hemisphere mid latitude temperatures, at -2.1 C.
Currently, with gas so high because we are being handcuffed by an administration that won’t drill (if gas was a 1.50 lower, it would be worth a half trillion dollars to the economy) and an EPA that is causing untold economic damage (I would conservatively etiolate a half trillion dollars, from jobs lost to burdensome regulations) along with a 100 billion dollar subsidy to fight global warming world wide, it is costing each ACTUAL TAX PAYER close to 7000 dollars (1.1 trillion divided by 150 million tax payers).
One has to wonder, how even the most dogmatic of them don’t look at the actual facts, how they can continue to carry on their denial while the results of such things handcuff the American economy and cause untold misery for many as our wealth is not only redistributed, but dwindles. One can only conclude this is being done on purpose, and with purpose.
See PDF with enlarged images.
UPDATE: Bob Tisdale disagrees with portions of this analysis and has an essay here.
Rejoice! By crashing the economy, AGWers are going to solve the immigration problem!
an interesting line in the blog there from Joe, and one I would suggest we look into in more earnest – “One has to wonder, how even the most dogmatic of them don’t look at the actual facts, how they can continue to carry on their denial….”
the D word. Perhaps the shoe is fitting the other foot now and it is those with their heads in the sand of CAWG who are indeed the “deniers” Turn their own weapon against them.
Sticking with the “…the global temperatures, which have leveled off,..” meme, Joe? That’s so last week; you must not be aware of HadCRUT4.
James Annan instructs, “… HadCRUT3 under-represents the Arctic warming, so it’s hardly a surprise that … that this improvement increases the recent warming a little relative to earlier years.” http://julesandjames.blogspot.com/2012/01/not-so-fast.html
Joe, Are you claiming that if we measure CO2 levels at altitude that we will find lower percentages than at sea level? That’s what it sounds like.
Don’t know that you will see this comment, Joe, but I’ve been a fan of your for many years (I’m from Harrisburg).
You have always been impressive. Keep up the good fight!
Just a query about the WUWT climate widget page
Is http://wattsupwiththat.com/widget/ first temp graph on page,
apparently showing a REAL TIME temperature from UAH as it shows January 2012 already at -0.01C?
If so great idea please don’t modify as it will be the only real mean (estimated) UAH temperature time graph available as far as I can tell.
Joe you’re use of common sense and basic science will get you nowhere, you need at least, a super computer, various computer models to run on it and vast amounts of green funding to get the ‘right’ answer…
Being sarcastic is tiring, I need a lie down now……
Joe vs. the English language. Joe wins!
Your not you’re! Oops!….
Bold mine. Of course it is. The only way to foist a world government on us is to break the economic back of the developed countries, with the US leading the way as the number 1 target. In a free world, such control cannot happen without creating a scare big enough to convince enough of the kingdom to hand over the keys to the stewards. Most people are willing to sacrifice liberty for security… until it’s too late to understand the true cost of that sacrifice.
Mark
Mr. Bastardi: You are constantly talking about cooling. I don’t see that in the graph from Roy Spencer. What I expect is temperatures to turn back to levels seen in 1983/85 for example. That’s cooling to me. Not what you are trying to illustrate here.
I don’t think there is a single chance that it will go there in the future as long as we keep having an influence on climate.
Face it Mr. Bastardi: CO2 is having some effect on climate. Even Roy Spencer acknowledges that. So in fact we are already looking at the human signal when staring at Roy’s graph.
Do you acknowledge that CO2 is having some effect (Let’s say 1-1.5 degrees C with a doubling of CO2) or do you think CO2 isn’t having any effect at all? I never heard you answering that question.
herby jerky=herky jerky?
I hate to be critical of an excellent piece like that, but since “specific gravity” is by definition related to the density of water, wouldn’t “relative density” be the proper term?
Thanks Joe. A related story…from Alaska
Copper Basin 300 canceled because of ‘impassible’ trail conditions
Jan 16, 2012
FAIRBANKS — The Copper Basin 300 sled dog race is the latest victim of Alaska’s weird winter weather pattern as race officials canceled the event Sunday morning, less than a day after the race started.
…
Temperatures were consistently 45 to 50 below zero, according to race officials.
(I’m assuming -40 F to – 50F, but it hardly matters…)
I think you are drawing an artificial distinction between a climate driven entirely by cyclical processes, or entirely by a linear response to CO2. Why not the two combined? [with some other processes added in for good measure too!]
Thanks, Joe!
What does everyone think of Richard Betts’ post over on nature.com? See: http://blogs.nature.com/soapboxscience/2012/01/18/climate-science-%E2%80%93-moving-beyond-a-single-issue
Nice writeup Joe! It really is sad how obvious it is when looking at the temperature charts going back to 1900 that: 1) there was unexplained “global warming” that peaked in the 40s and 2) a significant part of the recent warming is most likely cyclical too.
Of course, who are we to let facts and reason get in the way of a good cause right?
: )
Joe, your last sentence (One can only conclude this is being done on purpose, and with purpose.) is correct. Pick up a copy of Mark Levin’s new book; “Ameritopia”.
But while the Arctic appears to be warmer than normal due to stormy wather, the accumulation of ice is STILL almost on par with the average freezing pattern of about 10 years ago.
Makes me think, what might become of the northern hemisphere, once all the latent heat contained in the arctic ocean and the lower arctic troposphere will have been released and irradiated into space.
To me, this looks like we are heading into an awfully long, cold late winter/early spring, folks.
After reading McKitric’s postings, I figure that the earth will show a global “cooling” with our current economic downtrend. A lot of what we’re measuring is not global average temperatures, but waste heat from industrial activity.
http://www.rossmckitrick.com/uploads/4/8/0/8/4808045/ac.preprint.pdf
If you assume most of industrial production is concentrated in urban areas, where most of our thermometers are, you find that surface flux has increased about 3 watts or so over the last century due to an increase in energy output -comparable to the 3.7 watts we’d supposedly get from a doubling of CO2.
Oy.
“One has to wonder, how even the most dogmatic of them don’t look at the actual facts, how they can continue to carry on their denial while the results of such things handcuff the American economy and cause untold misery for many as our wealth is not only redistributed, but dwindles. One can only conclude this is being done on purpose, and with purpose.”
IMHO, they don’t look at the facts because, for them, the climate and environment are religious and ideological issues, not scientific ones. Their religious creed or ideological belief system is centered on the Gaia hypothesis with humankind’s activities disrupting the workings of the living organism known as Earth.
I cannot say to what extent the Gaia hypothesis is true. But to the extent that it is treated as a religion today, the only sicence that matters to the Green Left is the “science” that fits in with this belief — including that of climate change. The emotional embrace of and devotion to the “religion” trumps any contrary science — science that is to be ignored and suppressed because the “religion” comes first.
Again this is just my opinion, but in my mind it explains the behavior of climate alarmists and environmentalists in this day and age.
Well said. Hard to look at any particular thing in politics and make any sense at all out of it.
This is causing more and more anger, evidenced in many different ways, against the current system.
We are indeed living in interesting times.
JimB
… and it appears to be predictable:
http://www.vukcevic.talktalk.net/CET-NVa.htm
Further, on your point about the mass of a CO2 molecule, when compared to N2, a quick google search shows up a research paper by Waleter Bischoff (1961), who made a number of measurements of CO2 at different heights above Scandinavia.
He *did* find that on average the concentration of CO2 declined with height, but the rate of this decline is really quite modest – from the highest value of 318ppm below 200m to the lowest value of 312ppm at near to 3km.
This isn’t terribly surprising – there’s a lot of mixing from convection and cyclones and other processes that stop the atmosphere from settling out on the basis of weight.
The sort of fractionation that you are expecting does occur when you go higher up in the atmosphere – I guess above 90km or so.
So, there is plenty enough CO2 in the upper troposphere, and you might want to edit your article to reflect that.