By Joe Bastardi, Weatherbell Analytics
When the PDO turned cold, most of the meteorological and climate community understood that the pattern was turning very similar the last time of the PDO reversal, the 1950s, and it was a matter of time before the global temperatures, which have leveled off, would start falling in the same herby jerky fashion they had risen when the PDO turned warm at the end of the 1970s. I am not going to rehash the sordid details of how the AGW crowd simply ignores the major drivers of a cyclical nature. We all know that. Nor am I going to question them as to why they believe a trace gas like CO2 (needed for life on the planet) with a specific gravity of 1.5 as compared to the atmospheres 1.0, was going to mix with air in a way to affect the earth’s temperatures. Instead I am going to drive home points I have been making since 2007 and are now dramatically validating.
The La Ninas of 2008-09 and now this one had rapid mid level temperature drops that followed their onset and this years was nothing short of the most dramatic mid tropospheric drop since the start of the millennium. It is much more plausible to believe that rapid cooling in the mid levels would have an effect at leading to extremes, rather than what the warmingistas claim, which of course is anything that happens. In any case, one very interesting level that cooled to record cold levels was 400 mb, the very levels that the so called trapping hot spots were going to show up because of CO2…again a neat trick since somehow CO2 was going to defy the laws of Gravity, since, as mentioned above, its specific gravity is higher than the atmosphere (of course even if it was, it a) has not been proven to cause warming and b) man’s contribution is so tiny as to render it a non item anyway in climate considerations.
However first came the flip in the PDO, seen nicely here on the Multivariate Enso Index chart, which clearly illustrates the colder Pacific when the earth was colder, the start of the warming period coinciding with the satellite era, and now.

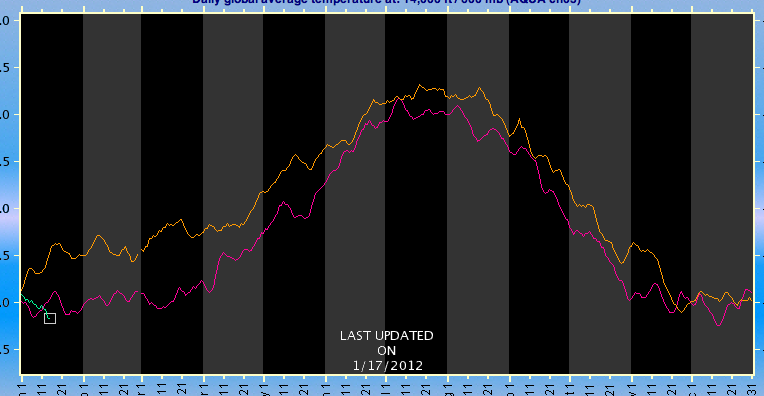
Now from the AMSU site, the amazing one year drop in temperature, the orange tan line being after the El Nino of 2009/10, the purplish line this past year and one can see the green this year, we are near record cold levels again.

600 mb (14,000 feet) (enlarged)
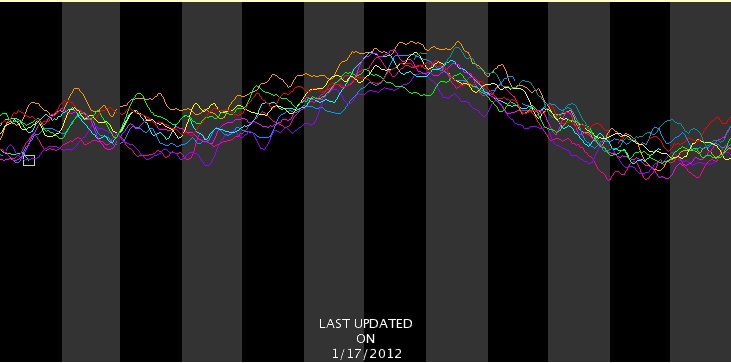
And oh my my, the trapping hot spot itself.. 400mb or 25,000 feet… coldest in the entore decade

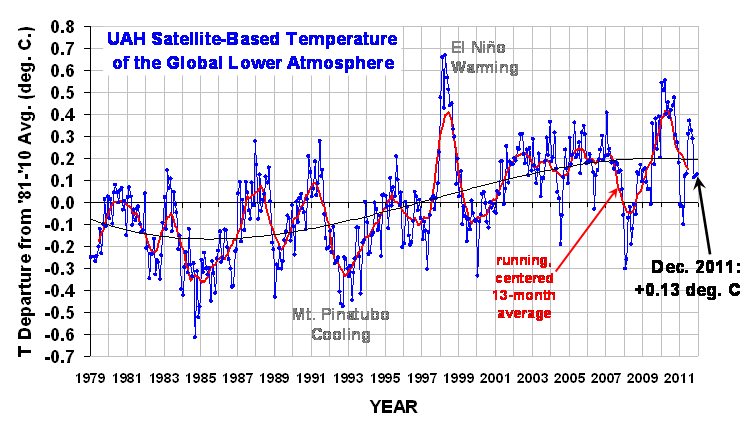
But the 2 meter temperatures, being in the boundary layer, do not respond as fast as the ocean, or a transparent atmosphere above
Nevertheless three downturns in a jagged fashion started predictably after the last El Nino now falling again in fits and spurts through December.
From Dr Roy Spencer’s site:

(enlarged)
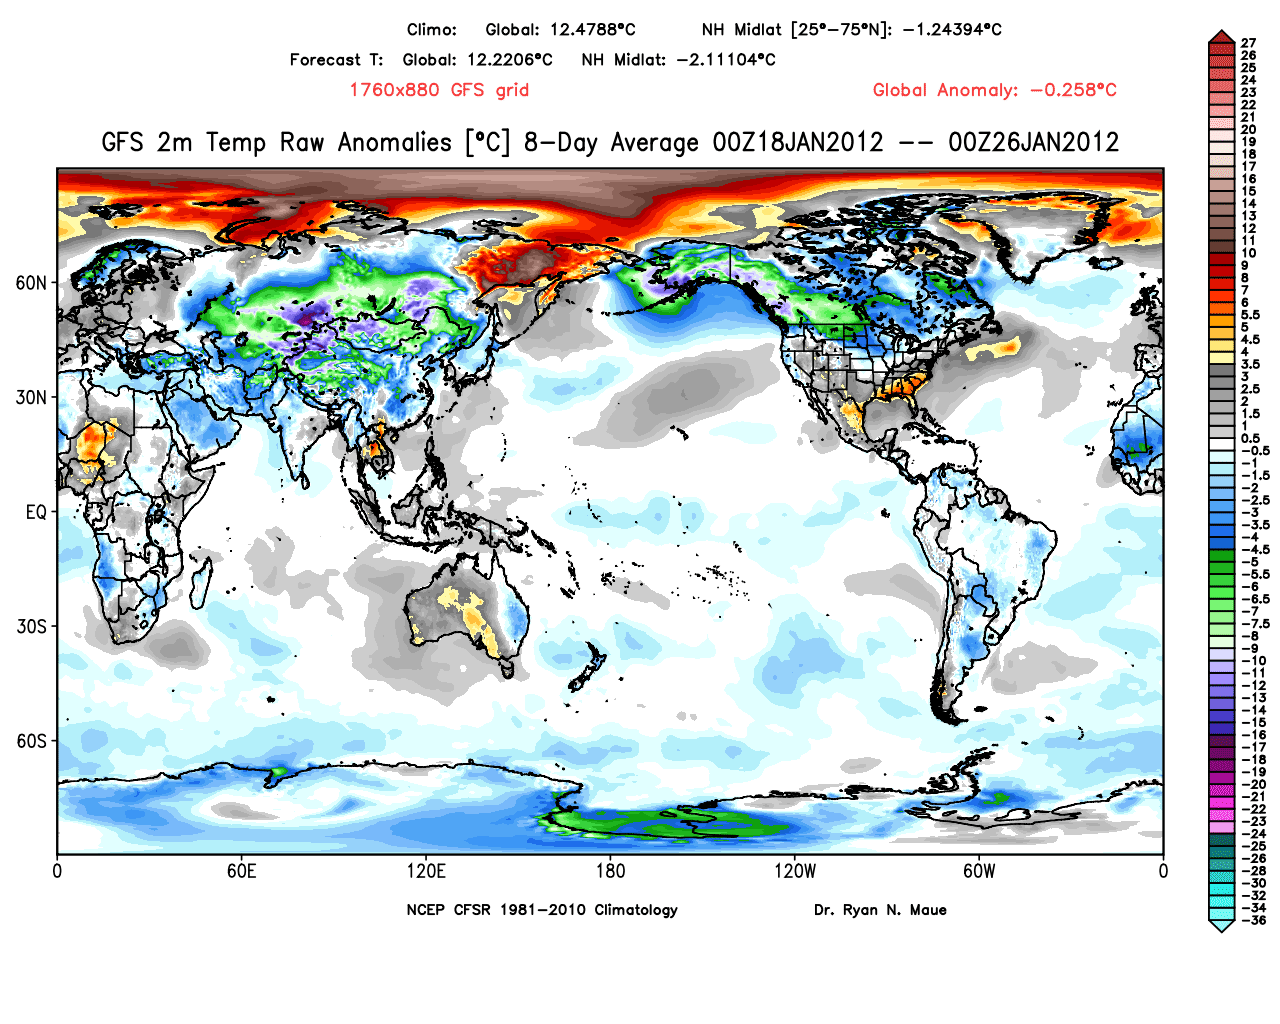
In May, I forecasted the global temperatures to fall to -0.15C in one of the months – Jan, Feb or Mar this year, and perhaps as low as levels we saw in the 2008 La Nina. A rapid free fall has begun. Dr. Ryan Maue at his site (http://policlimate.com/weather/) maintains a plethora of useful forecast information including GFS global temp projections over the next 16 days.
They have been routinely reading greater than 0.2 C below normal and I suspect the Jan reading will plummet quite a bit from December with February even lower. An example of this can be seen with these two charts off Ryan’s site,

-0.258 C globally for 2 meters. (enlarged)

Day 8.5-16 a whopping -0.352 C (enlarged)
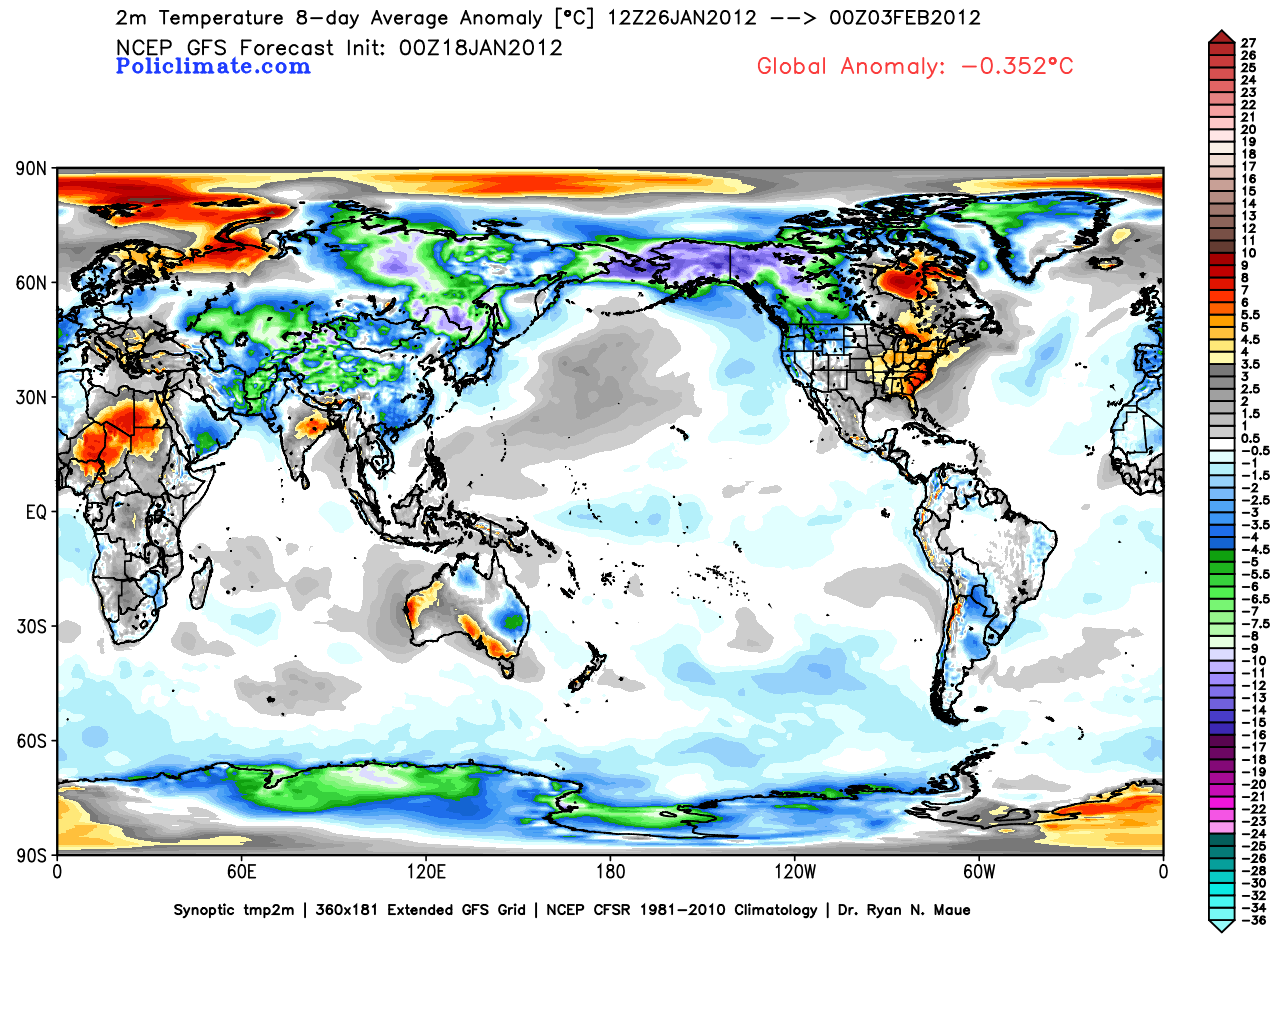
The reason the arctic looks warm is that it has been stormy, and when it’s windy the air is well mixed and so the temperatures are not as low as if it’s calm, but it’s still frigid. Notice in the second map, that the arctic cools because the arctic oscillation is starting to go negative, leading to higher pressures and lighter winds. But the most astounding aspect of this is the northern hemisphere mid latitude temperatures, at -2.1 C.
Currently, with gas so high because we are being handcuffed by an administration that won’t drill (if gas was a 1.50 lower, it would be worth a half trillion dollars to the economy) and an EPA that is causing untold economic damage (I would conservatively etiolate a half trillion dollars, from jobs lost to burdensome regulations) along with a 100 billion dollar subsidy to fight global warming world wide, it is costing each ACTUAL TAX PAYER close to 7000 dollars (1.1 trillion divided by 150 million tax payers).
One has to wonder, how even the most dogmatic of them don’t look at the actual facts, how they can continue to carry on their denial while the results of such things handcuff the American economy and cause untold misery for many as our wealth is not only redistributed, but dwindles. One can only conclude this is being done on purpose, and with purpose.
See PDF with enlarged images.
UPDATE: Bob Tisdale disagrees with portions of this analysis and has an essay here.
Donald L. Klipstein says:
These measurements show most but not all of the signs of AGW. For one thing, the amount of AGW shown by these is less than modeled.
Which models? There are hundreds of models over more than 4 decades now (11 if you count Arrhenius), all of which make different assumptions about emissions scenarios, including (importantly) sulfate aerosols. Your statement is so overly broad it’s meaningless….
Werner Brozek says:
Could you please answer this question for me: Was Phil Jones correct with his answer to question B (in February 13, 2010) at:
http://news.bbc.co.uk/2/hi/science/nature/8511670.stm
You know, I honestly can’t answer that, for several reasons:
1) I don’t know exactly what data Jones was using — monthly, annual? — and over exactly what time period (Jan 1995 to Jan 2010, Jan 1996 to Jan 2010, etc?)? It’s not clear to me what the wording of the question means, “…from January 1995….”
2) I don’t know what dataset Jones was using. HadCRUT3 I assume. But the numbers are revised all the time, slightly, for past months, but sometimes going back years. I can’t find a revision history on their site, but I believe there were some significant revisions to their January numbers for recent years going back at least a decade. I’m not sure why.
3) I have taken statistical uncertainty into account, but not measurement uncertainty. The Hadley said says annual values are uncertain to +/- 0.05 C. Is the same true for monthly measurements? Is this a 1- or 2-sigma confidence level?
With the above provisions, here’s what I find for the linear trends for the last time I downloaded the HadCRUT3 data, about one month ago. Uncertainties are the 95% confidence level.
Jan 1995 – Jan 2010: +0.112 +/- 0.040 C/decade
Jan 1996 – Jan 2010: +0.098 +/- 0.045 C/decade
The time periods include the end months. So by my calculation the warming IS statistically significant. I would certainly welcome checks on my results.
Since Jones knew exactly what data he was using and presumably did the calculation himself, I would think he knew what he was talking about.
Smokey: Of course — OF COURSE — it is necessary to give a cause for global warming. That’s bleeding obvious. GW isn’t a fundamental force; the Earth is a system that responds to fundamental forces. A change in temperature requires a flow of energy/heat. What is that flow from???
Explain where Americans were given the choice to vote for cheap fuel.
The voting booth. Candidates discuss their positions, which are well-covered by the media.
Oil wells do not risk fishing grounds, beaches, ‘viewsheds’, etc.
Tell that to residents of the Gulf Coast. Read (and see the pictures) on The Stuart Smith Blog.
No one makes people buy gasoline or heating oil, they want to buy it. Who are you to tell them they can’t, chump?
We all have an equal say in how our national resources are managed.
Aside from believing that everyone else here is wrong, you exhibit extreme hypocrisy by using fossil fuel products yourself while badmouthing their producers.
As society is currently structured, there is little choice about one’s energy needs or how they are filled. And I’m not bad-mouthing energy companies; I’m saying we have plenty of cheap oil (cheap enough), should hold some in reserve, and should decrease its use because of its many, large negative side-effects — INCLUDING releasing carbon into the atmosphere on geologic scales.
I have never disputed the longest-running temperature record in the world, because it has been recorded on the same instrument.
What instrument? The Hadley data is based on thousands of thermometers with many different lifetimes, taken in many different ways at many different places. It is no one instrument, but a vast series of measurements. You accept, then, the BEST results and believe Anthony’s objections are not valid?
Erinome says:
“Of course — OF COURSE — it is necessary to give a cause for global warming. That’s bleeding obvious.”
Wrong, even if you yell in all caps. Here, let Prof Richard Lindzen explain it to you:
Thus, no specific explanation is necessary. Desirable, yes. Necessary? No.
Celestial spheres explained the motion of the stars and planets, including retrograde motion. But the explanation was completely wrong, as is the claim that CO2 is the primary cause of global warming, which is based on the logical fallacy of the argumentum ad ignorantium: “Since we can’t think of any other reason for global warming, then it must be due to CO2.” Wrong. As Dr Lindzen explains, it is natural warming. And the warming has been going on at the same rate since well before CO2 began to rise, therefore CO2 is the wrong cause.
And please don’t cite BEST. It’s been debunked.
Bill Illis: Thanks for the link to the animation of the Navy Layered Ocean Model (NLOM) speed layer data. I’ll have to rummage through their archives one of these days. They always have great visuals.
Regarding the types of realistic indices for the North Pacific, I would hope the KOE SST anomalies would be considered due to its influence on Northern Hemispere TLT and Surface Temperature anomalies. The secondary effects of ENSO really show up there. If memory serves me well, the KOE variations are about 40 to 50% of NINO3.4 SST anomalies. And for the whole basin, why not simply detrend North Pacific SST anomalies, similar to the AMO. That would end the confusion. Stephen Wilde has been using that in his discussions recently, if memory serves, and calling it something like the Pacific Multidecadal Oscillation.
Regards
“Erinome says:
January 22, 2012 at 11:42 am”
Thank you for your detailed reply!
When I plot “HADCRUT3 unadjusted global mean” in woodfortrees from 1995 to 2010, it gives me a slope of #Selected data from 1995
#Selected data up to 2010
#Least squares trend line; slope = 0.010666 per year
This is in the ball park for Jones’ value of 0.12 per decade.
(This would be monthly data from January 1, 1995 to December 31, 2009.)
http://www.woodfortrees.org/data/hadcrut3gl/from:1995/to:2010/trend/plot/hadcrut3gl/from:1995/to:2010
“I have taken statistical uncertainty into account, but not measurement uncertainty.”
I assume that whatever Jones took into account was reflected in the 95% error bars at:
http://hadobs.metoffice.com/hadcrut3/diagnostics/global/nh+sh/
Based on those error bars, I believe I have figured out where Jones is coming from. He gets a different value than you. However I wish to stress that I am NOT suggesting that you or Jones is right and the other wrong. For example, 2011 was 12th warmest on RSS but 9th warmest at UAH. They are just different for their own reasons.
“Erinome says:
January 21, 2012 at 7:41 pm
Werner Brozek says:
we could say that we now have 17 years of warming that is NOT significant at the 95% level.
That’s not true.”
Let me rephrase that to:
Once the data for December, 2011 are in, and if Jones were to be asked a similar question in an interview, Jones could very well say:
B – Do you agree that from 1995 to the present there has been no statistically-significant global warming
Yes, but only just. I also calculated the trend for the period 1995 to 2011. This trend (0.084C per decade) is positive, but not significant at the 95% significance level. The positive trend is quite close to the significance level. Achieving statistical significance in scientific terms is much more likely for longer periods, and much less likely for shorter periods.
(#Time series (hadcrut3) from 1850 to 2011.92
#Selected data from 1995
#Least squares trend line; slope = 0.0084082 per year)
Consider 0.84 per century now, as was the case for Hadcrut3 over the last 17 years. Without being concerned about the 95% level for the moment, we would not reach the 2 C mark until well into the next century. So unless this rate makes a very quick upward spike, my grandchildren and James Hansen’s grandchildren should be just fine, even if we do nothing about CO2.
Smokey says:
Prof Richard Lindzen:
For small changes in climate associated with tenths of a degree, there is no need for any external cause. The earth is never exactly in equilibrium. The motions of the massive oceans where heat is moved between deep layers and the surface provides variability on time scales from years to centuries. Recent work suggests that this variability is enough to account for all climate change since the 19th Century.
What “recent work?” Who did it? Where is it published? In fact, measurements show that the oceans are *gaining* heat, not losing it: http://www.nodc.noaa.gov/OC5/3M_HEAT_CONTENT/
We are not talking about a “tenths of a degree,” but about 1 C surface warming since 1950 (BEST) and 11e22 J ocean heating since 1980. That’s a huge amount of heat — over a week’s worth of all the solar energy incident on top of the atmosphere, and about 5 week’s worth of all that’s received at the surface.
Where did this 5 week’s worth of extra energy come from?
—
I see nothing in your link that “debunks” BEST. Nothing — unless you live in an alternate scientific reality where a decade’s worth of flat surface temperatures says something about climate change.
This was in reply to Mosher’s post with the candle-CO2 vid. Satellite obs have recorded the change of radiance in precisely the spectra we expect as CO2 accumulates in the atmosphere. To borrow Mosher’s terminology, we have been watching the ‘transmission windows’ close via satellite.
In theory the lower stratosphere should cool over the long term with more GHGs in the troposphere. That has also been verified by satellite obs.
There are abundant lines of evidence that point to CO2 having an effect – not just tropospheric and surface temperature. And, of course, the understanding of the ‘greenhouse’ effect was a property of physics long before we had satellite instruments to measure and verify it.
The glass tube filling with CO2 is sealed. The candle is outside the glass tube. If your computer monitor is any good, you can see the outline of the flame still burning at the same height, but far less brightly due to the radiance being absorbed by CO2.
Someone else replied that CO2 out of a gas bottle is cold, and that the change of temp in the glass tube from the cold gas would interfere with the flame. There are a bunch of tests on youtube where they apply thermometric instruments to the volume filling with CO2 gas, and the temperature goes up.
This is empirical physics. CO2 absorbs radiation. Period. Denying this fact puts you outside any intelligent discussion of the general topic. The skeptic cause is not helped by incurious adherents denying anything and everything about the physics behind the ‘greenhouse’ effect. As a result of this, what ‘warmists’ and fence-sitters see is a motley crew of contradictory opinions and a bunch of ignorance. This will not persuade. (But maybe that isn’t the point here)
Werner,
Jones said, a few months ago, that there was now enough data that the linear trend from 1995 is statistically significant. I think that will still be the case even with the added variation of 2011.
http://www.bbc.co.uk/news/science-environment-13719510
barry says:
January 22, 2012 at 5:28 pm
“In theory the lower stratosphere should cool over the long term with more GHGs in the troposphere. That has also been verified by satellite obs”.
Care to share your source of this information with us? Your statement contradicts all temperature measurements of the stratosphere that I have seen for the past 15 years.
Camburn,
15 years is not long term in climatology. In surface temp data that’s not even a long enough time period to get linear trends with statistical significance. The cooling over the last 30 years (long term) is apparent in UAH and RSS data.
RSS graphic
RSS data – http://www.remss.com/data/msu/monthly_time_series/RSS_Monthly_MSU_AMSU_Channel_TLS_Anomalies_Land_and_Ocean_v03_3.txt
UAH data – http://www.nsstc.uah.edu/public/msu/t4/uahncdc.ls
The decadal trend for the last 30 years is:
-0.3C for RSS
-0.38C for UAH
Do you have some different data?
(BTW, I ran a linear regression – just out of curiosity – for the 15 years Jan 1997 to Dec 2011 and got a result of -0.06C/decade for UAH, and -0.07C/decade for RSS. But it’s not significant in any sense of the word, and the slope can change sign just by shifting the end points a few months. IOW, 15 years of data is too susceptible to the variability to discern a signal. You need more data. Guessing from the amount of variance, I’d say 20 years would be a good minimum for detecting trends in lower stratosphere data, but someone with better stat skillz than me will have to verify that.)
barry says:
January 22, 2012 at 6:24 pm
From http://www.bbc.co.uk/news/science-environment-13719510
the following appears:
“HadCRUT shows a warming 1995-2010 of 0.19C”
However let us compare apples with apples.
#Selected data up to 2010
#Least squares trend line; slope = 0.010666 per year
#Selected data up to 2011
#Least squares trend line; slope = 0.0108234 per year
#Selected data up to 2012
#Least squares trend line; slope = 0.0084082 per year)
There was a slight increase in slope from 2010 to 2011, but a big drop during this past year. So if the slope of 0.010666 per year was NOT significant according to Phil Jones criteria two years ago, I see no way that the lower value of 0.0084082 per year can be significant two years later. Unless I am totally misreading things, the latest number is much less significant than the value two years ago.
Erinome says:
January 22, 2012 at 11:54 am
Smokey: Of course — OF COURSE — it is necessary to give a cause for global warming. That’s bleeding obvious. GW isn’t a fundamental force; the Earth is a system that responds to fundamental forces. A change in temperature requires a flow of energy/heat. What is that flow from???
But Smokey gave you the cause, coming out of the Little Ice Age accounts for all the warming.
Werner, unless I’m misreading your comments you seem to be confused about the meaning of the term ‘statistical significance’. Significance in this respect has nothing to do with the magnitude of the slope or the importance of it’s value, but with the likelihood that there is an actual trend.
People have long confused ‘significant’ as in ‘meaningful’ or ‘important’ with its meaning in terms of statistical function, which is quite different. The wiki page lays it out.
http://en.wikipedia.org/wiki/Statistical_significance
Are you suggesting that there is a ‘normal’ temperature that the Earth gravitates towards?
‘Recovery from little ice age’ in no way describes a physical mechanism/s responsible for changing the Earth’s temperature. It’s vacuous. Like saying the reason the Earth is warmer than before is that it was cooler back then.
Barry,
“Recovery from the LIA” is not a phrase that I would use. Rather, “emerging from the LIA”
The world is always emerging from some climate state. The LIA was an emergence from some climate regime that preceded it. Before that, the world was emerging from the MWP. In my years of studying GCCs, I doubt they have a good handle on explaining the emergence from the LIA, and they certainly do not have a handle on the emergence into the LIA. (I can elaborate on that assessment if you wish.)
Unless I see tremendous progress some place, I would say it would be an indication of excessive hubris to say that we can confidently detail the “physical mechanism/s responsible for changing the Earth’s temperature.” There are too many variables with too poorly understood relationships. (This conclusion means that those who are predicting a decade of significant cooling are just as reckless as those predicting a huge warming trend.)
Erinome says:
“What ‘recent work?’ Who did it? Where is it published?”
Lindzen was referring to Tsonis, 2007. Unlike you, he would know.
Next, Erinome says:
“We are not talking about a “tenths of a degree,”…”
Wrong. The planet has warmed ≈0.8°C in the past ≈150 years. .8 = 8/10ths.
And Erinome says:
“I see nothing in your link that “debunks” BEST.”
Time to visit an optometrist, then: click [More here] See?
• • •
barry:
You don’t know the physical mechanism that is causing the planet to emerge from the LIA. We just know that it is. And CO2 is an extremely unlikely cause. It is a classic argumentum ad ignorantium fallacy to assign blame to one insignificant entity: “Since we can’t think of any other cause, then it must be due to CO2. And besides, they pay us grant money to blame carbon!”
Just because all the causes aren’t figured out yet, it doesn’t mean the planet is not warming along the same trend line since the LIA. Well, until recently, that is…
“”””” the cloud also intercepts an ever diminishing part of the surface IR THAT ACTUALLY HITS THE CLOUD
That would be true if the ground radiation was from a point source. But as the whole surface emits IR, it hardly matters, as the cloud receives IR from every part of the surface up to the horizon. Only the increase in total area between ground level and some 10 km height plays a very small role (0.2%)… “””””
“”””” That would be true if the ground radiation was from a point source. “””””
I beg to differ, it doesn’t have anything to do with the “source” of the surface emission. The simple fact is that as the cloud height increases, the molecular (H2O) density of the cloud diminishes, so the amount of surface LWIR FROM ANYWHERE ON THE SURFACE that “actually hits the cloud”, is diminished since the absorption is a per molecule phenomenon. Of course for the same reason, the amount of sunlight absorbed or reflected from the cloud also diminishes; but the geometrical shadow of the cloud formed by the sun is essentially independent of the cloud height, since the sun, IS a near point source, and the range of cloud heights is totally negligible compare to the distance to the sun.
But the surface LWIR capture and re-emission (NOT REFLECTION) of the cloud is affected by the inverse square law for cloud height. And the cloud re-emission of LWIR is isotropic, so half of it escapes to space, and only half of it propagates downward, where it undergoes another inverse square law dispersion, arriving at the surface spread over a vsastly increased are from that which first emitted it.
And if you insist on bringing in the emission from other surface areas not directly below the cloud; be my guest; and then say hello to a cosine^8th further attenuation due to the angle of obliquity from the zenith. So cloud height and obliquity effect is h^-4.Cos^8 (angle) No matter how you skin it, the cloud return of surface emitted LWIR diminishes catastrophically with increase in cloud height, and obliquity. It’s trivial geometrical optics; which incidently is how I make my living.
An Inquirer,
I’ve used “emerging” and “recovery” interchangably. On reading your post, I have to agree with you that the correct term is “emerging”. Thanks for making the distinction clear.
“”””” Ferdinand Engelbeen says:
January 21, 2012 at 2:37 am
George E. Smith; says:
January 20, 2012 at 8:02 pm
Net result is that clouds (ANY CLOUDS) always reduce ground level sunlight, and always reduce it more than they do the surface emitted IR; and ther higher the clouds, the less of both gets absorbed or reflected.
It is more complicated than that… “””””
No, other things may be more complicated than that; BUT the fact remains that every single molecule of H2O or O3, or CO2 that is introduced into the atmosphere (extra) must reduce the ground level insolation, since ALL THREE of those molecular species absorb some part of the solar spectrum in the region where it contains most of its energy; that is between 0.25 and 4.0 microns wavelength which is 98% of the solar energy spectrum.
That solar spectrum energy is PERMANENTLY LOST to the surface (where it will be largely stored) but it heats the atmosphere, which in turn will radiate it in an isotropic LWIR spectrum, only half of which can reach the ground, as LWIR, not as solar spectrum radiation. Unlike much of the soalr spectrum radiation whcih penetrates deep into the oceans, the LWIR goes a few microns into anything it hits, and in the case of the oceans largely promotes increased surface evaporation; not deep ocean storage.
So there is a permanent irretrievable loss of about half of the incoming solar energy, that is captured by atmospheric gases of all kinds, just as the Raleigh scattering of the blue light permanently removes about half of that scattered incoming energy.
No matter how you slice it, less surface solar energy leads to cooling; the rest is just a redistribution of that energy. Besides that it is the surface warmth that causes the high clouds; not the reverse.
“barry says:
January 23, 2012 at 3:44 pm
Significance in this respect has NOTHING to do with the magnitude of the slope or the importance of it’s value, but with the likelihood that there is an actual trend.” (emphasis mine)
But if the HadCrut3 slope for the last 17 years had been 0.001 degree/ century, there is no way you could say with 95% confidence that warming is occurring. So I could also say: “the likelihood that there is an actual trend” has MUCH “to do with the magnitude of the slope”.
Let us see if Phil Jones brings up this point again.
Werner,
That is so, but the result is still a property of statistics. In this case, the confidence interval would be greater than the trend, and so would not be statistically significant. OTOH, if each real data point fell on or very close to the trend line, then it would be possible to achieve statistical significance for a 0.01/C/decade trend over 17 years. Neither of our ‘what ifs’ matches the reality, of course.
F significance and p-test in Excel recommend that the linear regression trend Jan 1995 to November 2011 is statistically significant (less than 5% chance the trend is a statistical fluke), but I’m not an expert in statistics and would hesitate to say anything categorically without further testing, for which I lack the skill.
But the point remains – Phil Jones was using the term in its statistical sense. When he said a few years ago that the trend from 1995 was not statistically significant, he was absolutely not talking about its magnitude. Do you understand that? Did the wikipedia page defining statistical significance clarify the issue?
An Enquirer,
‘Emergence’, ‘recovery’ – it’s just different flavours of waffle. The rhetoric is empty of explanatory power. There’s plenty more like it, too, but it’s not the physical explanation that many seem to think it is.
I am amazed that people in this day and age can so casually dismiss the explanatory power of the effect of increasing atmospheric CO2 on planetary temperature. When Lindzen, Spencer, Christy, Pielke’s Snr and Jnr, Bob Tisdale and most of the skeptical bloggers – including Anthony Watts – accept the physics, the holdouts must truly have a problem. One can argue about the magnitude of the effect, as some of the above do, but one can no longer discount it and remain a sensible contributor to the discussion.
I have also previously stated that natural global cooling will soon recur. I wrote in 2003 that cooling would start by 2020 to 2030. This was based in part on NASA’s now-obsolete prediction that SC 24 would be strong but SC 25 would be weak. SC24 now appears to be weak, so cooling could happen sooner.
I have also stated many times that global cooling is a much greater threat to humanity and the environment than global warming. The threat to food production of even modest global cooling is significant. Do we even store significant reserves of grain anymore? Global cooling is what our foolish governments should be worried about – not small fractions of a degree of natural global warming.
barry says:
January 23, 2012 at 10:16 pm
An Enquirer,
‘Emergence’, ‘recovery’ – it’s just different flavours of waffle. The rhetoric is empty of explanatory power. There’s plenty more like it, too, but it’s not the physical explanation that many seem to think it is.
I am amazed that people in this day and age can so casually dismiss the explanatory power of the effect of increasing atmospheric CO2 on planetary temperature. When Lindzen, Spencer, Christy, Pielke’s Snr and Jnr, Bob Tisdale and most of the skeptical bloggers – including Anthony Watts – accept the physics, the holdouts must truly have a problem. One can argue about the magnitude of the effect, as some of the above do, but one can no longer discount it and remain a sensible contributor to the discussion.
____________________
Here is the problem Barry: CO2 LAGS temperature at all measured time scales. So your cause is lagging your effect. This is the 64-ton elephant in the room, that nobody wants to talk about.
I may be wrong about this, but I doubt it.