By Joe Bastardi, Weatherbell Analytics
When the PDO turned cold, most of the meteorological and climate community understood that the pattern was turning very similar the last time of the PDO reversal, the 1950s, and it was a matter of time before the global temperatures, which have leveled off, would start falling in the same herby jerky fashion they had risen when the PDO turned warm at the end of the 1970s. I am not going to rehash the sordid details of how the AGW crowd simply ignores the major drivers of a cyclical nature. We all know that. Nor am I going to question them as to why they believe a trace gas like CO2 (needed for life on the planet) with a specific gravity of 1.5 as compared to the atmospheres 1.0, was going to mix with air in a way to affect the earth’s temperatures. Instead I am going to drive home points I have been making since 2007 and are now dramatically validating.
The La Ninas of 2008-09 and now this one had rapid mid level temperature drops that followed their onset and this years was nothing short of the most dramatic mid tropospheric drop since the start of the millennium. It is much more plausible to believe that rapid cooling in the mid levels would have an effect at leading to extremes, rather than what the warmingistas claim, which of course is anything that happens. In any case, one very interesting level that cooled to record cold levels was 400 mb, the very levels that the so called trapping hot spots were going to show up because of CO2…again a neat trick since somehow CO2 was going to defy the laws of Gravity, since, as mentioned above, its specific gravity is higher than the atmosphere (of course even if it was, it a) has not been proven to cause warming and b) man’s contribution is so tiny as to render it a non item anyway in climate considerations.
However first came the flip in the PDO, seen nicely here on the Multivariate Enso Index chart, which clearly illustrates the colder Pacific when the earth was colder, the start of the warming period coinciding with the satellite era, and now.

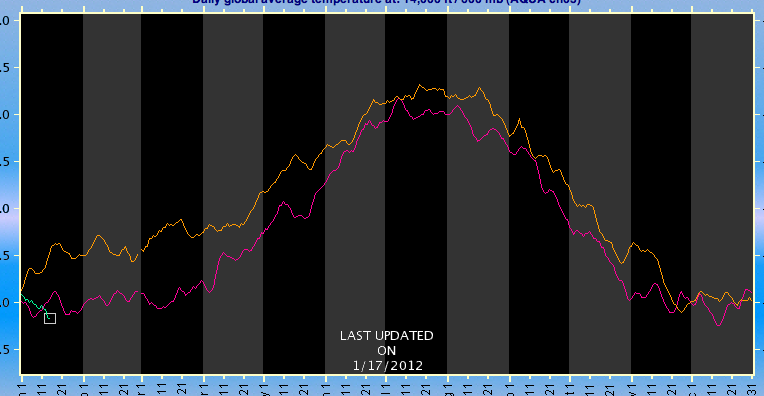
Now from the AMSU site, the amazing one year drop in temperature, the orange tan line being after the El Nino of 2009/10, the purplish line this past year and one can see the green this year, we are near record cold levels again.

600 mb (14,000 feet) (enlarged)
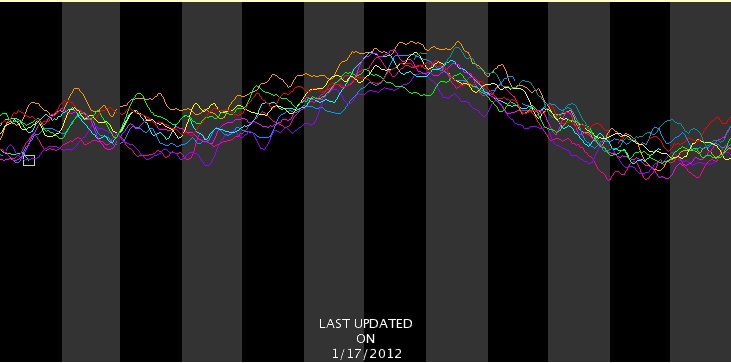
And oh my my, the trapping hot spot itself.. 400mb or 25,000 feet… coldest in the entore decade

But the 2 meter temperatures, being in the boundary layer, do not respond as fast as the ocean, or a transparent atmosphere above
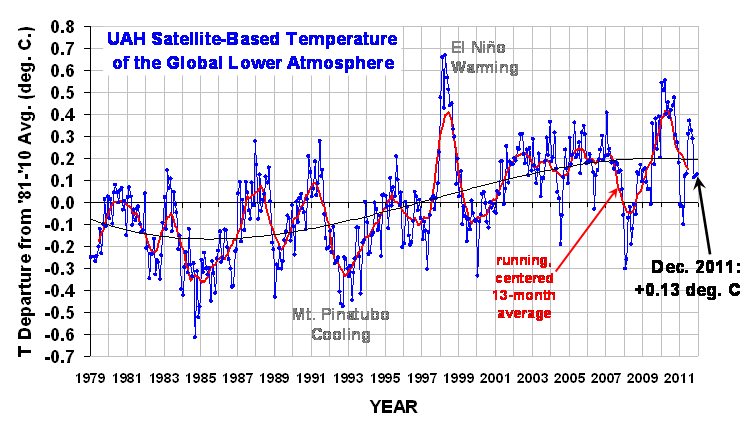
Nevertheless three downturns in a jagged fashion started predictably after the last El Nino now falling again in fits and spurts through December.
From Dr Roy Spencer’s site:

(enlarged)
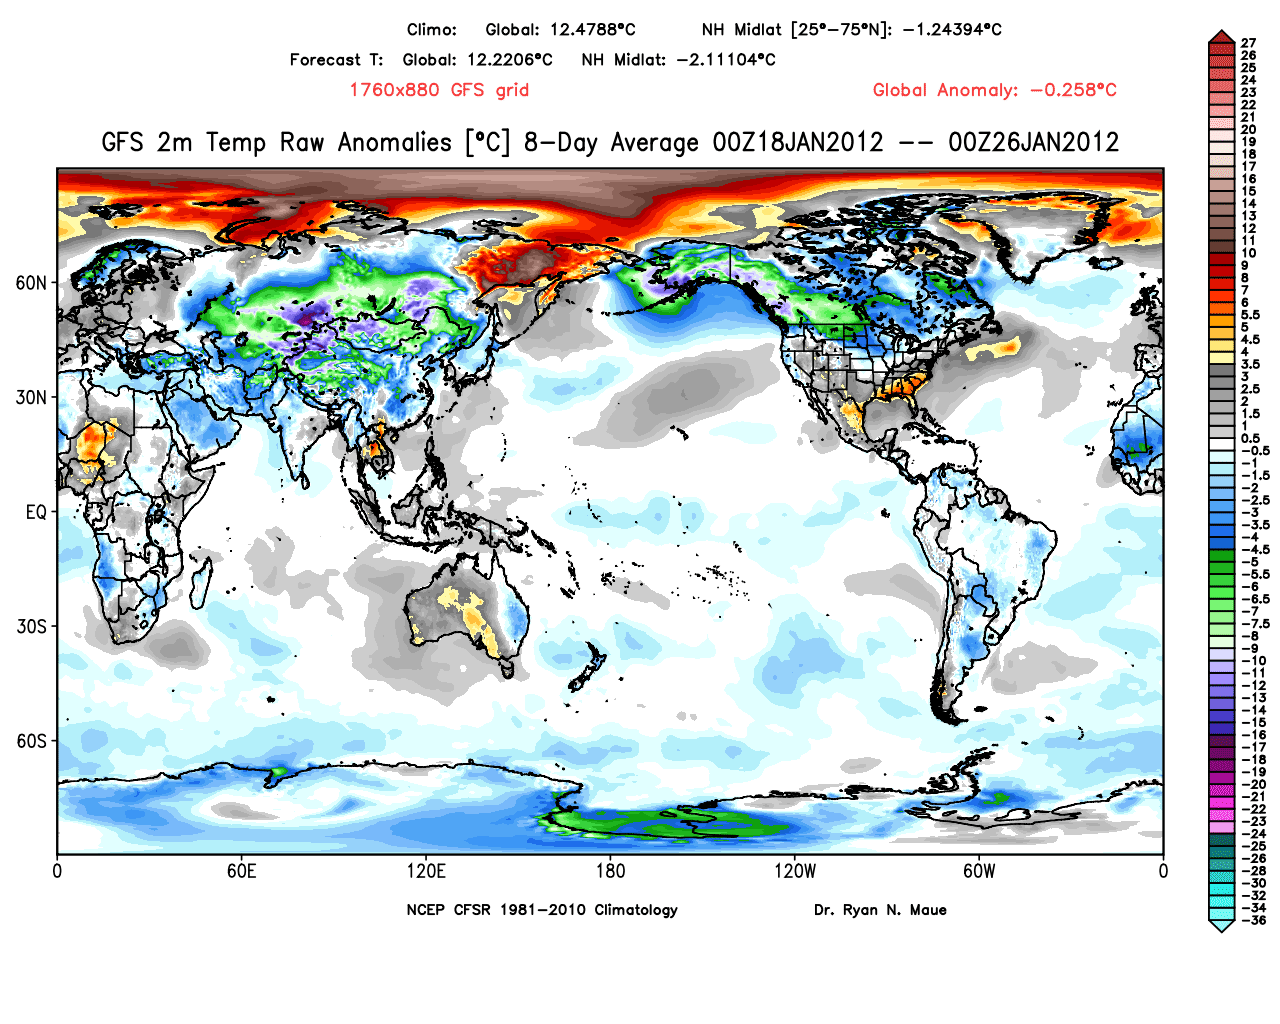
In May, I forecasted the global temperatures to fall to -0.15C in one of the months – Jan, Feb or Mar this year, and perhaps as low as levels we saw in the 2008 La Nina. A rapid free fall has begun. Dr. Ryan Maue at his site (http://policlimate.com/weather/) maintains a plethora of useful forecast information including GFS global temp projections over the next 16 days.
They have been routinely reading greater than 0.2 C below normal and I suspect the Jan reading will plummet quite a bit from December with February even lower. An example of this can be seen with these two charts off Ryan’s site,

-0.258 C globally for 2 meters. (enlarged)

Day 8.5-16 a whopping -0.352 C (enlarged)
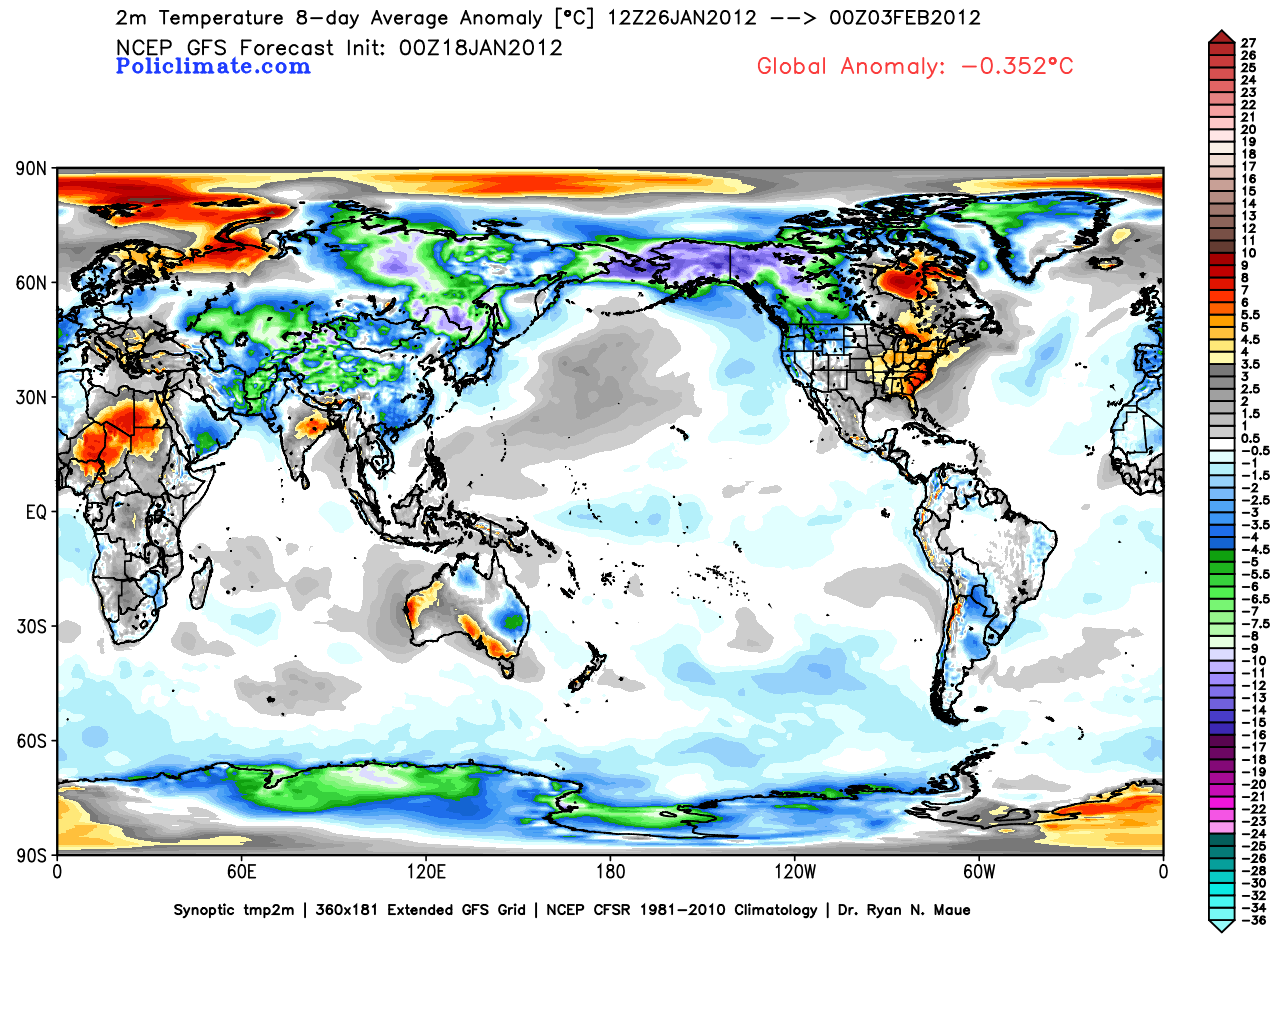
The reason the arctic looks warm is that it has been stormy, and when it’s windy the air is well mixed and so the temperatures are not as low as if it’s calm, but it’s still frigid. Notice in the second map, that the arctic cools because the arctic oscillation is starting to go negative, leading to higher pressures and lighter winds. But the most astounding aspect of this is the northern hemisphere mid latitude temperatures, at -2.1 C.
Currently, with gas so high because we are being handcuffed by an administration that won’t drill (if gas was a 1.50 lower, it would be worth a half trillion dollars to the economy) and an EPA that is causing untold economic damage (I would conservatively etiolate a half trillion dollars, from jobs lost to burdensome regulations) along with a 100 billion dollar subsidy to fight global warming world wide, it is costing each ACTUAL TAX PAYER close to 7000 dollars (1.1 trillion divided by 150 million tax payers).
One has to wonder, how even the most dogmatic of them don’t look at the actual facts, how they can continue to carry on their denial while the results of such things handcuff the American economy and cause untold misery for many as our wealth is not only redistributed, but dwindles. One can only conclude this is being done on purpose, and with purpose.
See PDF with enlarged images.
UPDATE: Bob Tisdale disagrees with portions of this analysis and has an essay here.
Erinome says:
January 21, 2012 at 11:21 am
An Inquirer says:
It is hard for me to believe that a reasonable person could look at a chart of lower stratospheric temperatures over the satellite record: http://img232.imageshack.us/img232/29/lowerstratospheretemps.png , and not observe that the decrease is clustered around major low-latitude volcanic eruptions, and since the last eruption, the lower stratospheric temperatures have been mostly flat.
It has not been flat over the last 15 years. The linear trend of the UAH LS in that time period is -0.067 +/- 0.025 C/decade
Source please?
What you are indicating does not agree with this paper:
“However, due to increasing CO2, the CCMs simulate a continuous linear cooling by 1~K per decade over the entire 1979 to 2010 period. This is not consistent with the near-constant temperatures observed since the late 1980s.”
Abstract:
Ozone and Temperature Trends in the Upper Statosphere at Five Stations
American Geophysical Union, Fall Meeting 2008.
Bob Tisdale says:
January 21, 2012 at 1:58 pm
This is another falsehood on your part. The PDO is only calculated using the Sea Surface Temperatures of the North Pacific. Read the first paragraph in the description on the JISAO webpage that describes how the PDO is calculated. There’s no mention that it “incorporated the NPI”:
Another weak attempt to confuse. The PDO incorporates SLP vaules of the northern Pacific. The NPI is constructed from the same values. But your long winded response is basically acknowledging the PDO IS driven by other factors outside of ENSO. But I suspect you will still claim that “the PDO is an after effect of ENSO” and can have no effect of global temperatures.
The discussion of Rossby waves was written clearly in the Foster and Rahmstof post. There is no need for me to amend it. You apparently did not understand the plain language in which it was written. Everyone else seemed to.
I have pointed out that your writing is ambiguous in the later comments of the Foster and Rahmstof post . I notice from the Foster and Rahmstof post R. Gates seems confused and assumes the Rossby wave to be consistent throughout El Nino events.
http://wattsupwiththat.com/2012/01/14/tisdale-on-foster-and-rahmstorf-take-2/#comment-865029
Gates says;
your insights regarding the oceanicRossby waves carrying extra surface heat unspent during a formal El Nino back toward the western Pacific is very insightful, and the fact that this occurs outside of the formally measured El Nino period, means, as you’ve pointed ouit, that it would not be accounted for in filtering process used by Foster & Rahmstorf. This residual El Nino heat certainly shows up in the linear rise they’ve found and are attributing to the anthropogenic signal.
As a guest WUWT poster and writer of your own blog you have a duty to make your representation of facts clear and concise. If you refuse to do so shows you are protecting either your ego or an agenda.
I will continue to point out your misrepresentations.
Erinome says:
January 21, 2012 at 11:21 am
An Inquirer says:
It is hard for me to believe that a reasonable person could look at a chart of lower stratospheric temperatures over the satellite record: http://img232.imageshack.us/img232/29/lowerstratospheretemps.png , and not observe that the decrease is clustered around major low-latitude volcanic eruptions, and since the last eruption, the lower stratospheric temperatures have been mostly flat.
It has not been flat over the last 15 years. The linear trend of the UAH LS in that time period is -0.067 +/- 0.025 C/decade.
——————————-
Erinome, you are data selecting.
Daily stratosphere temperatures for the global, SH, NH and Tropics. It is the volcanoes (which cause a short-term spike in temperatures as the aerosols absorb solar radiation and then produce a cooling of about 0.5C through Ozone destruction from the sulfate aerosols – and Ozone also intercepts solar radiation in the stratosphere – so breif warming spike, the 0.5C of cooling until the Ozone rebuilds which is seems to be doing, it can take 25 years for this to happen apparently).
The Tropics, for example, have recently hit highs not seen since Pinatubo.
http://img818.imageshack.us/img818/6673/uahdailylstemps.png
The volcanic impact can be seen in the stratosphere temps back to 1958.
http://www.metoffice.gov.uk/hadobs/hadat/images/update_images/global_upper_air.png
Erinome–you consider that paper proof? LOLOLOLOL
Geoff Sharp says: “I will continue to point out your misrepresentations.”
Please continue to try to do so, because the examples you give, such as R. Gates comment that you quoted, actually support my post. The fact that you cannot see that is not surprising.
And your continued misrepresentation of the components of the PDO is also blatantly obvious to all who are following this thread. You are not the spin doctor you believe you are and the readers here are much more intelligent than you believe. If you wish, feel free to continue to look foolish in the eyes of those who are reading your comments. You have no credibility, so you can’t lose any more of it.
Ciao
Today’s UAH temps (which are preliminary and need to be processed yet for the official number) are ….
-0.9C below the same day in the El Nino influenced year of 2010.
The ENSO’s 3 month lag is kicking in. The lowest temps will not be until February or April (depending on what the La Nina does this January – it looks like it will be as low as November when it got a minor La Nina level of -1.04C).
Erinome—dude–you need to take some remedial classes in science and math and learn what proof means!
I agree with Bob that the PDO is just a poor measure. We need to develop something else which is more indicative of the ENSO’s longer lasting effects or of the north Pacific’s oscillations. The problem is parts of the north Pacific will be very warm and other parts will be very cold.
As Just The Facts article notes, the ENSO region’s ocean currents are redirected to the north Pacific as a result of the rotation of the Earth and the shape of the land at its end-point. The north Pacific patterns can reflect the temperatures produced by the ENSO over the last two or three events (which can be either La Nina or El Nino).
http://www7320.nrlssc.navy.mil/global_nlom32/navo/WHOSP1_nlomw12930doper.gif
“Actually Thoughtful says:
January 21, 2012 at 12:56 pm
Werner Brozek – you invoke Phil Jones and your partial quote (changing his intent). So, what does Phil Jones say now?”
Note that I did give the full URL so anyone could see the whole quote if they wished. I quoted the part that I wished to comment on and it was not my intention to be misleading. But as for “what does Phil Jones say now?” Around May of 2011, he said the warming to the end of 2010 “was significant” for 16 years at the 95% level. However as soon as he said it, it was almost out of date since the cool 2011 temperatures made it not significant again. I will prove this two different ways for you. In 2009, the anomaly was 0.443. This WAS NOT significant. In 2010, it was 0.478. This WAS significant. So far in 2011, it is 0.347 to the end of November. (GISS dropped from 0.48 to 0.45 between November and December, so I believe I am quite safe in assuming that the 0.347 will certainly not rise by much, if anything, once the December HadCrut3 numbers are out.) So if we average 0.347 and 0.478, we get 0.413. Since this is much less than the 2009 value of 0.443, we could say that we now have 17 years of warming that is NOT significant at the 95% level.
Now for the second way: See the graphics at:
http://hadobs.metoffice.com/hadcrut3/diagnostics/global/nh+sh/
Focus on the top 95% error bar for 1995 and note that it is way above the bottom error bar for the presently green 2011 line. It is so much higher that the green line cannot catch up any more for the remainder of the year.
Now what would Phil Jones say if he were asked #3 today:
“C – Do you agree that from January 2002 to the present there has been statistically significant global cooling?
No. This period is even shorter than 1995-2009. The trend this time is negative (-0.09C per decade), but this trend is not statistically significant.” Do you agree?
#Selected data from 2002
#Least squares trend line; slope = -0.00936354 per year
See:
http://www.woodfortrees.org/plot/hadcrut3gl/from:1997/plot/hadcrut3gl/from:2002/trend
“As for your tortured analysis of 1910-1940 vs 1970-2010”
What “tortured analysis”? I just quoted Phil Jones.
“If you want to appeal to the authority of Phil Jones and his >decade of study to become a climate scientists, and his decades of work to become an expert in climate science – it is incumbent upon you to accept his whole body of work in this area.”
Exactly what should I be looking at, what he admitted in private or what he said in public? My context for this statement is:
Phil Jones, July 5, 2005:
“The scientific community would come down on me in no uncertain terms if I said the world had cooled from 1998. Okay it has but it is only seven years of data and it isn’t statistically significant.”
Camburn says:
“It has not been flat over the last 15 years. The linear trend of the UAH LS in that time period is -0.067 +/- 0.025 C/decade”
Source please?
I am the source — I calculated it myself from the UAH LS data, here:
http://vortex.nsstc.uah.edu/data/msu/t4/uahncdc.ls
It’s important to note that the uncertainty of the slope I gave above is the 1-sigma value; if you use a 95% confidence interval the linear trend of the last 15 years is -0.067 +/- 0.050 C/decade, so the cooling is statistically significant even at that level. If you find different values let me know.
What you are indicating does not agree with this paper:
“However, due to increasing CO2, the CCMs simulate a continuous linear cooling by 1~K per decade over the entire 1979 to 2010 period. This is not consistent with the near-constant temperatures observed since the late 1980s.”
What can I say — I find a different value from the data. What value do you find? From Jan 1990 to Dec 2012 the UAH LS linear trend is -0.36 +/- 0.06 C/decade (95% C.L.), R^2=0.31. The Pinatubo eruption obviously skews the results, but since it occurred early in the 1990-2011 interval this large slope is certainly believable.
Bill Illis says:
Erinome, you are data selecting.
I am not — someone else picked the 15-year time interval, not me. Download the data and do the calculations for yourself; let me know if you find a different result.
Smokey says:
“Why drill for more oil if the US is now a net exporter of petroleum?”
Answer: an increased supply will result in lower cost. In this economy that is a Good Thing.
Oil drilled in the US is sold on the world market. (Otherwise it would be a nationalization of the resource, i.e. socialism.) That market is about 87 Mb/d, of which the US supplies about 10 Mb/d. 15 years ago the world market was about 70 Mb/d, and the US supplied about 9.0-9.5 Mb/d. (My source is the EIA.)
How much more could the US drill, and for how long? Let’s say we could somehow, someway drill 15 Mb/d. That 5 Mb/d increase is not much on the world market, especially with China growing the way it is. So that increase is not going to do much for oil prices.
What that oil WOULD do, though, is provide a safety reserve for US when world production tops out. Because in that world we WILL nationalize the resource, and Canada will nationalize theirs (and perhaps sell most of it to us, though there will be big arguments about it).
So whatever oil we do have in difficult places like offshore (and it’s almost certainly not 5 Mb/d) is much more valuable to us as a reserve than as a way to reduce gas prices by 50 cents/gal. Our economic problems will not be solved if gas were suddenly $2.90/gal instead of $3.50/gal. In fact, gas was at that level in Dec 2010 and we still had big problems.
The cost of energy is factored into almost everything. Artificially limiting its supply causes the cost of everything to rise, and that hurts the poor the most. But of course, that is the point, isn’t it?
Stop being paranoid; it’s not a very useful quality.
Werner Brozek says:
we could say that we now have 17 years of warming that is NOT significant at the 95% level.
That’s not true. The linear trend for the HadCRUT3 data from Dec 1994 is +0.090 +/- 0.033 C/decade (the uncertainty represents the 95% confidence level, R^2=0.15).
You know, it’s really not that difficult to download their data and do these calculations for yourself….
Bob B says:
Erinome–you consider that paper proof? LOLOLOLOL
What problems, in particular, did you find with their methodology?
Erinome—dude–you need to take some remedial classes in science and math and learn what proof means!
I know full well what a proof is, and I strongly suspect I’ve taken many more science and math classes than you have.
Smokey says:
“Why drill for more oil if the US is now a net exporter of petroleum?”
Answer: an increased supply will result in lower cost. In this economy that is a Good Thing.
You seem to only be taking one factor into account — there are other values in life besides cheap fuel. By and large Americans have decided (at the voting booth if nowhere else) that, at today’s prices and level of supply, they do not want to risk valuable fishing grounds, beaches, coastlines and viewsheds putting oil platforms everywhere. Especially after the BP spill, and especially when they see the massive profits oil companies are already making. Exxon-Mobil made $10.3 billion in profits last quarter, and that was up 41% from a year earlier. Why? Higher prices. Oil companies LIKE prices where they’re at. (So does Canada, with its oil sands.)
Bill Illis says:
The Tropics, for example, have recently hit highs not seen since Pinatubo.
http://img818.imageshack.us/img818/6673/uahdailylstemps.png
Bill, I suspect that’s related to the very strong La Nina we had in 2010. I’ve read that during La Nina episodes the Earth tends to gain energy, but I don’t really understand why, or, if so, why it means the LT is cooler. Does anyone here know?
Smokey says:
The current warming is a continuation of the planet’s natural emergence from the LIA. CO2 has had no measurable effect. And despite your statement, that warming has not accelerated. The long term trend line remains unbroken.
Wait a minute.
1. Warming does not occur without a cause. What is the cause, if not GHGs?
2. I thought you, like many here, dispute the accuracy of the surface station record. But now you’re using it to argue for long-term warming over 160 years. So do you accept the data or don’t you?
Actually Thoughtful: I have no home solar or wind — all my electricity comes from my wall outlets, thanks to copious hydro power. And yes, I am a firm believer in the Jevons Effect.
http://dollarcollapse.com/
Anthony.
I realise your time is precious but on this site there is an interview that should be listened to. About 16:40 into Max’s rant. Ties in with what we know about the BP and Goldman influence on the AGW scam Very interesting .
regards
Erinome,
You’re arguing with everyone here, a sure sign of cognitive dissonance; Orwell’s “doublethink”. So, everyone else is out of step but you?? As if. What would your crazy alarmist pals think of you arguing with the consensus?
Explain where Americans were given the choice to vote for cheap fuel. The fact is, we weren’t. And the rest of your rubbish is emotion-based nonsense. Oil wells do not risk fishing grounds, beaches, ‘viewsheds’, etc. It is rare to be able to even see a drilling platform from shore. The vast majority of Americans have never seen one outside of pictures.
And show us current evidence of damage from the BP oil spill. There is hardly a remaining trace of that blowout, massive as it was. It’s gone now, except in your fevered imagination.
And your green-eyed envy is so thick it could be cut with a knife. How does it feel to be so consumed with greed over the fact that a company is producing something of value that consumers willingly purchase? No one makes people buy gasoline or heating oil, they want to buy it. Who are you to tell them they can’t, chump? Instead of being so disgustingly envious of others, just buy shares in Exxon-Mobil and you, too, can get a good return on your money. That would certainly be a better choice than your thumb-sucking tantrum over the fact that companies are making money legally and ethically by providing what the market [including you] wants.
Aside from believing that everyone else here is wrong, you exhibit extreme hypocrisy by using fossil fuel products yourself while badmouthing their producers. I’ll change my opinion when you’ve convinced me you live in a mud hut and don’t use any modern conveniences like gasoline, fossil fuel heat, or anything made of plastic, or eat food grown with fossil fuel-based fertilizer. I mean, really, could you possibly be any more of a finger-wagging hypocrite?
Finally, there is no requirement to give a “cause” for natural warming. There has been no “cause” proven for gravity; the Higgs boson remains an undescovered particle. It may not even exist. But the fact remains that the planet’s temperature trend is rising along the same gradually rising slope since the LIA – which shows convincingly that CO2 is at best an insignificant player. And despite your erroneous assumption, I have never disputed the longest-running temperature record in the world, because it has been recorded on the same instrument location. That record shows conclusively that there is no acceleration of rising temperatures since CO2 began it’s current rise. The long-term trend line remains unbroken. So much for your debunked CAGW conjecture. Like your other arguments, it is based on wishful thinking.
“Erinome says:
January 21, 2012 at 7:41 pm
Werner Brozek says:
we could say that we now have 17 years of warming that is NOT significant at the 95% level.
That’s not true. The linear trend for the HadCRUT3 data from Dec 1994 is +0.090 +/- 0.033 C/decade (the uncertainty represents the 95% confidence level, R^2=0.15).
You know, it’s really not that difficult to download their data and do these calculations for yourself….”
Could you please answer this question for me: Was Phil Jones correct with his answer to question B (in February 13, 2010) at:
http://news.bbc.co.uk/2/hi/science/nature/8511670.stm
B – Do you agree that from 1995 to the present there has been no statistically-significant global warming
Yes, but only just. I also calculated the trend for the period 1995 to 2009. This trend (0.12C per decade) is positive, but not significant at the 95% significance level. The positive trend is quite close to the significance level. Achieving statistical significance in scientific terms is much more likely for longer periods, and much less likely for shorter periods.
Ammonite says:
January 19, 2012 at 3:52 pm
“Big picture. Both the instrumental and thermometer records show a rise of ~0.16C/decade since satellite records began. The troposphere is warming, the stratosphere cooling, night-time temperatures are rising faster than day-time temperatures – all signatures of warming due to rising GHG concentration. Satellite measurement of heat escaping in the CO2 absorption bands show decline consistent with theory. In short, AGW is directly supported by measurement.”
These measurements show most but not all of the signs of AGW. For one thing, the amount of AGW shown by these is less than modeled. Also, the models predicting AGW to be a problem are predicting “to the level of a warming hotspot” upper tropospheric warming over the tropics, which hardly exists even now.
I agree that AGW is for real. But how much is there? For one thing, almost half of the upswing in HadCRUT3 from the early/mid 1970’s to 2004-2005 was from a periodic item that has been there since before the ~1877-1878 warm years.
Erinome,
You need to learn what proof is. The is no PROOF the magnitude of the recent tiny tiny blip of warming is nothing more then climate noise. Any 5th grader can look at the below slide show and see the recent tiny tiny blip of warming is noise.
http://wattsupwiththat.files.wordpress.com/2009/12/noaa_gisp2_icecore_anim3.gif
BTW I have advanced degrees in Engineering and mathematics and have been a high-tech VP for years
The AMSU 600mb and 400mb graphs continue their freefall.
How low can it go?
Bob B says:
You need to learn what proof is. The is no PROOF the magnitude of the recent tiny tiny blip of warming is nothing more then climate noise.
Two questions:
1) What is the magnitude of the “tiny tiny blip,” and over what time period?
2) Please quantify “climate noise.”
BTW I have advanced degrees in Engineering and mathematics and have been a high-tech VP for years
Many people have advanced degrees in these subjects (and in ones that are even more scientific).