By WUWT regular “Just The Facts”
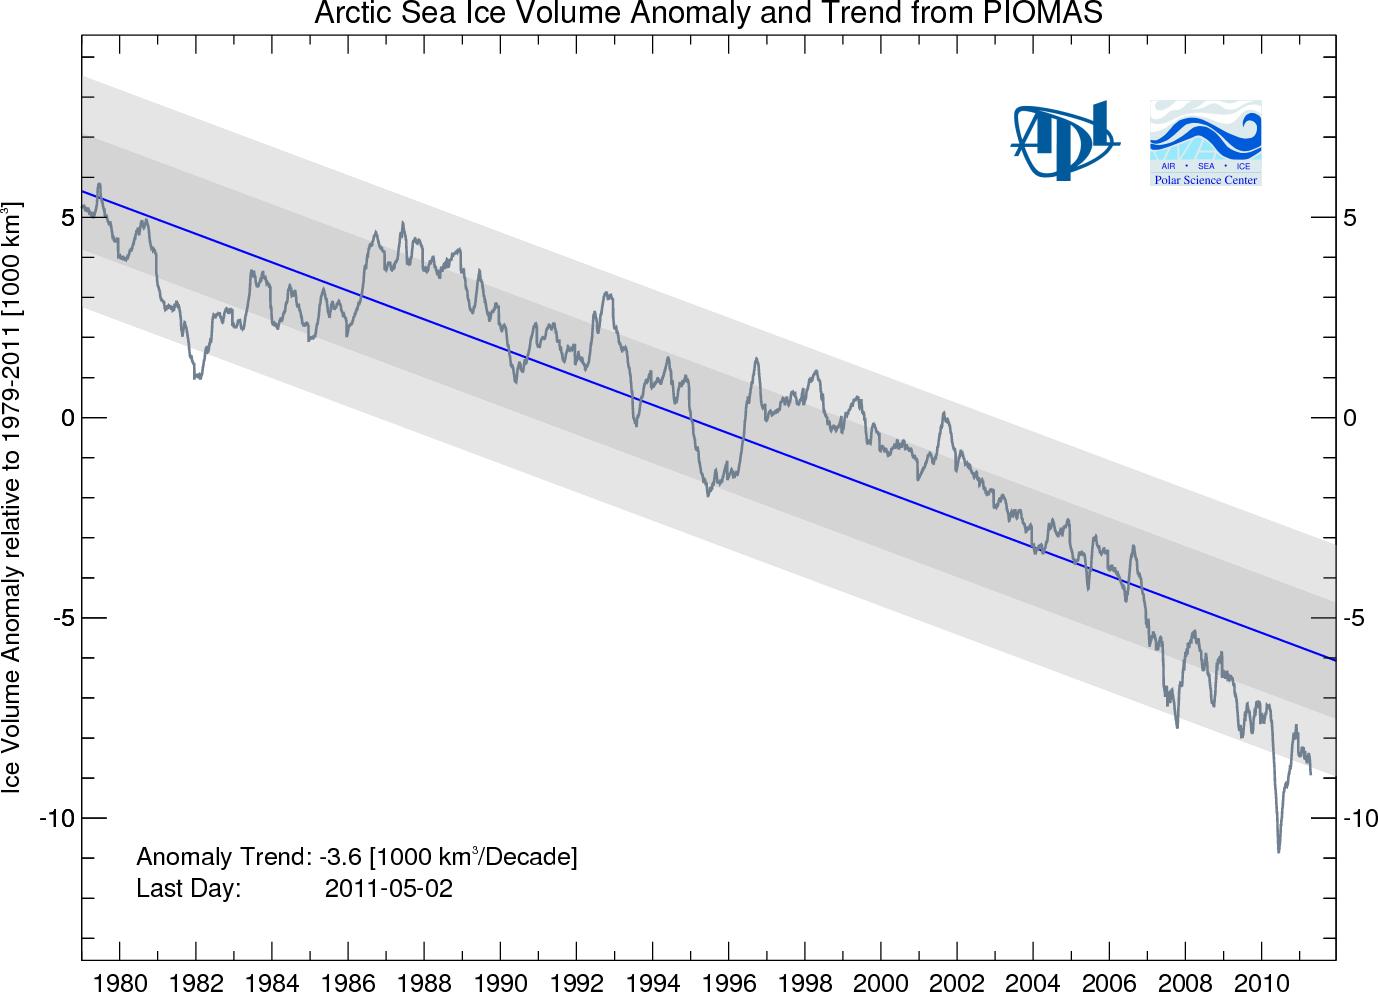
It seems that the Pan-Arctic Ice Ocean Modeling and Assimilation System (PIOMAS) Arctic Sea Ice Volume Model that generated the highly suspect chart above has been corrected to “show reduced errors over the prior version”. According to the University of Washington Polar Science Center website:
“New Version
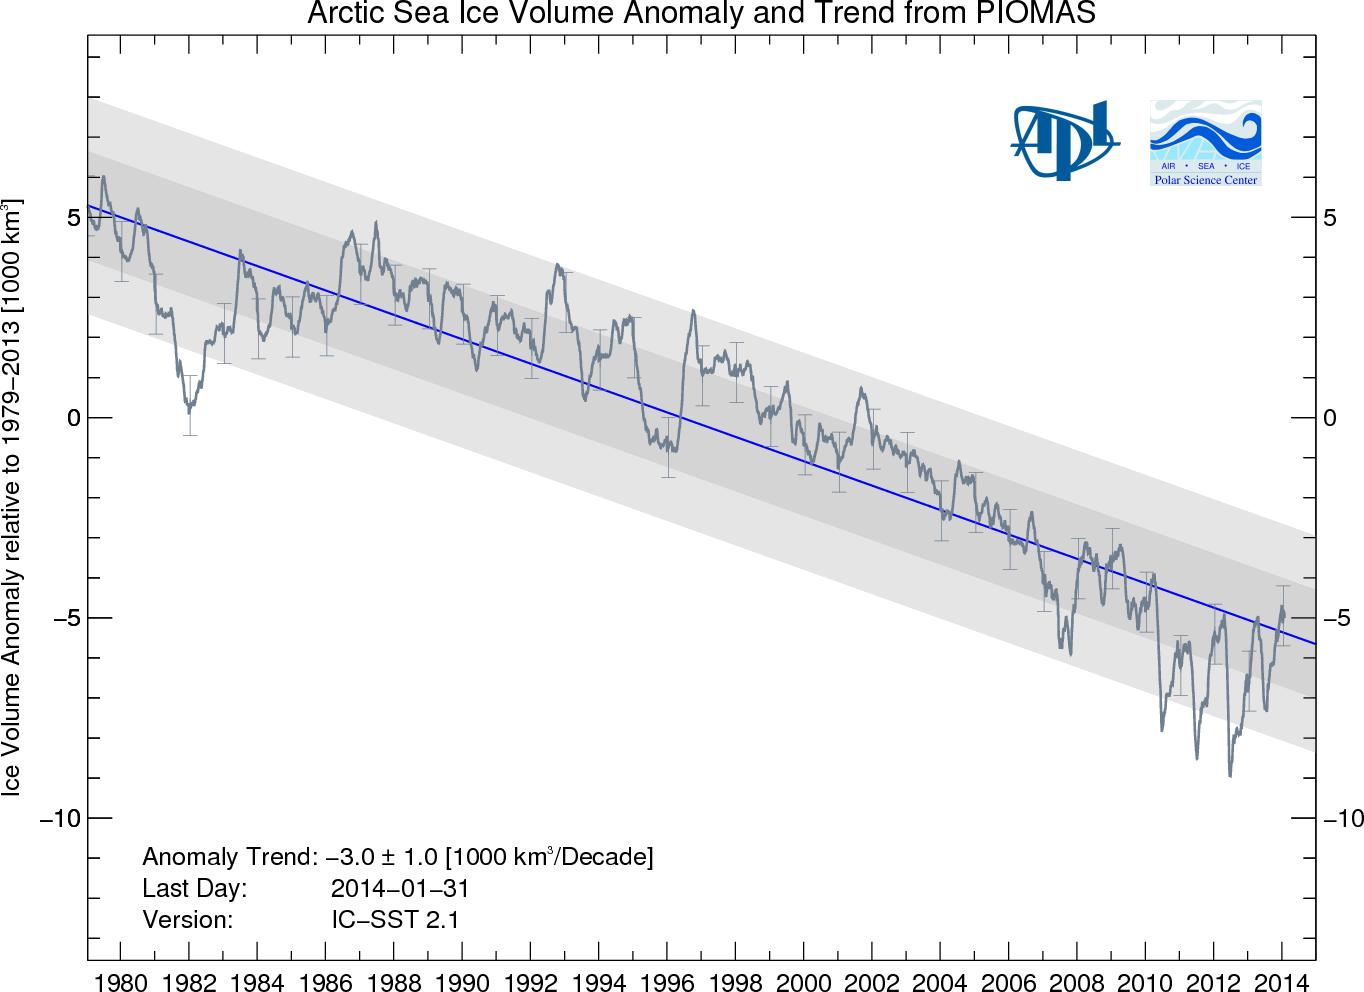
This time series of ice volume is generated with an updated version of PIOMAS (June-15,2011). This updated version improves on prior versions by assimilating sea surface temperatures (SST) for ice-free areas and by using a different parameterization for the strength of the ice. Comparisons of PIOMAS estimates with ice thickness observations show reduced errors over the prior version. The long term trend is reduced to about -2.8 103 km3/decade from -3.6 km3/decade in the last version. Our comparisons with data and alternate model runs indicate that this new trend is a conservative estimate of the actual trend. New with this version we provide uncertainty statistics. More details can be found in Schweiger et al. 2011. Model improvement is an ongoing research activity at PSC and model upgrades may occur at irregular intervals. When model upgrades occur, the entire time series will be reprocessed and posted.”
Here is the PIOMAS New Model Version:
and the chart below appears to show the original “Adjusted” version and the new unadjusted version:
Correction: Per this comment the chart below actually represents an “exercise” “not designed to correct potential model biases” when the “model appears to overestimate thin ice and underestimate thick ice.” The impact of this “exercise” is that the “downward decadal trend increases from -2.8×10³ km3/dec to -3.5×10³ km3/dec” which is the inverse of the impact when they “reduced errors over the prior version” and reduced the trend “to about -2.8 103 km3/decade from -3.6 km3/decade”, however the chart below does not show “the original “Adjusted” version and the new unadjusted version” as was incorrectly stated above.

If you look here you can see how Dr. Jinlun Zhang developed his suspect model. The page states that;
“Satellite sea ice concentration data are assimilated in GIOMAS using the Lindsay and Zhang (2005) assimilation procedure. The procedure is based on “nudging” the model estimate of ice concentration toward the observed concentration in a manner that emphasizes the ice extent and minimizes the effect of observational errors in the interior of the ice pack.”
According to this paper:
“Because of the errors in the summer Gice dataset ice concentration in the interior of the pack (as well as errors in summer ice concentration based on passive microwave observations), assimilation of ice concentration is accomplished in a method that emphasizes the extent over the concentration. The observations are weighted heavily only when there is a large discrepancy between the model and the observed concentration. Each day the model estimate Cmod is nudged to a revised estimate Ĉmod with the relationship.”
So it appears that to develop his model Zhang used an erroneous data set, weighted heavily when observations didn’t fit the model and then “nudged” its output to the results that he wanted.
Zhang has a history of contorting himself to help paint over the gaps in the Catastrophic Anthropogenic Global Warming Narrative. For example, in this NASA article/press release it states that:
“Jinlun Zhang, an oceanographer at the University of Washington, has pieced together a complex computer model that helps explain why Antarctic sea ice is expanding even with signs that ocean and air temperatures are on the rise.”
and in this paper titled “What drove the dramatic retreat of Arctic sea ice during summer 2007?” by Zhang, J., R.W. Lindsay , M. Steele, and A. Schweiger, Geophys. Res. Lett., 35, L11505, doi:10.1029/2008GL034005, 2008, it states that “Arctic sea ice in 2007 was preconditioned to radical changes” and this contributed to “The dramatic decline”. This is not objective science, rather it’s alarmist rhetoric.
Zhang was already looking for an Arctic Sea Ice tipping points in 2005, i.e. the title of this paper paper was “The thinning of arctic sea ice, 1988–2003: have we passed a tipping point?” by Lindsay, R. W. and J. Zhang, J. Climate, 18, 4879–4894, 2005.
In 2006 Zhang co-wrote a paper with Mark “Death Spiral” Serreze and Keith “the lack of warming … is a travesty” Trenberth, titled “The large-scale energy budget of the Arctic” by Serreze, M. C., A. P. Barrett, A. G. Slater, M. Steele, J. Zhang, and K. E. Trenberth, , J. Geophys Res., 112, D11122, doi: 10.1029/2006JD008230, 2007.
Zhang’s history of global warming advocacy aside, I give him credit for correcting his model to reduce the trend from -3.6 km3/decade in the last version to about -2.8 km3/decade in the New Model Version, so that is now less wrong. Then again, he is probably just hedging because, per this article, CryoSat is now generating maps of sea ice thickness and it is just a matter of time before Zhang’s model will be confronted by empirical evidence.
I wonder if all of the Warmist blogs that have used the old inaccurate PIOMAS chart will post updates/corrections to inform their readers of the good news…
To view more reliable sources of sea ice data please visit the WUWT Sea Ice Page.
R. Gates says:
June 28, 2011 at 10:55 am
“What does it really matter that first ice free summer is 2025, 2030, or 2040? The trend is what is important and it’s down down down…”
Nonsense. What really matters are the weather and oceanic pattern variations that have caused that decline. Stop with the numerology.
Julienne Stroeve says:
June 29, 2011 at 12:42 am
[…]Have you noticed that sea ice thickness in Baffin Bay is 3m? That is not possible from thermodynamic ice growth using observed Oct-Feb air temperatures (remember first-year ice is typically 1.5m).[…]
——————————-
Dr. Stroeve,
During the bitter winter here in Europe we were constantly told how warm it was in Greenland. I understand that this was due to a high pressure system trapped up there. I’m not a meteorologist but I understand that high pressure usually means little or no cloud.
Without the insulating effect of clouds isn’t it something other than impossible that the first year ice in that area is thicker than normal?
Pamela Gray says:
June 29, 2011 at 11:10 am
R. Gates says:
June 28, 2011 at 10:55 am
“What does it really matter that first ice free summer is 2025, 2030, or 2040? The trend is what is important and it’s down down down…”
Nonsense. What really matters are the weather and oceanic pattern variations that have caused that decline. Stop with the numerology.
_______
Of course it was weather (by this, I take you mean everything that happens in and through the atmosphere) and oceanic variations…what else can affect the ice? Either heat comes from above or below, but either way, the heat has come. But what you’re probably trying to suggest here is that it is all simply natural variations is the weather, and so nothing outside of natural variations (meaning nothing anthropogenic) is causing the ice to decline. Puny humans, no matter what we do, cannot possible affect the big ol’ earth, right? Certainly not the tons of extra CO2 we add to the atmosphere. And those hundreds or perhaps thousands of experts in the cryosphere, who have have been watching the Arctic sea ice decline for decades and studying pretty much every possible facet of it and documenting those changes in graphs that tell the story of the decline are just practicing numerology, right?
Meanwhile, as the Arctic sea ice declines steadily, the good folks in skepticville are practicing true science as they anticipate the next glacial period, or at least a mini-ice age to start soon. You’d think the Arctic sea ice would show some signs of at least getting back to it’s long term average if that was going to happen…a place it had not been since 2004.
No. I am asking you, as I have on many occasions, what your understanding is on how the rise in anthropogenic CO2 can affect these energy eating weather and oceanic pattern variations in such a way as to no longer point to natural variation, but anthropogenic variation. So far, you have failed on every count to answer this question.
@FergalR
Looking at the cryosat map, it’s not just Baffin Bay that appears to have too thick of first year ice, you can see the black line on the image that delineates the first year from the multiyear ice. I am at a conference at the moment with many sea ice experts and the map has been heavily discussed. Two points of validation have been used: north of elsemere island that airborne observations indicate has ice around 4.1m thick and a spot in the beaufort that airborne obs indicate is 2m thick. We have learned that sometimes the radar penetrates the snowpack and reaches the ice surface, but many times it doesn’t penetrate the snowpack. So say you have 1m thick snowpack, your thickness would be overestimated by 1m.
Thus, I personally believe it is premature to trust the thickness map they released at an airshow, validation is not complete, snow cover is impacting the retrievals and the magnitude of this bias remains unknown at a broad spatial scale.
Pamela Gray says:
June 29, 2011 at 5:10 pm
No. I am asking you, as I have on many occasions, what your understanding is on how the rise in anthropogenic CO2 can affect these energy eating weather and oceanic pattern variations in such a way as to no longer point to natural variation, but anthropogenic variation. So far, you have failed on every count to answer this question.
———-
I don’t know what “energy eating weather and oceanic pattern variations” are, so sorry, I guess that’s why I’ve not answered this question. I can tell you about what global climate models all say the 40% rise in CO2 since the 1750’s will eventually do to the Arctic sea ice though…they’ll make it go away in the summers sometime this century. So, rather than “energy eating”, the geologically rapid build-up of Anthropogenic CO2 is conducive to keeping more heat around in the oceans and atmosphere and so is sort of “ice eating”.
@Julienne,
I’m confused, are you saying ESA released first European ice thickness map to the public only showing a pretty strong polar ice pack and not mentioning 1m snow included?
Julienne, thank you for your insight in the scientific discussion regarding the Cryosat map.
First, I assume that your remark about snow cover was a typo. Of course, because of Archimedes law, only 30 cm in snow-cover-interpreted-as-ice would overestimate the ice thickness by 2 meter. Which seems to be about the overestimate in this map.
Second, you mention 2 validation points, and I posted one above from the Cryosat validation team itself. Are there more validation points available for scientists to study ?
In my opinion, for this map to obtain some scientific credibility, it would REALLY help if the Cryosat validation team would at least publish ALL their validation measurements, and explain the process by which these measurements were considered consistent with the now presented map.
Dr Haas at the IUGG meeting showed 2 locations in his presentation regarding airborne validation sites used for comparison with the Cryosat map. Unfortunately both were over mutliyear ice. My understanding thus far is that none of the firstyear thicknesses were validated and those regions appear to be too thick based on thermodynamic growth rates and observed winter temperatures. I am sure the Cryosat team is busy doing more validation from their recent field campaign, so we should know more hopefully soon.
R. Gates says:
June 29, 2011 at 10:34 pm
I can tell you about what global climate models all say the 40% rise in CO2 since the 1750′s will eventually do to the Arctic sea ice though…
========================================================================
.028 to .039 = .011 increase in 260 years
Justthefacts : it may be too late to reduce your excitement about ‘consistency’ between Cryophere’s first map and PIPS or consistency between both these reports and the real world.
To spoil the fun : It seems that both are heavily biased towards excessive ice volume.
For one, as Dr. Stroeve points out above : the Cryosphere map has been validated with only two measurements, both in multi-year ice, none in first-year ice. Besides, they seemed to have interpreted snow cover as solid ice.
And PIPS was taken offline for a reason :
http://www7320.nrlssc.navy.mil/pips2/
Since late April/early May 2011, PIPS 2.0 has developed an unrealistic opening in the North Pole region. On 22 May 2011, PIPS 2.0 stopped running because of a numerical instability. Since that time, we have been carefully trying to diagnose this problem (checking for anomalous atmospheric forcing, initial fields, boundary conditions, assimilated satellite ice fields, etc). During this process, the system’s ocean model time step was reduced and the system is currently running again. The unobserved opening near the North Pole is still present and can be seen in the ice concentration and ice thickness fields. PLEASE USE THESE FIELDS WITH CAUTION! We have subsequently filled in the period from October 2010 to present with the hindcast using the reduced ocean model time step. Because PIPS 2.0 is a legacy system and will soon be replaced with a new ice nowcast/forecast system (see below), little additional effort will be expended to keep it running.
In short, PIPS will be replaced with a much more updated system. Most of us ice watchers are looking forward to the new system, which you can observe in action (with animations and all) here :
http://www7320.nrlssc.navy.mil/hycomARC/arctic.html
I hope that this new system (the Arctic Cap Nowcast/Forecast System (ACNFS)) will be more accurate than PIPS 2.0, considering that on multiple occasions it reported 4 meter ice where open ocean was clearly visible from MODIS pictures, and in general (despite it’s popularity here on WUWT) seemed to be out of touch with reality. For confirmation of this observation, consider that currently sea ice extent (both in the Actic as well as globally) is breaking all time record lows, and shows no slowdown in breaking the minimium extent record (of 2007).
If you want to see a picture of what really goes on in the Arctic right now, then check this out (latest picture taken at the North Pole) :
http://www.arctic.noaa.gov/latest/noaa2.jpg
Rob says: July 9, 2011 at 2:23 am
Justthefacts : it may be too late to reduce your excitement about ‘consistency’ between Cryophere’s first map and PIPS or consistency between both these reports and the real world.
Yes, especially given that I made no mention of PIPS in my post or subsequent comments. Congratulations on building that strawman and then tearing down, very impressive…
If you want to see a picture of what really goes on in the Arctic right now, then check this out (latest picture taken at the North Pole) :
http://www.arctic.noaa.gov/latest/noaa2.jpg
You mean it’s melting? In the summer? No way!?!…
What do you think about the fact that Arctic temps have been at or below average for much of the melt season:
http://ocean.dmi.dk/arctic/meant80n.uk.php
Wouldn’t that seem to indicate that factors other than temperature are in play, e.g. as I pointed out above:
“Much of the record breaking loss of ice in the Arctic ocean in recent years is down to the region’s swirling winds and is not a direct result of global warming, a new study reveals.” including in the Guardian:
http://www.guardian.co.uk/environment/2010/mar/22/wind-sea-ice-loss-arctic
this 2011 paper submitted to The Cryosphere L. H. Smedsrud, et al.;
http://www.the-cryosphere-discuss.net/5/1311/2011/tcd-5-1311-2011-print.pdf
used “geostrophic winds derived from reanalysis data to calculate the Fram Strait ice area export back to 1957, finding that the sea ice area export recently is about 25 % larger than during the 1960’s.”
Additionally this paper;
http://journals.ametsoc.org/doi/abs/10.1175/1520-0442%282001%29014%3C3508%3AFSIFAA%3E2.0.CO%3B2
found that;
“Observations reveal a strong correlation between the ice fluxes through the Fram Strait and the cross-strait air pressure difference.”
“Although the 1950s and 1990s stand out as the two decades with maximum flux variability, significant variations seem more to be the rule than the exception over the whole period considered.”
“A noticeable fall in the winter air pressure of 7 hPa is observed in the Fram Strait and the Barents Sea during the last five decades.”
“The corresponding decadal maximum change in the Arctic Ocean ice thickness is of the order of 0.8 m. These temporal wind-induced variations may help explain observed changes in portions of the Arctic Ocean ice cover over the last decades. Due to an increasing rate in the ice drainage through the Fram Strait during the 1990s, this decade is characterized by a state of decreasing ice thickness in the Arctic Ocean.”
Just The Facts says : I made no mention of PIPS in my post or subsequent comments
In this post, indeed you did not. You did however quickly accept Steven Goddard and Anthony Watts, when they used PIPS data (in May 2010) as evidence for significant “ice thickening since 2008”. And you posted no question as to where all that thick ice went between May and Sept 2010 nor questioning about the validity of PIPS.
And you display the same biased opinions when you state CryoSat is now generating maps of sea ice thickness and it is just a matter of time before Zhang’s model will be confronted by empirical evidence
Here, you forget to mention that PIOMAS has been validated by thousands of measurements, while Cryosat first data was so far based on a whopping 2 measurements, meanwhile presenting data for first-year ice (as in Baffin Bay) which is inconsistent with the laws of physics (as Dr.Stroeve rightfully pointed out). Seems to me that Cryosat has a long way to go in being validated, and PIOMAS has a long track record of consistency with emirical evidence.
Instead, you accuse PIOMAS as ” highly suspect” and Zhang of having a “history of contorting himself” and to “paint over the gaps in the Catastrophic Anthropogenic Global Warming Narrative” and “history of global warming advocacy” and other ad hominems.
To top it off, after accusing me of setting a strawman, you place several strawmans yourself in referring to DHI’s melting season temperatures (without mentioning the warm winter clearly visible in the DMI graph) and two papers about ice export through Fram strait (which actually seem to confirm the PIOMAS reduction in Arctic sea ice volume over the past decades.
Just The Facts, I’m not sure who Anthony allows you to post your ad hominems against Zhang, and why he lets you post strong allegations against PIOMAS as well as throwing strawman arguments around that in fact disprove your own pet theories. Without providing evidence for your rethoric and increasingly questionable biased allegations, it seems to me that you could learn something from mother Nature who, despite DMI temps and despite your rethoric about Fram strait, and despite your accusations against Zhang and PIOMAS, provides the best empirical evidence against your increasingly irrelevant opions and rethoric, in breaking all records of ice extent as we speak :
http://www.ijis.iarc.uaf.edu/en/home/seaice_extent.htm
Julienne Stroeve says:
June 29, 2011 at 12:42 am
I have been surprised that so many are quick to believe the recently shown Cryosat ice thickness map. This map has not been validated. It has not been published in a peer-reviewed journal, it has not undergone any rigorous assessment for accuracy.
You have answered your own question. Owing to the corrupt state of climate academia, peer-reviewed publication does not increase confidence in any “research” but the exact opposite. We regularly see papers on this site that are peer-reviewed and deeply scientifically flawed (e.g. fudgeing the cooling of Antarctica, and all the nonsense on ocean acidification) to know that peer review in the climate field has utterly failed. Peer-review acceptance of a climate related study in a major journal makes it more probable that the work in question is a dishonest politically motivated tract.
Human scientific research and academia is highly fragmented and an insular throw-back to medieval feudalism (perhaps even this is climate – related, since we are now back to medieval temperatures?) Scientific fields are introverted fenced-in little fiefdoms easily and spontaneously dominated by a ruling mafia which proves easy to be subverted by – and become subservient to – a suitable political agenda. I have seen this happen clearly enough in one scientific field to recognise it in the politicized climate arena.
Rob says: July 12, 2011 at 12:11 am
Just The Facts says : I made no mention of PIPS in my post or subsequent comments
In this post, indeed you did not. You did however quickly accept Steven Goddard and Anthony Watts, when they used PIPS data (in May 2010) as evidence for significant “ice thickening since 2008″. And you posted no question as to where all that thick ice went between May and Sept 2010 nor questioning about the validity of PIPS.
So originally you stated that, “it may be too late to reduce your excitement about ‘consistency’ between Cryophere’s first map and PIPS” and now you argue that I wasn’t “questioning about the validity of PIPS” last summer. There’s a slight difference there. Does this mean that you admit that your first statement was erroneous?
quickly accept Steven Goddard and Anthony Watts, when they used PIPS data (in May 2010) as evidence for significant “ice thickening since 2008
The only post of mine I found from 2010 that refers to PIPS is this one;
http://wattsupwiththat.com/2010/06/28/sea-ice-news-11/#comment-419140
and you can just see my excitement about it…
And you display the same biased opinions when you state CryoSat is now generating maps of sea ice thickness and it is just a matter of time before Zhang’s model will be confronted by empirical evidence
Here, you forget to mention that PIOMAS has been validated by thousands of measurements, while Cryosat first data was so far based on a whopping 2 measurements, meanwhile presenting data for first-year ice (as in Baffin Bay) which is inconsistent with the laws of physics (as Dr.Stroeve rightfully pointed out). Seems to me that Cryosat has a long way to go in being validated, and PIOMAS has a long track record of consistency with emirical evidence.
If PIOMAS “has been validated by thousands of measurements” then why was it so wrong for so long before it was recently corrected to be less wrong?
Instead, you accuse PIOMAS as ” highly suspect” and Zhang of having a “history of contorting himself” and to “paint over the gaps in the Catastrophic Anthropogenic Global Warming Narrative” and “history of global warming advocacy” and other ad hominems.
Not ad hominems, just statements of fact.
Just The Facts, I’m not sure who Anthony allows you to post your ad hominems against Zhang, and why he lets you post strong allegations against PIOMAS as well as throwing strawman arguments around that in fact disprove your own pet theories. Without providing evidence for your rethoric and increasingly questionable biased allegations, it seems to me that you could learn something from mother Nature who, despite DMI temps and despite your rethoric about Fram strait, and despite your accusations against Zhang and PIOMAS, provides the best empirical evidence against your increasingly irrelevant opions and rethoric, in breaking all records of ice extent as we speak :
http://www.ijis.iarc.uaf.edu/en/home/seaice_extent.htm
Most of your writing is just empty blather, but I agree that Arctic Sea Ice is trending low this year. Do you think that, in addition to the impact of wind, it might have something to do with all of the other non-CO2 related anthropogenic effects, e.g.:
Per the “Arctic Marine Shipping Assessment 2009 Report. Arctic Council, April 2009, second printing”;
http://www.pame.is/images/stories/PDF_Files/AMSA_2009_Report_2nd_print.pdf
on Page 160;
“Spring break-up to mark the start of summer navigation will vary and, as happens now in more southerly seas, shippers eager to start work will test the limits of their vessels in ice.”
On Page 4;
“There were approximately 6,000 individual vessels, many making multiple voyages, in the Arctic region during the AMSA survey year; half of these were operating on the Great Circle Route in the North Pacific that crosses the Aleutian Islands. Of the 6,000 vessels reported, approximately 1,600 were fishing vessels.”
this on Pages 141 – 142;
“The AMSA has developed the world’s first activity-based estimate of Arctic marine shipping emissions using empirical data for shipping reported by Arctic Council member states. Emissions were calculated for each vessel-trip for which data was available for the base year 2004. The 515,000 trips analyzed represent about 14.2 million km of distance traveled (or 7.7 million nautical miles) by transport vessels; fishing vessels represent over 15,000 fishing vessel days at sea for 2004. Some results could be an underestimation of current emissions, given potential underreporting bias and anecdotal reports of recent growth in international shipping and trade through the Arctic.”
on Page 79;
“A specific example of where cruise ship traffic is increasing at a rapid rate is off the coast of Greenland. As Table 5.3 shows, cruise ship visits and the number of passengers visiting Greenland has increased significantly between 2003 and 2008. For example, between 2006 and 2007, port calls into Greenland increased from 157 to 222 cruise ships. The number of port calls in 2006 combined for a total of 22,051 passengers, a number that represents nearly half of Greenland’s total 2006 population of 56,901.
In 2008, approximately 375 cruise ship port calls were scheduled for Greenland ports and harbors, more than double the number of port calls seen in 2006.”
But the environmentalists do their share of Arctic travel, i.e. on page 84:
“During 2004-2008, there were 33 icebreaker transits to the North Pole for science and tourism. An increasing number of icebreakers and research vessels are conducting geological and geophysical research throughout the central Arctic Ocean related to establishing the limits of the extended continental shelf under UNCLOS.”
And it’s not just about breaking up sea ice, on Page 5 it says that;
“Black carbon emissions from ships operating in the Arctic may have
regional impacts by accelerating ice melt.”
on Page 140:
“Shipping’s contribution to regional and global impacts from emissions such as CO2, NOx and SO2 have been evaluated by scientists and shown to be significant enough to motivate policy action. However, environmental and climate effects of NOx and ozone, sulfur aerosols and clouds, and black carbon particles in the Arctic are only beginning to be understood. Black carbon has been proven to have significant climate forcing effects, in addition to its effects on snow and ice albedo, accelerating the retreat of Arctic sea ice.”
and on Page 137;
“The 2004 U.S. Commission on Ocean Policy reported that, while at sea, the average cruise-ship passenger generates about eight gallons of sewage per day and an average cruise ship can generate a total of 532,000 to 798,000 liters of sewage and 3.8 million liters of wastewater from sinks, showers and laundries each week, as well as large amounts of solid waste (garbage). The average cruise ship will also produce more than 95,000 liters of oily bilge water from engines and machinery a week. Sewage, solid waste and oily bilge water release are regulated through MARPOL. There are no restrictions on the release of treated wastewater.”
Just The Facts:
I’m not sure if this is the first time that you post a blog as a guest, but let me tell you that as a reader, I don’t think it helps your credibility if you post endless off-topic deliberations about sewer disposals of cruise ships as an argument to sustain your belief systems.
Also, if you post insults against scientists as you do, it would help if you would actually get your facts straightened out. You post this graph :
http://psc.apl.washington.edu/wordpress/wp-content/uploads/schweiger/ice_volume/validation/Fig10.png
and claim that it shows “the original ‘Adjusted’ version and the new unadjusted version”.
This is simply not correct.
The graph presents the difference between the new PIOMAS version adjusted for submarine sonar bias versus the new PIOMAS version unadjusted form.
I pointed that out in a post above (June 29, 2011 at 2:28 am) where this link :
http://psc.apl.washington.edu/wordpress/research/projects/arctic-sea-ice-volume-anomaly/validation/
which clearly shows that unadjusted PIOMAS underestimates thick ice and overestimates thin ice.
And thus, as Zhang readily pointed out “this new trend is a conservative estimate of the actual trend”. And in fact, the sonar-bias adjusted trend is almost identical to the ‘old’ PIOMAS version trend. I’ll dig up a graph if you insist.
So not only are you throwing empty ad hominems at Zhang and vent opinions about PIOMAS results without evidence, you also seem to have no clue at all about the nature of the PIOMAS adjustments and you lack understanding of even the basic evidence that your present yourself. You simply throw out some words and slap some graph around and expect that people are foolish enough to believe your delirious rants ?
One piece of advice for the Cryosat post that you contemplated : as the OP, back-up your statements with actual links, keep your responses to comments short and too the point, get your facts straight, and by all means, don’t write endless stories about other pet-theories you may hold.
You can thank me later.
Rob says: July 14, 2011 at 1:38 am
I’m not sure if this is the first time that you post a blog as a guest
I’ve posted a number of times;
http://wattsupwiththat.com/author/justthefactswuwt/
built a number of WUWT’s reference pages;
http://wattsupwiththat.com/reference-pages/
and held countless debates within comment threads:
http://www.google.com/search?q=%22just+the+facts%22+watts+up+with+that&ie=utf-8&oe=utf-8&aq=t&rls=org.mozilla:en-US:official&client=firefox-a#hl=en&pq=%22just%20the%20facts%22%20watts%20up%20with%20that&xhr=t&q=%22just+the+facts%22+wattsupwiththat&cp=28&pf=p&sclient=psy&client=firefox-a&hs=SLG&rls=org.mozilla:en-US%3Aofficial&source=hp&aq=f&aqi=&aql=&oq=%22just+the+facts%22+wattsupwiththat&pbx=1&bav=on.2,or.r_gc.r_pw.&fp=97eede9ed711c932&biw=1600&bih=729&bs=1
endless off-topic deliberations
The topic we are discussing is the Warmists’ effort to exaggerate the decrease in Arctic Sea Ice during the last decade and imply that decrease is primarily associated with “Global Warming”. Per the post above, until Zhang corrected his model it exaggerated the decline in Arctic Sea Ice Volume by at least 28.5%, and per this paper;
http://psc.apl.washington.edu/zhang/Pubs/Zhang_etal2008GL034005.pdf
Zhang’s “4. Conclusions
The dramatic decline of the arctic ice cover in summer 2007 occurred after years of shrinking and thinning (Figures 1a, 3a, and 3b) in a warming environment [Hassol, 2004].”
“Thus, the arctic sea ice in the beginning of 2007 was preconditioned for radical changes [Zhang et al., 2000; Lindsay and Zhang, 2005].”
imply that “Global Warming” is the primary contributor, when there is ample evidence that, “perennial sea ice covering the Arctic Ocean decreased by 23 percent during the past two winters as strong winds swept more Arctic ice than usual out Fram Strait near Greenland. The study relied on 50 years of data from the International Arctic Buoy Program, currently directed by Ignatius Rigor of the UW’s Applied Physics Laboratory, and eight years of data from NASA’s QuikScat satellite, a review of which was led by Son Nghiem of NASA’s Jet Propulsion Laboratory.”
“The most important thing about this paper is that it foretells this summer’s record minimum ice extent in the Arctic,” Rigor, a research scientist and co-author on the paper, says. “While the total area of ice cover in recent winters has remained about the same, during the past two years an increased amount of older, thicker perennial sea ice was swept by winds out of the Arctic Ocean into the Greenland Sea. What grew in its place in the winters between 2005 and 2007 was a thin veneer of first-year sea ice, which simply has less mass to survive the summer melt.”
http://uwnews.washington.edu/ni/article.asp?articleID=36894
Here’s the paper;
http://seaice.apl.washington.edu/
it states that “The winter AO-index explains as much as 64% of the variance in summer sea-ice extent in the Eurasian sector, but the winter and summer AO-indices combined explain less than 20% of the variance along the Alaskan coast, where the age of sea-ice explains over 50% of the year-to year variability. If this interpretation is correct, low summer sea-ice extents are likely to persist for at least a few years. However, it is conceivable that, given an extended interval of low-index AO conditions, ice thickness and summertime sea-ice extent could gradually return to the levels characteristic of the 1980’s.”
And the issue of scientists implying that decrease is associated primarily with “Global Warming” extends beyond Zhang, for example Julienne Stroeve, whose capabilities I have significant respect for, wrote in 2007 that:
“The authors speculate that the computer models may fail to capture the full impact of increased carbon dioxide and other greenhouse gases in the atmosphere. Whereas the models indicate that about half of the ice loss from 1979 to 2006 was caused by increased greenhouse gases, and the other was half caused by natural variations in the climate system, the GRL study indicates that greenhouse gases may be playing a significantly higher role.”
and Mark Serreze topped it off with “Our study indicates that the impacts of greenhouse gases on Arctic sea ice are strong and growing”.
http://nsidc.org/news/press/20070430_StroeveGRL.html
Also, if you post insults against scientists as you do, it would help if you would actually get your facts straightened out. You post this graph :
http://psc.apl.washington.edu/wordpress/wp-content/uploads/schweiger/ice_volume/validation/Fig10.png
and claim that it shows “the original ‘Adjusted’ version and the new unadjusted version”.
This is simply not correct.
The graph presents the difference between the new PIOMAS version adjusted for submarine sonar bias versus the new PIOMAS version unadjusted form.
I pointed that out in a post above (June 29, 2011 at 2:28 am) where this link :
http://psc.apl.washington.edu/wordpress/research/projects/arctic-sea-ice-volume-anomaly/validation/ which clearly shows that unadjusted PIOMAS underestimates thick ice and overestimates thin ice.
You are right on this point, the first time I read the paper, Uncertainty in Modeled Arctic Sea Ice Volume by Axel Schweiger, Ron Lindsay, Jinlun Zhang, Mike Steele and Harry Ster;
http://psc.apl.washington.edu/wordpress/wp-content/uploads/schweiger/pubs/IceVolume-2011-06-02-accepted-with-figures.pdf
I skimmed section, “5.2 Uncertainty using adjusted model output
“As previously discussed, the comparison of PIOMAS results with thickness observations, assuming that those are free of systematic errors, shows that the model appears to overestimate thin ice and underestimate thick ice (Figure 2). How do such systematic differences impact ice volume trends? To answer this question, we transform modeled ice thickness to an “adjusted” ice thickness that removes such differences. We estimate linear coefficients for hobs=a+b*hModel using all in-situ observations using a procedure that allows for errors in both dependent and independent variables [Williams et al., 2010]. Making the assumption that this relationship holds everywhere and at all times, we apply the resulting coefficients to individual PIOMAS grid-cells and then sum spatially to re-compute time series of ice volume anomalies. “the results (Figure 10) show that anomalies are relatively insensitive to this correction but that the downward trend is somewhat increased.
Because thick ice in the earlier period increases in thickness, and thinner ice during the later period is thinned by this adjustment, the downward decadal trend increases from -2.8×10³ km3/dec to -3.5×10³ km3/dec. Mean total ice volume over the 1979-2010 period decreases from 21×103 km3 to 19×103 km3. Note that this exercise is not designed to correct potential model biases, nor do we discount the possibility that model and observational differences are due to errors in the observations. It does however provide a measure of the sensitivity of ice volume estimates to the noted systematic differences between modeled and observed ice thickness.”
Given that the result of manipulating the data as described above was that the “downward decadal trend increases from -2.8×10³ km3/dec to -3.5×10³ km3/dec” which was the same change to the trend when they “reduced errors over the prior version” and reduced the trend “to about -2.8 103 km3/decade from -3.6 km3/decade”;
http://psc.apl.washington.edu/wordpress/research/projects/arctic-sea-ice-volume-anomaly/
and the fact that the trend lines in Fig 10,
http://psc.apl.washington.edu/wordpress/wp-content/uploads/schweiger/ice_volume/validation/Fig10.png
match up quite closely to the trend lines in the old version of PIOMAS;
http://psc.apl.washington.edu/wordpress/wp-content/uploads/schweiger/ice_volume/BPIOMASIceVolumeAnomalyCurrent.png
and the corrected version:
http://psc.apl.washington.edu/wordpress/wp-content/uploads/schweiger/ice_volume/BPIOMASIceVolumeAnomalyCurrentV2.png
I incorrectly assumed that Figure 10 was a comparison of the old version and the corrected version, versus an “exercise” “not designed to correct potential model biases” when the “model appears to overestimate thin ice and underestimate thick ice.”
So not only are you throwing empty ad hominems at Zhang and vent opinions about PIOMAS results without evidence,
Empty? I’ve supported everyone of my assertions with links and quotes.
You simply throw out some words and slap some graph around and expect that people are foolish enough to believe your delirious rants ?
Funny, I’ve been working on this post for over a year;
http://wattsupwiththat.com/2010/05/28/does-piomass-verify/#comment-399417
One piece of advice for the Cryosat post that you contemplated :
I am going to hold off on CryoSat for a while, it still needs a bunch of work before it’s worth dissecting. I think I might do a post on how Warmists imply that Global Warming is causing a rapid decline in Arctic Sea Ice, when increases in Arctic temperature are likely a minor factor in the decline over the last decade.
back-up your statements with actual links,
Please point out the statements that I didn’t back up with links in this thread and I’ll have to add them.
keep your responses to comments short and too the point,
Most of the people who trek this far down on a WUWT thread, or certainly one of my threads, are likely looking for some interesting and involved content.
get your facts straight
Other than misusing a confusing Figure 10, which in no way changes the conclusion of my post, can you point out any other not straight facts?
and by all means, don’t write endless stories about other pet-theories you may hold.
Pet theories? The majority of the research I’ve found indicates that “Global Warming” is not the primary factor in the decrease is Arctic Sea Ice during the last decade:
http://arctic.atmos.uiuc.edu/cryosphere/IMAGES/seaice.anomaly.arctic.png
Do you agree that the majority of the decrease in Arctic Sea Ice during the last decade wasn’t caused by Global Warming?
You can thank me later.
I’ll thank you now, just like on the last thread;
http://wattsupwiththat.com/2011/05/19/sea-ice-news-call-for-arctic-sea-ice-forecasts-plus-forecast-poll/#comment-690213
responding to your challenges is helpful in motivating my research, collecting my thoughts, honing my arguments and building link farms for future use. Thank you for your help.