Global Sea Ice Reference Page: Arctic and Antarctic current graphs and imagery
Shortlink for this page: https://wp.me/P7y4l-5Kc (suitable for blog or Twitter comments)
All images are displayed from either their source or, if the file names include timestamps, are automatically created copies updated soon after appearing at their source.
Global Sea Ice
Global, Arctic, & Antarctic Sea Ice Area:

climate4you.com – Ole Humlum – Professor, University of Oslo Department of Geosciences – Click the image to view at source
Arctic Graphs
Arctic Sea Ice Extent – 15% or greater:

National Snow & Ice Data Center (NSIDC) – click to use their interactive extent graph generator
→ NSIDC Charctic Interactive Sea Ice Graph
JAXA Arctic Sea Ice Extent – 15% or Greater:


JAXA / NIPR – VISHOP Sea Ice Extent Viewer
JAXA data download (CSV file of extent) here
Arctic Sea Ice Extent 15% coverage or greater (DMI):

Danish Meteorological Institute (DMI) – Centre for Ocean and Ice – Click the image to view at source | → DMI Arctic Sea Ice Extent
Arctic Sea Ice Extent 15% or Greater (NANSEN/NERSC):

Nansen Environmental and Remote Sensing Center (NERSC) – Arctic ROOS | → NERSC Arctic ROOS
Nansen data (CSV file with both extent and area) download here
Arctic Sea Ice Area:

Nansen Environmental and Remote Sensing Center (NERSC) – Arctic ROOS | → NERSC Arctic ROOS
Nansen data (CSV file with both extent and area) download here
Sea Ice Extent – Change in Maximum, Mean and Minimum:

Nansen Environmental and Remote Sensing Center (NERSC) – Arctic Regional Ocean Observing System (ROOS) – Click the image to view at source | → NERSC Arctic ROOS
Arctic Sea Ice Forecast from NOAA
NOAA CPC sea ice extent forecasts from the CFSv2 model:
→ NOAA CPC CFSv2 Sea Ice Extent Forecast
Northern Regional Sea Ice Charts
Map of the Arctic – Thanks to REP

National Snow & Ice Data Center (NSIDC) – The Perry-Castañeda Library Map Collection – click to view at source | → NSIDC Arctic Meteorology
Ice coverage charts by supplier:
OSI-SAF – EUMETSAT Ocean and Sea Ice Satellite Application Facility – https://osi-saf.eumetsat.int/products/sea-ice
Russia’s Arctic and Antarctic Research Institute – sea-ice map distinguishing between first and multi-year ice – https://www.aari.ru/odata/_d0015.php?lang=1&mod=1
CryoSat-2 ice thickness data based on actual measurements – https://cpom.org/csopr/seaice.html
Graphs of Ice Coverage by Basin – Regional sea ice time series are available from the NSIDC Sea Ice Index:
→ NSIDC Sea Ice Index – Regional Data and Graphs
Individual regional time series available for: Central Arctic · Baffin Bay/Gulf of St. Lawrence · Baltic Sea · Barents Sea · Beaufort Sea · Bering Sea · Canadian Archipelago · Chukchi Sea · Cook Inlet · East Siberian Sea · Greenland Sea · Hudson Bay · Kara Sea · Laptev Sea · Sea of Okhotsk · Yellow Sea
Sources:
National Snow and Ice Data Center (NSIDC) – Sea Ice Index
Arctic Temperature
Mean Temperature above 80°N:

Danish Meteorological Institute (DMI) – Click the image to view at source | → DMI Mean Temperature above 80°N (historical files)
RSS Northern Polar Temperature Lower Troposphere (TLT) – 1979 to present:
RSS/AMSU lower troposphere temperature time series for the Northern Polar region are available via the RSS interactive browser. Select Channel TLT (v4.0) and Region North Polar.
→ Open RSS MSU/AMSU Time Series Browser
Remote Sensing Systems (RSS) – Microwave Sounding Units (MSU/AMSU)
Northern Hemisphere Surface Temperatures

NOAA – Physical Sciences Laboratory (PSL) – Click the image to view at source | → NOAA PSL Maps
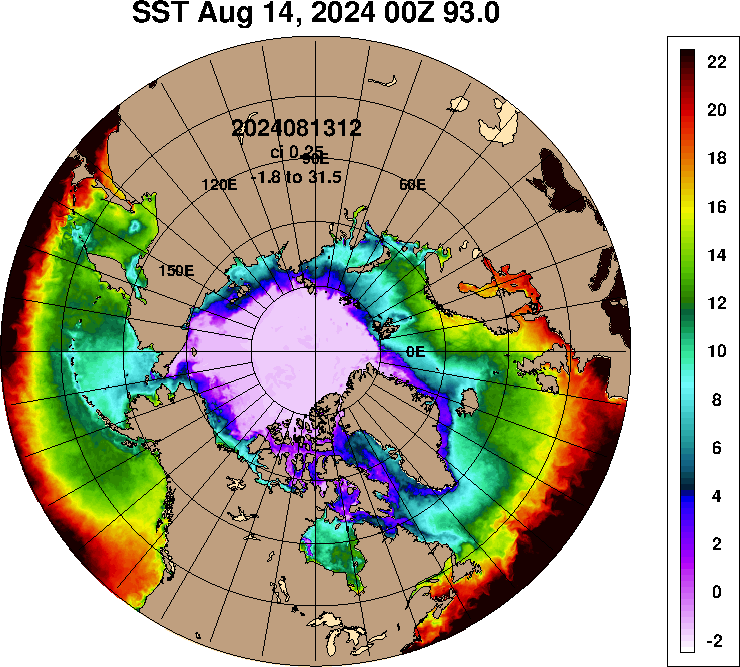
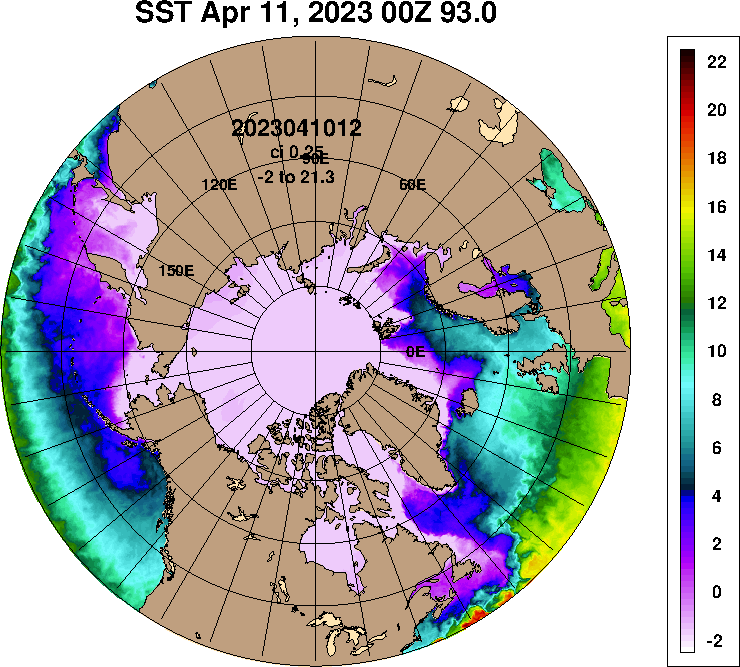
Arctic Sea Surface Temperature

Naval Research Laboratory (NRL) – HYCOM Consortium for Data-Assimilative Ocean Modeling – Click the image to view at source | → NRL HYCOM Arctic Products
NRL – Arctic Sea Surface Temperature – 30 Day Animation
NRL – Arctic Sea Surface Temperature – 365 Day Animation
Moyhu – Arctic Sea Surface Temperature – 50 Day Animation
Moyhu – Arctic Sea Surface Temperature – 365 Day Animation
Sea Ice Concentration
Arctic Sea Ice Concentration:

Naval Research Laboratory (NRL) – HYCOM Consortium for Data-Assimilative Ocean Modeling – Click the image to view at source | → NRL HYCOM Arctic Products
Arctic Sea Ice Concentration – 30 Day Animation
Arctic Sea Ice Concentration – 365 Day Animation
Canadian Sea Ice Concentration:
Environment and Climate Change Canada – Canadian Ice Service – → Canadian Ice Service latest conditions
Arctic Sea Ice Extent With Anomaly

National Snow & Ice Data Center (NSIDC) – Click the image to view at source | → NSIDC Arctic Sea Ice News
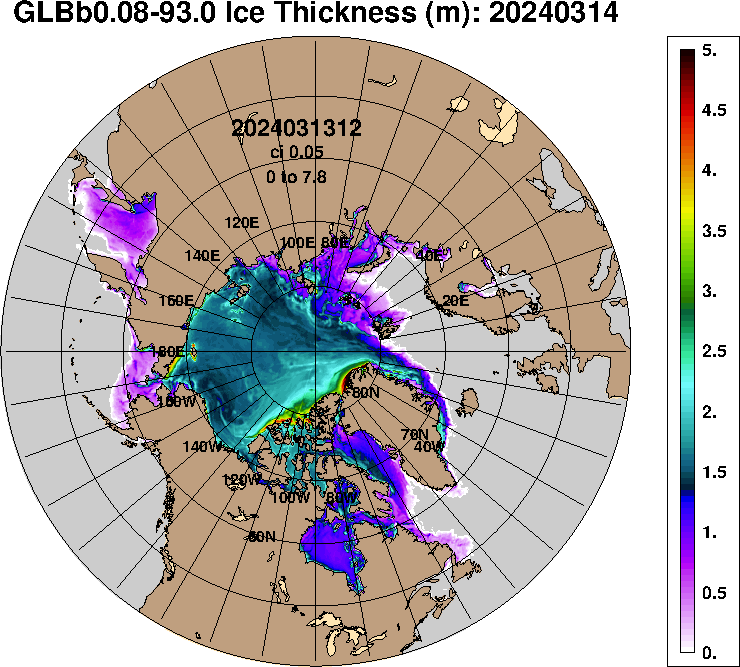
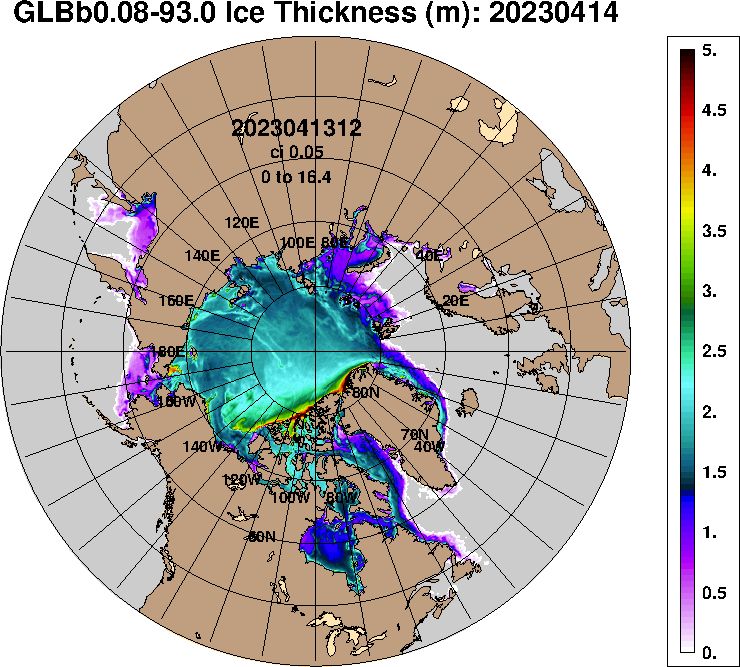
Arctic Sea Ice Thickness

University of Bremen – Thin Ice Thickness – → University of Bremen Sea Ice
N.B. Per the University of Bremen: Thin sea ice thickness data are calculated only during the freezing season (October to April in the Arctic). During the melting season the procedure does not yield meaningful results.
Real-Time Nowcast/Forecast in Meters:

Naval Research Laboratory (NRL) – HYCOM Consortium for Data-Assimilative Ocean Modeling – Click the image to view at source | → NRL HYCOM Arctic Products
Arctic Sea Ice Thickness – 30 Day Animation
Arctic Sea Ice Thickness – 365 Day Animation
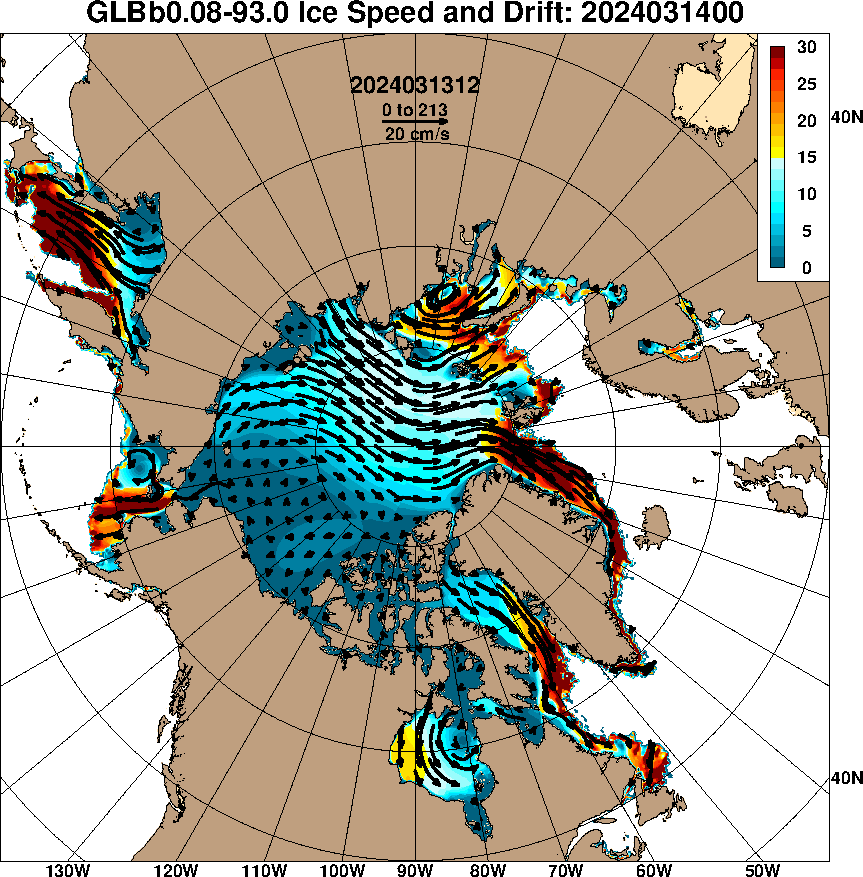
Arctic Sea Ice Speed & Drift:

Naval Research Laboratory (NRL) – HYCOM Consortium for Data-Assimilative Ocean Modeling – Click the image to view at source | → NRL HYCOM Arctic Products
Arctic Sea Ice Speed & Drift – 30 Day Animation
Arctic Sea Ice Speed & Drift – 365 Day Animation
Ice Drift in the Arctic Ocean:

Danish Meteorological Institute – Click the image to view at source | → DMI Arctic Ice Drift
N.B.: DMI says this is a demonstration product. Frequently the images rendered will simply be wrong.
Arctic Sea Ice Volume – Model from the University of Washington (Note: this is only updated monthly, and is a model output, not a real-time observation, details here):

University of Washington – Polar Science Center – PIOMAS Arctic Sea Ice Volume Model – Click the image to view at source | → UW PIOMAS Sea Ice Volume
Greenland Ice Sheet Surface Mass Balance
Images from Polar Portal’s Greenland pages:

Polar Portal – Map showing ice gain/loss anomalies since Sept 1 – Click the image to view full size | → Polar Portal Greenland

Polar Portal – Graph of daily and total ice gain/loss since Sept 1 – Click the image to view full size | → Polar Portal Greenland
Arctic Satellite Imagery
NASA WorldView – True Color Arctic Satellite Image – With zoom – NASA GIBS/WorldView
NASA WorldView – Bands 3-6-7 Arctic Satellite Image – With Zoom – NASA
NASA WorldView – Aqua True Color Arctic Satellite Image – With Zoom – NASA
Antarctic Graphs
Antarctic Sea Ice Extent – 15% or Greater:

National Snow & Ice Data Center (NSIDC) – Click the image to view at source | → NSIDC Sea Ice News
JAXA Antarctic Sea Ice Extent – 15% or Greater:


JAXA / NIPR – → VISHOP Sea Ice Extent Viewer
JAXA data download (CSV file of Antarctic extent) here
Antarctic Temperature
RSS Southern Polar Temperature Lower Troposphere (TLT) – 1979 to present:
RSS/AMSU lower troposphere temperature time series for the Southern Polar region are available via the RSS interactive browser. Select Channel TLT (v4.0) and Region South Polar.
→ Open RSS MSU/AMSU Time Series Browser
Remote Sensing Systems (RSS) – Microwave Sounding Units (MSU/AMSU)
Antarctic Sea Surface Temperature
The NRL Antarctic Sea Surface Temperature imagery previously linked here has been discontinued. Current Southern Ocean SST data is available from:
→ Naval Research Laboratory Marine Meteorology Division
Moyhu – Antarctic Sea Surface Temperature – 50 Day Animation
Moyhu – Antarctic Sea Surface Temperature – 365 Day Animation
Antarctic Sea Ice Imagery
Southern Hemisphere Sea Ice Extent With Anomaly:

National Snow & Ice Data Center (NSIDC) – Click the image to view at source | → NSIDC Sea Ice News
South Pole Station Webcam

Amundsen-Scott South Pole Station – NOAA Global Monitoring Laboratory (GML) | → NOAA GML South Pole Observatory
Source Guide
Danish Meteorological Institute (DMI) – Centre for Ocean and Ice
Home Page – https://ocean.dmi.dk/english/index.php
Arctic Page – https://ocean.dmi.dk/arctic/index.uk.php
climate4you.com – Ole Humlum – Professor, University of Oslo Department of Geosciences
Home Page – https://www.climate4you.com/
Sea Ice Page – https://www.climate4you.com/SeaIce.htm
moyhu – Nick Stokes
Home Page – https://moyhu.blogspot.com/
Regional Hi-Res SST Movies – https://moyhu.blogspot.com/p/sst-regional-movies-as-described-here-i.html
Naval Research Laboratory (NRL) – HYCOM Consortium for Data-Assimilative Ocean Modeling
NRL Home Page – https://www.nrlmry.navy.mil/
HYCOM Arctic Home Page – https://www7320.nrlssc.navy.mil/GLBhycomcice1-12/
National Snow and Ice Data Center (NSIDC)
Home Page – https://nsidc.org/
Sea Ice Index – https://nsidc.org/data/seaice_index/
Arctic Sea Ice News & Analysis – https://nsidc.org/arcticseaicenews/
Charctic Interactive Graph – https://nsidc.org/arcticseaicenews/charctic-interactive-sea-ice-graph/
Northern Hemisphere Sea Ice Extent Data – https://noaadata.apps.nsidc.org/NOAA/G02135/north/daily/data/
Southern Hemisphere Sea Ice Extent Data – https://noaadata.apps.nsidc.org/NOAA/G02135/south/daily/data/
University of Bremen
Home Page – https://www.iup.uni-bremen.de/eng/
Sea Ice Concentration Page – https://seaice.uni-bremen.de/sea-ice-concentration/
Thin Ice Thickness – https://seaice.uni-bremen.de/thin-ice-thickness/
JAXA – Japan Aerospace Exploration Agency / National Institute of Polar Research (NIPR)
VISHOP Sea Ice Extent Viewer – https://ads.nipr.ac.jp/vishop/#/extent
NASA – Worldview / GIBS
Arctic Imagery – https://worldview.earthdata.nasa.gov/?p=arctic
National Oceanic & Atmospheric Administration (NOAA) – National Centers for Environmental Information (NCEI)
Home Page – https://www.ncei.noaa.gov/
National Oceanic & Atmospheric Administration (NOAA) – National Weather Service – Environmental Modeling Center
Home Page – https://polar.ncep.noaa.gov/
Sea Ice Analyses Page – https://polar.ncep.noaa.gov/seaice/Analyses.html
National Oceanic and Atmospheric Administration (NOAA) – National Ice Center
Product Page – https://www.natice.noaa.gov/Main_Products.htm
National Oceanic & Atmospheric Administration (NOAA) Arctic Program
https://arctic.noaa.gov/
NOAA – Physical Sciences Laboratory (PSL) (formerly ESRL)
Home Page – https://psl.noaa.gov/
Products Page – https://psl.noaa.gov/products/
Climate and Weather Data – https://psl.noaa.gov/data/
Maps Room – https://psl.noaa.gov/map/
Nansen Environmental and Remote Sensing Center (NERSC) – Arctic Regional Ocean Observing System (Arctic ROOS)
Home Page – https://web.nersc.no/project/arctic-roos/
OSI-SAF – EUMETSAT Ocean and Sea Ice Satellite Application Facility (formerly Norway Met SAF)
Home Page – https://osi-saf.eumetsat.int/
Sea Ice Products – https://osi-saf.eumetsat.int/products/sea-ice
University of Washington – Polar Science Center – PIOMAS Arctic Sea Ice Volume
https://psc.apl.washington.edu/research/projects/arctic-sea-ice-volume-anomaly/
Polar Portal – Greenland Surface Mass Balance
https://polarportal.dk/en/greenland/surface-conditions/
Environment and Climate Change Canada – Canadian Ice Service
https://www.canada.ca/en/environment-climate-change/services/ice-forecasts-observations/latest-conditions.html