In comments on WUWT, people often think freely and throw out all sorts of ideas. Like in any collection of people, some are bad, some are average, a few are good, and even fewer are noteworthy. However, one that was noteworthy recently was from a WUWT regular known as “hotrod” in the “NASA Deep Solar Minimum” thread.
The thing that has been nagging at me is, that the trace of a rogue wave in this link, looks a lot like the 1998 temperature spike. On thinking about it, if a [rogue] wave is possible in the ocean, is it not conceivable that the same sort of behavior could exist in an average temperature plot for a body like the earth, as it oscillates around an average temperature? This like the PDO and AMO are just different types of periodic motion.
He was referring to what has now become known as the Draupner Wave, named for the oil platform that recorded it on January 1st, 1995.
In the case of the Draupner Wave, it has an amplitude about 3x that of the average background wave amplitude. It was created when the amplitudes of some waves of dissimilar amplitude and period combined in sync to form a new wave peak for an instant. That instant passed and the sea went back to normal background amplitude.
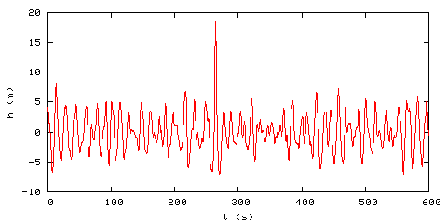
In the case of the 1998 Super El Niño, there is a similar sort of event where the temperature peak is about 3x that of the background peaks. This plot of the RSS Global Temperature Anomaly below (done by Barry Wise) shows the 1998 super event in red:

Barry writes:
The 1997/98 El Niño temperature spike seems to have had a long lasting effect that is dissipating. This graph shows what the trend was before the event and how the trend was affected by it. The dashed red line is the trend with all of the data and the purple is the trend based on the data before the area highlighted in red. Notice that there appears to be a decaying oscillation. If correct we’re in the third peak which is less than the previous two, and is much closer to the purple trend line.
[Note: I should point out that Barry’s method creates a different result than if the 97/98 El Nino data is removed, and before and after trend lines are plotted (h/t to Tom P) the resultant effect of the 1998 Super El Niño is less apparent. See comments for more discussion.]
Certainly there appears some similarity between the Draupner Wave and the 1998 Super El Niño worldwide temperature spike. And certainly we have a number of periodic systems and forcings going on here on Earth that are sinusoidal by their nature. They span short (high frequency) and long (low frequency) periods. Here are a few that I’ve thought of, short and long, but by no means is it a complete list.
Diurnal solar insolation and temperature variation, daily and monthly lunar tide cycles, seasonal variation of solar insolation by hemisphere, seasonal variation of temperatures by hemisphere, seasonal biomass variations, seasonal sea ice variations, seasonal albedo variations, 11 and 22 year solar cycles, Earth’s length of day variations, El Nino Southern Oscillation, North Atlantic Oscillation, Pacific Decadal Oscillation, Atlantic Multidecadal Oscillation, and at very long periods, Milankovitch cycles.
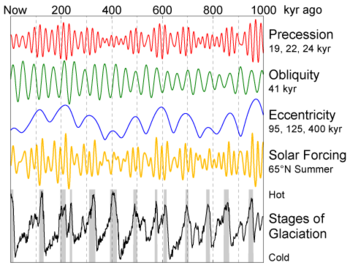
There are many many cycles on earth that are known, some yet to be discovered. Almost all of them have a root cause in periodic circular motions such as planetary rotation and orbital motion in our solar system and the variances of orbital eccentricity, obliquity, and precession. For example, the graph below shows how these different waves eventually synchronize to cause cycles of ice ages on earth.
To illustrate how sinusoidal cycles can conspire to produce peaks and valleys in amplitude, this interactive Java sinusoidal generator allows you to combine three different waves of varying phase, amplitude, and wavelength and see the resultant wave that forms from them:

During my limited experimentation above I couldn’t get the generator to produce a Draupner type wave, but as you can see in the screencap above, I was able to illustrate how a new peak can be generated (in blue) that is larger than any of the source wave peaks.
Here is an example of how “wave focusing” can occur to produce a Draupner type peak:

Lest you think this essay is about childs play with sinusoids, I’ll point out that there have been some serious works done on the mathematics behind the creation of “rogue waves”. For example there’s this brief discussion from the link commenter “hotrod” originally provided:
BBC Two, on November 14, 2002, aired a program on this phenomenon and its recent mathematical analysis. Freak waves, also “rogue waves,” “monster waves,” are extraordinarily tall and steep waves that appear sporadically and wreck havoc with shipping. One is suspected to have washed away the German cargo München which went down with all hands in the midst of a routine voyage in 1978. More recently, the cruise ship Caledonian Star was struck by a 30m wave on March 2, 2001. The standard analysis of ocean waves predicts a Gaussian-like distribution of heights; extreme heights, although possible, should be very rare – a 30m wave is expected once in ten thousand years, according to the BBC. But these waves occur much more frequently than predicted. The program focused on new methods of analysis, and on the work of the mathematician A. R. Osborne (Fisica Generale, Torino). Osborne has applied the inverse scattering transform, which he describes as “nonlinear Fourier analysis,” to the time series analysis of wave data. He conducted simulations using the nonlinear Schrödinger equation and found near agreement with the standard analysis, except that “every once in a while a large rogue wave rises up out of the random background noise.” His paper, available online, gives an example of such a simulation:

From CIM Bulletin #14 at http://at.yorku.ca/i/a/a/h/51.htm
Here’s a paper (PDF) on the Draupner wave titled: THE SHAPE OF THE DRAUPNER WAVE OF 1STJANUARY 1995 from Paul Taylor, Department of Engineering Science, University of Oxford. Taylor did a mathematiucal analysis of the Draupner wave, created a model to approximate the formation of it, and concluded that: “The New Year wave is ~ 1 in 2×10^5 waves” which when you think about it, makes it fairly common especially when you view it in context to images like the one below:

So it seems that such amplified rogue waves are fairly common in the nature of our oceans. That’s quite a journey from them one time being considered “mystical” by science.
Another scientific paper (PDF) of interest is: Physical Mechanisms of the Rogue Wave Phenomenon by Christian Kharif and Efim Pelinovsky of IRPHE in France and the Institute of Applied Physics in Russia, respectively. They conclude (emphasis mine):
All the physical scenarios of possible extreme wave generation (focusing, wave-current interaction, modulational instability), in fact, were known but only now (during the last 5 years) they are “dressed” by mathematical models of various levels (linear, weakly nonlinear, fully nonlinear models). Results of numerical simulations show the behaviour of each mechanism taking into account the random character of the wind waves in the ocean. Computations provide also the probability of rogue wave occurrence for simplified conditions. The many results are very sensitive to the model parameters (shape of wave spectrum, various corrections of the weakly nonlinear evolution models, accuracy of numerical schemes for long49 time computations).
Given that rogue waves were once thought to be the fantasy of imaginative sailors and fishermen, and given that science has now only addressed the problem once one was measured in 1995, it illustrates how something once thought to be impossible is now possible once it is measured, better understood, and studies published about it.
By the same logic, things like the Pacific Decadal Oscillation weren’t discovered until fairly recently. The PDO was named by Steven R. Hare, of the University of Washington, who noticed it while studying salmon production patterns (See BAMS article, PDF). Almost simultaneously the PDO climate pattern was also found by Yuan Zhang. This happened in 1997. It is one more natural cycle added to the many that were already known such as the El Niño-Southern Oscillation (ENSO) and the North Atlantic Oscillation (NAO)
Perhaps it is not an unreasonable to consider that on occasion, some of these cycles conspire to produce extreme ocean events like the 1998 Super El Niño.

And, given the difficulty in predicting exactly when natural cycles might coincide to produce such an event, perhaps this is why they are so hard to predict. For example, there was Dr. James Hansen’s 2006 prediction about a “super El Niño” that would rival the 1983 and 1997-1998 El Niño events.
In March 2006, Hansen wrote a paper claiming the following:
We suggest that an El Niño is likely to originate in 2006 and that there is a good chance it will be a “super El Niño”, rivaling the 1983 and 1997-1998 El Niños, which were successively labeled the “El Niño of the century” as they were of unprecedented strength in the previous 100 years.
We all know now that prediction was a bust. While there was in fact a 2006-2007 El Niño event. In the words of climatologist Mike McPhadden the event:
“started late, ended early and was below average strength”
Hansen’s prediction of a “super” event “rivaling the 1983 and 1997-1998 El Niños” never came true. Undeterred, Hansen is still predicting the onset of an El Niño event that will drive global temperatures to a new record high in 2009 or 2010. (h/t to Roger Pielke Jr on Prometheus)
Perhaps the applications of the studies of rogue ocean waves might be useful in figuring out if the 1998 event was in fact a synchronicity of natural cycles, linear, non-linear, and chaotic for a brief time, and if so, applied towards forecasting future super El Niño and La Niña events. I think it is worth considering. – Anthony
In all things there is a law of cycles.– Publius Cornelius Tacitus (55-117) Roman historian.
“This is why I’m done. We just don’t have a common basis in functional written communications. You wore out Barry also, he just gave up rather than continue. That’s where I’m at, so, no more on this issue. We disagree, we don’t communicate well, and I suggest just leaving it at that, unless you are one of those that relish an “xkcd” moment. Even if you are, I’m not going to waste any more time or posts on it. Sorry, I’m just worn out.”
Methinks you should have dropped it much sooner: people with long enough experience in Blogs (like you) should be able to recognize a troll when you see it.
hotrod (18:48:27) :
> When I lose my car keys, I look in all the obvious places they are supposed to be.
I’ve observed that I almost always find my keys in the last place I look for them. So far, I haven’t been able to create a useful search algorithm from that observation.
N.B. “Almost always?” I’m a software engineer – we hardly ever speak in absolutes, having seen far too many impossible things happen. We suspect the computers are laughing at us when we aren’t paying attention.
I have also noticed that I rarely keep looking for something after I find it — although there are some exceptions (depending on your definition of “found” ) Like when I am looking for my glasses while I have them in my hand.
But those seem to be transient events that do not repeat often.
; )
Larry
Frederick,
I believe this is supposed to be a science blog, and one that would like to cultivate a sceptical outlook. It seems somewhat ironic that my challenge on a point of science, namely the physical basis for an El-Niño-induced temperature shift, makes me a troll in your eyes.
I’d much rather have come away with a response on the science, but that doesn’t seem to be what you’re offering.
I where browsing data of global cloud cover when I found this site:
http://www.bbso.njit.edu/science_may28.html
There seems to have been a very rapid decrease in cloud cover ending in 1997, the year when the super El Nino started. Could this dramatic change in forcing 3 years before have played a major role in causing the 97/98 El Nino event?
I also notice the low albedo 1997-2002 is follwed by a step raise in global temperatures during this period.
The diagram ends in 2004 with fast raising albedo and we are now seeing dropping temperatures.
So how much could this change in albedo have affected global temperatures?
If Svensmark is correct we will see a fast increasing Albedo that will set an all time high in the comming years since the cosmic radiation allready is setting new records several times per year since a few years.
Jerker Andersson (10:00:28) :
So how much could this change in albedo have affected global temperatures?
A lot.
Play with the toy model at http://junkscience.com/Greenhouse/Earth_temp.html.
A change in albedo from .3 to .31 changes global temperature by 1C.
I used it to translate the albedo curve you linked to , into a temperature curve, and it fits the trend of the temperature, but not very well the magnitudes, as one would expect from a toy model with so few parameters to fiddle.
Regarding Tom P (09:23:44)
Tom has scored a point here: “I’d much rather have come away with a response on the science, but that doesn’t seem to be what you’re offering.”
That doesn’t mean I found Tom’s earlier arguments convincing.
Dissonant bait & consuming tangents – just a matter of sensible strategy to ignore.
– – – –
Re: tallbloke (21:50:19)
The reason I am not elaborating can found by any reader of this thread in Anthony’s reply to Carsten Arnholm, Norway (14:32:35).
I should have thanked you for your invitation to join the other forum (which Leif Svalgaard describes as a “pen”, “sandbox”, &/or “litter box”), but I must decline.
I am reminded of a supervisor’s wise words, from back when I was guiding in the mountains: “Pace, pace, pace.”
I am also reminded of the wise words of an immediate superior I had while running online courses: “Just introduce a little new each time.” …And she was talking about the politics of influencing the system, not the teaching.
As I suggested above: Lucy was right.
Peace – & patience.
– – – – – – – – – – – – –
Rogue Finance / Climate Parallels
I noticed Chris’s comment on Don B’s post. I read the article too. Here is what I picked out of it:
=
“Such measures of future uncertainty satisfy our ingrained desire to “simplify” by squeezing into one single number matters that are too rich to be described by it. In addition, they cater to psychological biases and our tendency to understate uncertainty in order to provide an illusion of understanding the world.”
“The traditional Gaussian way of looking at the world begins by focusing on the ordinary, and then deals with exceptions or so-called outliers as ancillaries. But there is also a second way, which takes the exceptional as a starting point and deals with the ordinary in a subordinate manner – simply because that “ordinary” is less consequential.”
“Despite the shortcomings of the bell curve, reliance on it is accelerating, and widening the gap between reality and standard tools of measurement. The consensus seems to be that any number is better than no number – even if it is wrong.”
“[…] a methodology where large deviation and stressful events dominate the analysis instead of the other way around.”
=
Engineers are concerned with extreme events, for obvious reasons. Economists now appear to (possibly) be learning a lesson about structural failure.
All camps should be listening to what the ecologists & physical geographers have been saying about emergent & scale-dependent properties. (For whatever reason, the statisticians do not seem concerned about assessing the variation of parameter estimates as a function of measurement scale. Why ignore that rich information?…)
I am becoming increasingly curious to know exactly what assumptions go into climate models. I am particularly curious to know which assumptions are introduced simply for mathematical convenience, as I see unquestioned acceptance of such assumptions as a potentially very dangerous development in our cultural evolution that could have (arguably is having) significant ramifications (particularly when assumptions are considered collectively in an integrated sense) for the nature of our society & civilization.
If we are entering the era of cold calculation, where calculations govern all decisions, we might be wise to base our assumptions on something other than ‘mathematical convenience’. (This might even have the practical effect of reducing our reliance on untenable assumptions.)
Once again: Thanks Don B.:
http://www.ft.com/cms/s/2/5372968a-ba82-11da-980d-0000779e2340,dwp_uuid=77a9a0e8-b442-11da-bd61-0000779e2340.html
…& Richard Heg:
http://en.wikipedia.org/wiki/File:IE_Real_SandP_Prices,_Earnings,_and_Dividends_1871-2006.png
– – – – – – – –
Jerker Andersson (10:00:28) – “If Svensmark is correct […]”
Even if Svensmark isn’t correct, this is very important (& a lot Svensmark-haters seem to overlook this in their seemingly-contented belief that Svensmark has been “debunked”.)
Assumptions of uniformity should (generally) rouse suspicions since spatiotemporal heterogeneity exists and cannot always be tenably dismissed as “irrelevant”.
It is assumptions, rather than conclusions, that draw the strategic fire.
[Think of the conclusions as a decoy.]
– – – –
This discussion is starting to recover nicely from the tangents that briefly threatened to derail it – thanks to all.
Y.H. Zhou, D.W. Zheng, & X.H. Liao (2001). Wavelet analysis of interannual LOD, AAM, and ENSO: 1997-98 El Nino and 1998-99 La Nina signals. Journal of Geodesy 75, 164-168.
Highlights from this paper:
Figure 1 makes it dead-simple to understand how dLOD is isolated from LOD.
Figure 2 shows dLOD, AAM, & MSOI roughly covarying.
Figure 3 (which looks sort-of like a rogue wave) gives a visual of the following:
Near-zero-lag cross-correlations – significant at 99% level:
dLOD with AAM: 0.81
dLOD with MSOI: 0.71
AAM with MSOI: 0.61
Zhou, Zheng, & Liao were writing this paper before the 1998-99 La Nina even concluded.
They used wavelet plots (figure 4) to highlight the bimodal timescale-spectra of the 3 time series, commenting as follows:
“It is worth pointing out that a strong El Nino event (e.g. that of 1982-83 or 1997-98) occurs when the high-frequency component and low-frequency component are in phase with positive polarity.”
Some of the best journal articles reduce the complexity to a few simple pictures.
Zhou, Zheng, & Liao sure make it look simple.
Tallbloke wrote “I had a bit more of a think about this. From the point of view of someone on a coast measuring the incoming waves in a mist, they would only see the amplitude of each wave as it was arriving. If they knew about rogue wave theory, they might measure several consecutive deeper then usual troughs and decide it was time to retreat further up the hill.”
Well put, Tallbloke.
Certainly in the case of a tsunami this might even be more apparent.
Regarding the great Dec 26, 2004 disaster, it is well documented that had people been educated simply how to recognize a huge trough that precedes an even bigger wave, perhaps scores of thousands of lives would have been saved.
Understood that tsunamis and rogues are different animals….but still.
We as humans perceive the waves that speed across the dimension of time as ones that occur “all at once” based upon our perspective [such as any average wave on the sea or oven the ephemeral rogues that become monsters that swallow ships whole].
But if we could slow down time [ugh….I just almost quoted Cher] to something on a scale and tempo much more grandiose and largo [to borrow a music term] than our own perspective allows [and even if we are figuring it out by hindcasting], then, in that case, the 1998 spike occurred, effectively, all at once.
Chris
Norfolk, VA
Paul Vaughan wrote: “I am becoming increasingly curious to know exactly what assumptions go into climate models. I am particularly curious to know which assumptions are introduced simply for mathematical convenience, as I see unquestioned acceptance of such assumptions as a potentially very dangerous development in our cultural evolution that could have (arguably is having) significant ramifications (particularly when assumptions are considered collectively in an integrated sense) for the nature of our society & civilization.”
and
“If we are entering the era of cold calculation, where calculations govern all decisions, we might be wise to base our assumptions on something other than ‘mathematical convenience’. (This might even have the practical effect of reducing our reliance on untenable assumptions.)”
Bravo. Money.
In my opinion, mathematics is a chest of tools.
The person who uses the tools is responsible for choosing the correct tools for the job. Confusion in scientific matters, as for example the climate models, arises when wrong mathematical tools are used on a mix of physics systems with confused assumptions. By physics systems I mean, classical thermodynamics, classical statistical physics , quantum statistical physics and quantum physics.
To blame bad results on reliance on mathematics is obscuring the issue, not particularly helpfully. To doubt the use of mathematics for human endeavors is doubting the use of tools.
Anna v wrote “To blame bad results on reliance on mathematics is obscuring the issue, not particularly helpfully. To doubt the use of mathematics for human endeavors is doubting the use of tools.”
I don’t think that is what he was saying at all Anna.
Point well taken though on the invaluable resource of mathematics. Everything is math. Understood.
I will let him interpret his own but the reason I bravoed it was that he was saying that [from a layman’s perspective] scientists need to get out from behind their calculations ocasionally and experience the real world.
On that aspect he is very correct. it is not just “cold calculations”. It is both…observation (okay three), experience, and calculations (okay four) and common sense and (okay five) quantum physics.
I always look for what you have to say and respect the great intellect behind it.
Chris
Norfolk, VA
anna v (20:55:09)
“To blame bad results on reliance on mathematics is obscuring the issue, not particularly helpfully. To doubt the use of mathematics for human endeavors is doubting the use of tools.”
The issue isn’t whether we should be using tools; it’s whether we should be using hammers to sink screws.
anna v (20:55:09)
“The person who uses the tools is responsible for choosing the correct tools for the job.
Perhaps you have identified the problem.
savethesharks (19:46:39) :
But if we could slow down time [ugh….I just almost quoted Cher] to something on a scale and tempo much more grandiose and largo [to borrow a music term] than our own perspective allows [and even if we are figuring it out by hindcasting], then, in that case, the 1998 spike occurred, effectively, all at once.
Hi Chris, we are unable to predict even short term climate because there are so many variables we don’t understand, and we struggle to generate the computing power to work with the ones we do understand. They combine to produce sudden surges like the ’98 peak, but also to create the negative feedbacks which keep the overall system stable.
I agree with your analysis, it’s all happening, the past helps predict the future, though the unexpected can always pop up to disrupt the destined course, e.g. a big volcano or a huge solar storm. In a system as complex as climate, we can’t determine the future at a level which matters to us as humans trying to grow crops, stay warm in winter etc. However we can get some clues about longer term climate by studying the patterns of the past, and this thread has been valuable in pushing us to grapple with our understanding and limited viewpoints.
Cheers
Anthony,
Thanks for the email – here goes a second time:
The issue I’m bringing up goes right back to the original article where after it is first proposed that the the 8/89 Super El Niño event might be a likened to a rogue wave, which by definition is a transient, isolated phenomenon, Barry White contradicts this by fitting a trend which implies the effects of that El Niño are still being felt. It is Barry also who first postulated in a later comment that part of that long-term effect was a step change in temperature in 2001.
The crux of the matter comes down as to how to view the RSS data: if a simple linear trend is fitted to the data:
http://img9.imageshack.us/img9/32/rssdata.png
the El Niño does indeed stick out like a sore thumb, similar to the 1876-8 Super El Niño. Interestingly, the temperature excursion does suggest troughs below trend on either side which are rather reminiscent of a Draupner-like wave. There are other excursions, both before and after the event, of which the rise in temperature in 2001 is most certainly not the most notable. Of course the there needs to be an explanation as to why there is a steady increase in the energy of the system, as implied by the trend 0.15degC/year, but explanations grounded in physics have been offered here.
The alternative view that Barry proposed is that the El Niño has so disturbed the subsequent behaviour that the trend should be fitted just to the prior data (see the plot in the article itself). This is not consistent with likening the event to a rogue wave – it is no longer transient or isolated. The background trend is of course much lower while the El Niño is then seen to inject a good deal of energy into the system after 2001. Such a step change is not seen after previous 1876-8 Super El Niño or after other later El Niños. The burden of an explanation shifts from the cause of what is now a much lower background slope, to how an energy considerably greater that the original El Niño thermal spike has been retained and re-expressed in the temperature record. Any explanation of the underlying physics also has to embrace why such a thermal response has not been seen before.
In the absence of such an explanation, analysing the RSS time series as steadily increasing noisy background signal with an isolated very large event in 1997/8 appears to be the more scientifically and historically justified viewpoint. It is also not inconsistent with the intriguing possibility that the 1997/8 Super El Niño could be likened to a rogue wave.
Apologies – that should be Barry Wise, not White!
Tom P wrote “Apologies – that should be Barry Wise, not White!”
Ha! I am almost quoting Cher [Ugh]. You are almost quoting Barry White.
Now Cher or Barry White I am not gonna listen to, but Barry Wise on the other hand….
Thanks for parsing out the info above. Good post.
Chris
Norfolk, VA
Wow! Briefly OT….I am typing this looking at the Atlantic in the AM and I about blinded myself because the sun reflecting on the water was so intense.
Reminds me of multiple things: energy reflection, refraction, and absorption, the ocean and the SUN…..
Could not help thinking about the big spike in the solar cycle around almost 50 years ago in Archibald’s recent thread….and I wondered if that anomaly [while not as impressive or even a “rogue wave” for lack of a better term], I wondered if some of the “energy” in that big wave, borrowed energy from either wave on either side.
And, given the lag times of up to a century for solar forcing to affect earth’s weather…[forgive me here if I am way off]…is there any connection between the solar spike mentioned and the 1998 earth temp spike?
Regardless if that is hard to prove it goes to show that, most likely, the two biggest competing big-boy drivers of earth’s climate seem to be the ocean, and the sun, in that order (with Svensmark theories coming in third….and this one related directly to solar forcing).
Am I on the right track??
Chris
Norfolk, VA
savethesharks,
“Thanks for parsing out the info above. Good post.”
I appreciate the comment. It is rather amusing that my very same analysis met with a completely different response from you a couple of days ago… I think this shows how easy it is to lose focus on an argument distributed through a thread.
The implications of what I’m saying are still clear, I hope, and can certainly be regarded as a challenge to the viewpoint of the majority of contributors to this blog. But a bit more contention would probably improve the health of many of the threads and prevent complete embarrassments such as the recent discussion on the effect of cosmic rays on the ozone hole dragging so many people into the mire:
http://wattsupwiththat.com/2009/03/26/galactic-cosmic-rays-may-be-responsible-for-the-antarctic-ozone-hole/
Comment on Tom P (09:01:36)
I agree that challenge is healthy for raising the bar, particularly any that is incising in its precision – but we haven’t seen anything in this thread that can slice the rogue metaphor.
If you looked at my paper on satellite data you know that this “El Nino that should not be there” is out of the normal ENSO sequence. I could not explain its energy source and for a time thought it had to be cosmogenic but I have changed my mind: it came from another ocean. Specifically, I regard it as Indian Ocean overflow. I regard the ENSO itself as a giant wave sloshing back and forth in a bowl we call the Pacific Ocean. The wave frequency, about four or five years between peaks, is determined by the dimansions of the ocean itself, and the energy of motion comes from trade winds that create the north and south equatorial currents. In between these two currents is the equatorial countercurrent that brings back the water trade winds have driven west, The turnaround point of these equatorial currents is near the Philippines and New Guinea which block their entrance into the Indian Ocean. If you look at the satellite radar altimetry map of sea surface anomalies you will see that the water surfacein that area is high – piled up by equatorial currents – and ready to start flowing back by gravity to bring us our next El Nino. But between New Gunea and Borneo there is an island-studied connection between the two oceans – the Indonesian passage. I hypothesize that due to unusual conditions prevailing a couple of years before 1998 El Nino, possibly caused by typhoons, monsoons, etc. sea surface rose high enough in that area to cause an overflow into the Pacific Ocean. Once in the Pacific it would be just where the equatorial coiuntercurrent starts and would naturally follow it since its surface is lower than that of the equatorial currents flanking it. And once it arrived at the eastern shore it would be indistinguishable from an El Nino except for its peak height, which was twice as high. If this sounds fantastic consider that Hurricane Katrina was accompanied by a storm surge of 25 feet and that the world record storm surge of 43 feet was recorded in northern Australia, near New Guinea, in 1899. I wrote this up with illustrations in my revised paper dated May 25th and gave it to Joe D’Aleo of ICECAP. It may take him a while to put it up but keep looking for it.