In comments on WUWT, people often think freely and throw out all sorts of ideas. Like in any collection of people, some are bad, some are average, a few are good, and even fewer are noteworthy. However, one that was noteworthy recently was from a WUWT regular known as “hotrod” in the “NASA Deep Solar Minimum” thread.
The thing that has been nagging at me is, that the trace of a rogue wave in this link, looks a lot like the 1998 temperature spike. On thinking about it, if a [rogue] wave is possible in the ocean, is it not conceivable that the same sort of behavior could exist in an average temperature plot for a body like the earth, as it oscillates around an average temperature? This like the PDO and AMO are just different types of periodic motion.
He was referring to what has now become known as the Draupner Wave, named for the oil platform that recorded it on January 1st, 1995.
In the case of the Draupner Wave, it has an amplitude about 3x that of the average background wave amplitude. It was created when the amplitudes of some waves of dissimilar amplitude and period combined in sync to form a new wave peak for an instant. That instant passed and the sea went back to normal background amplitude.
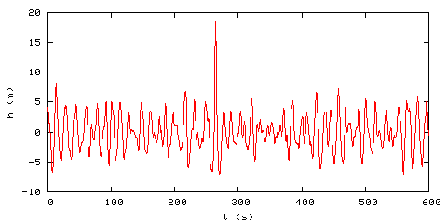
In the case of the 1998 Super El Niño, there is a similar sort of event where the temperature peak is about 3x that of the background peaks. This plot of the RSS Global Temperature Anomaly below (done by Barry Wise) shows the 1998 super event in red:

Barry writes:
The 1997/98 El Niño temperature spike seems to have had a long lasting effect that is dissipating. This graph shows what the trend was before the event and how the trend was affected by it. The dashed red line is the trend with all of the data and the purple is the trend based on the data before the area highlighted in red. Notice that there appears to be a decaying oscillation. If correct we’re in the third peak which is less than the previous two, and is much closer to the purple trend line.
[Note: I should point out that Barry’s method creates a different result than if the 97/98 El Nino data is removed, and before and after trend lines are plotted (h/t to Tom P) the resultant effect of the 1998 Super El Niño is less apparent. See comments for more discussion.]
Certainly there appears some similarity between the Draupner Wave and the 1998 Super El Niño worldwide temperature spike. And certainly we have a number of periodic systems and forcings going on here on Earth that are sinusoidal by their nature. They span short (high frequency) and long (low frequency) periods. Here are a few that I’ve thought of, short and long, but by no means is it a complete list.
Diurnal solar insolation and temperature variation, daily and monthly lunar tide cycles, seasonal variation of solar insolation by hemisphere, seasonal variation of temperatures by hemisphere, seasonal biomass variations, seasonal sea ice variations, seasonal albedo variations, 11 and 22 year solar cycles, Earth’s length of day variations, El Nino Southern Oscillation, North Atlantic Oscillation, Pacific Decadal Oscillation, Atlantic Multidecadal Oscillation, and at very long periods, Milankovitch cycles.
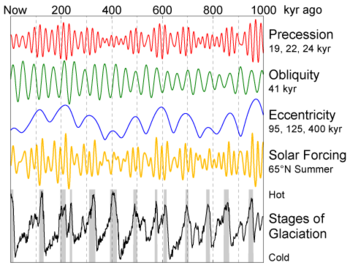
There are many many cycles on earth that are known, some yet to be discovered. Almost all of them have a root cause in periodic circular motions such as planetary rotation and orbital motion in our solar system and the variances of orbital eccentricity, obliquity, and precession. For example, the graph below shows how these different waves eventually synchronize to cause cycles of ice ages on earth.
To illustrate how sinusoidal cycles can conspire to produce peaks and valleys in amplitude, this interactive Java sinusoidal generator allows you to combine three different waves of varying phase, amplitude, and wavelength and see the resultant wave that forms from them:

During my limited experimentation above I couldn’t get the generator to produce a Draupner type wave, but as you can see in the screencap above, I was able to illustrate how a new peak can be generated (in blue) that is larger than any of the source wave peaks.
Here is an example of how “wave focusing” can occur to produce a Draupner type peak:

Lest you think this essay is about childs play with sinusoids, I’ll point out that there have been some serious works done on the mathematics behind the creation of “rogue waves”. For example there’s this brief discussion from the link commenter “hotrod” originally provided:
BBC Two, on November 14, 2002, aired a program on this phenomenon and its recent mathematical analysis. Freak waves, also “rogue waves,” “monster waves,” are extraordinarily tall and steep waves that appear sporadically and wreck havoc with shipping. One is suspected to have washed away the German cargo München which went down with all hands in the midst of a routine voyage in 1978. More recently, the cruise ship Caledonian Star was struck by a 30m wave on March 2, 2001. The standard analysis of ocean waves predicts a Gaussian-like distribution of heights; extreme heights, although possible, should be very rare – a 30m wave is expected once in ten thousand years, according to the BBC. But these waves occur much more frequently than predicted. The program focused on new methods of analysis, and on the work of the mathematician A. R. Osborne (Fisica Generale, Torino). Osborne has applied the inverse scattering transform, which he describes as “nonlinear Fourier analysis,” to the time series analysis of wave data. He conducted simulations using the nonlinear Schrödinger equation and found near agreement with the standard analysis, except that “every once in a while a large rogue wave rises up out of the random background noise.” His paper, available online, gives an example of such a simulation:

From CIM Bulletin #14 at http://at.yorku.ca/i/a/a/h/51.htm
Here’s a paper (PDF) on the Draupner wave titled: THE SHAPE OF THE DRAUPNER WAVE OF 1STJANUARY 1995 from Paul Taylor, Department of Engineering Science, University of Oxford. Taylor did a mathematiucal analysis of the Draupner wave, created a model to approximate the formation of it, and concluded that: “The New Year wave is ~ 1 in 2×10^5 waves” which when you think about it, makes it fairly common especially when you view it in context to images like the one below:

So it seems that such amplified rogue waves are fairly common in the nature of our oceans. That’s quite a journey from them one time being considered “mystical” by science.
Another scientific paper (PDF) of interest is: Physical Mechanisms of the Rogue Wave Phenomenon by Christian Kharif and Efim Pelinovsky of IRPHE in France and the Institute of Applied Physics in Russia, respectively. They conclude (emphasis mine):
All the physical scenarios of possible extreme wave generation (focusing, wave-current interaction, modulational instability), in fact, were known but only now (during the last 5 years) they are “dressed” by mathematical models of various levels (linear, weakly nonlinear, fully nonlinear models). Results of numerical simulations show the behaviour of each mechanism taking into account the random character of the wind waves in the ocean. Computations provide also the probability of rogue wave occurrence for simplified conditions. The many results are very sensitive to the model parameters (shape of wave spectrum, various corrections of the weakly nonlinear evolution models, accuracy of numerical schemes for long49 time computations).
Given that rogue waves were once thought to be the fantasy of imaginative sailors and fishermen, and given that science has now only addressed the problem once one was measured in 1995, it illustrates how something once thought to be impossible is now possible once it is measured, better understood, and studies published about it.
By the same logic, things like the Pacific Decadal Oscillation weren’t discovered until fairly recently. The PDO was named by Steven R. Hare, of the University of Washington, who noticed it while studying salmon production patterns (See BAMS article, PDF). Almost simultaneously the PDO climate pattern was also found by Yuan Zhang. This happened in 1997. It is one more natural cycle added to the many that were already known such as the El Niño-Southern Oscillation (ENSO) and the North Atlantic Oscillation (NAO)
Perhaps it is not an unreasonable to consider that on occasion, some of these cycles conspire to produce extreme ocean events like the 1998 Super El Niño.

And, given the difficulty in predicting exactly when natural cycles might coincide to produce such an event, perhaps this is why they are so hard to predict. For example, there was Dr. James Hansen’s 2006 prediction about a “super El Niño” that would rival the 1983 and 1997-1998 El Niño events.
In March 2006, Hansen wrote a paper claiming the following:
We suggest that an El Niño is likely to originate in 2006 and that there is a good chance it will be a “super El Niño”, rivaling the 1983 and 1997-1998 El Niños, which were successively labeled the “El Niño of the century” as they were of unprecedented strength in the previous 100 years.
We all know now that prediction was a bust. While there was in fact a 2006-2007 El Niño event. In the words of climatologist Mike McPhadden the event:
“started late, ended early and was below average strength”
Hansen’s prediction of a “super” event “rivaling the 1983 and 1997-1998 El Niños” never came true. Undeterred, Hansen is still predicting the onset of an El Niño event that will drive global temperatures to a new record high in 2009 or 2010. (h/t to Roger Pielke Jr on Prometheus)
Perhaps the applications of the studies of rogue ocean waves might be useful in figuring out if the 1998 event was in fact a synchronicity of natural cycles, linear, non-linear, and chaotic for a brief time, and if so, applied towards forecasting future super El Niño and La Niña events. I think it is worth considering. – Anthony
In all things there is a law of cycles.– Publius Cornelius Tacitus (55-117) Roman historian.
O.T. (Sorry Anthony, but hopefully it’ll keep the topic which will not be named out of your way)
Paul, a place for our ongoing discussion:
http://solarcycle24com.proboards.com/index.cgi?action=display&board=general&thread=568&page=1
“Wow many thanks Anthony for the continued free-speech approach to scientific inquiry. The freak wave idea is a good one.
And thanks Hotrod”
Second!
You can use a similar argument to yours, claiming the step is just noise. I can claim the lack of obvious effect previously is just noise. No proof either way.
You arguments are based on the accepted theory that the increase in linear with noise. Fine. I pointed out something and gave a conjecture which I will freely admit is of low probability. Look at the Hadley data and you’ll see a downturn 60 and 120 years ago. I expect the same now.
BarryW,
(following day now, overly late 😉
This is an attempt at an overlay. It needs someone to do a lot of detail work on fine grain data to better extract how things move.
http://www.gpsl.net/climate/data/1998-nino-timerelation-2009-04-06a.png
Does it mean anything? The call is with the viewer and the data looks different dependent on how it is low pass filtered. The window I’ve used is I hope most suitable for bringing out what I am trying to show, not that it has a huge effect over other windows.
If the opinion is there is no relationship that is fine, I’m just pondering.
Jason data is different y axis
usual data sources, month for msu, jason on the strange 30-ish per year
Barry,
“You can use a similar argument to yours, claiming the step is just noise. I can claim the lack of obvious effect previously is just noise. No proof either way.”
I can’t even see candidate step changes from historical El Niños buried in the noise. Most importantly, there is no known physical basis for such a step change in temperature.
“I pointed out something and gave a conjecture which I will freely admit is of low probability.”
Both low probability, self contradictory and inconsistent with the data, I’m afraid. If you compare the RSS data against the linear trend the most divergent episodes, outside of that El Niño, are repeated cooling excursions including the latest one from which we may possibly just be emerging. Any step change in 2001 is a much smaller divergence from the trend:
http://img9.imageshack.us/img9/32/rssdata.png
“You arguments are based on the accepted theory that the increase i[s] linear with noise. Fine.”
Indeed. And nothing in this thread represents a scientifically or statistically based challenge to such an analysis.
Anthony,
“To imply that just because [a step change] hasn’t been seen a second time in that 30 years worth of data is to ignore the fact that nature seldom reacts conveniently to our expectations.”
I went back to 150 years of HadCRUT data to look for El-Niño-induced steps, not just the 40 years of satellite data- there’s just no clear sign of them in the time series. There’s also no sound physical explantation for such a one-off step change and our very existence indicates such undissipated injections of energy cannot have regularly occurred. Such a step hasn’t been seen a second time – in fact there hasn’t been a single clear signature!
“Your logic then of only seeing such a step once would be to deny the existence of rogue waves because it was only measured once at the Draupen oil platform?”
In comparison the Draupen rogue wave has an exceptionally clear signal, with the distinctive characteristics of a high amplitude, short duration and zero integrated amplitude. It also has a number of possible explanations which have a sound physical basis.
The Draupen rogue wave has clear observational and scientific foundations. Supposed El-Niño-induced step changes in temperature have neither.
Great article and comments.
For the financial geeks (but perhaps with relevance here): Every few years a “once in a thousand year” event occurs in the financial markets. The problem is trying to force distribution of events under a Gaussian distribution, the bell shaped curve, as if extreme events were outliers rather than all too frequent happenings. Part of the reason for the current financial havoc is because risk analysis was done by people who could do complicated mathematics, but couldn’t think. Mandelbrot and Taleb wrote this 2006 piece for the Financial Times, apparently trying to warn of the current mess, but few took heed.
http://www.ft.com/cms/s/2/5372968a-ba82-11da-980d-0000779e2340,dwp_uuid=77a9a0e8-b442-11da-bd61-0000779e2340.html
Thanks for taking us outside the box, or outside the bell curve.
In response to Don B (10:52:45)
You point out what some regard as a threat to civilization. I do not dismiss claims that it could lead to the loss of enlightenment.
– – – – –
Tom P,
Since you are looking at this technically, I can understand why you might feel the masses are being misled, but how does an expert communicate succinctly to a largely lay-audience?
The power is in the metaphor.
It produces a starting point for discussion – you are contributing by aggressively fine-tuning.
One thing I think you may have overlooked is that the musings about a ‘step’ are inspired by some degree of knowledge of state-changes in systems theory.
For those following along, this is sort of like how ‘normal’ bumps to a bowl containing a ball don’t cause the ball to fly out of the bowl, but a big bump can — and there may be other bowls (i.e. other states) in which the ‘system’ can ‘land’.
Population geneticists speak of ‘genetic landscapes’, for example. Equilibrium dynamics can shift to a new order when the ‘ball’ gets flung over a hill into another valley (since the disturbance is so big the ball can’t just roll back down into its ‘usual’ valley).
Due to their nonlinear nature, state changes aren’t necessarily easy to predict if a system is not known inside-out — and as anna v has wisely pointed out in a recent ‘Watts Up?’ thread, we’re a little short on replication.
I’m not saying ‘who’s right’ & ‘who’s wrong’ on this theme, but the exchange did cause me to review Anthony’s first sentence in the article, which includes, “[…] on WUWT, people often think freely and throw out all sorts of ideas”.
Lucy was right:
New ideas at a pace people can handle?
(with a little restraint)
Thanks hotrod.
tallbloke (03:52:04)
http://solarcycle24com.proboards.com/index.cgi?action=display&board=general&thread=568&page=1
I won’t be joining that discussion.
tallbloke (00:36:38)
http://users.beagle.com.au/geoffsharp/ephemeris-z_axis1874.csv
The gun is firing blanks and the room is full of smoke.
Have wave heights been trending lower since January 1st, 1995 at Draupner?
REPLY to Tom P
While I agree that there’s no other event like 97/98, the fact that you can’t find a similar event in the tiny speck of time that is 150 years in relation to the earths long term processes proves absolutely nothing. The Draupen wave was said to be ~ 1 in 2×10^5 waves or 1 in 200,000. Given the long periods associated with many earthly cycles, an expectation of finding another El Nino of similar amplitude in 150 years is quite a stretch. We don’t know how common they are, but to say because you haven’t seen one in 150 years that the current observed one in 97/98 has no physical basis is pure folly.
I’ll say it again: Nature seldom reacts conveniently to our expectations.
You wrote: “Supposed El-Niño-induced step changes in temperature have neither.”
“Supposed”? OK, now we are at an impasse. I can’t continue since you refuse to believe the 97/98 El Nino and that step in global temperature are related. I may as well argue with my cat.
Since we are at an impasse, I’m done. – Anthony
It take dogged determination to argue with cats and put up with the inevitable hair balls. What fur you do that? 😉
Anthony,
“We don’t know how common they are, but to say because you haven’t seen one in 150 years that the current observed one in 97/98 has no physical basis is pure folly.”
I’ve never said the 97/8 El Niño event had no physical basis – you are misrepresenting me here. Indeed there was an El Niño with an even larger temperature excursion in 1876/8 indicating that such events are rather more common than you suggest.
What I have said is that there is neither statistical evidence (in 2001 or in the last 150 years) nor physical basis for a subsequent El-Niño-induced step change in the temperature. And such a step change cannot be modelled on the same basis as a rogue wave – a step change has neither the transitory nor the zero-mean-amplitude characteristics of the Draupner or any other rogue wave.
If you would like me to believe (I’m a sceptic at heart!) that there is some connection between the 1997/8 thermal spike and a suggested step change in temperature in 2001, perhaps you could offer a mechanism. Otherwise looking at the RSS temperature series against the linear trend shows there were larger temperature swings prior to the 97/8 El Niño than associated with any subsequent step:
http://img9.imageshack.us/img9/32/rssdata.png
REPLY to Ton P: Reading your post now, “…you are misrepresenting me here”, no, its not that. I think what we have here is “failure to communicate”. I’m talking about 97/98 and you are talking about 2001. I’m not claiming any step change in 2001, and “step change” isn’t even in the original article! Now you are talking about how you can’t model rogue waves on step change? Where the hell did I ever suggest that? I never even mentioned modeling on step changes at all! I spend a lot of time trying to figure out why you are inject these things the way you do, and it is tiring to try to get my points across, since you accept none, then claim I’m misrepresenting you, and then add points I’ve never suggested. This is why I’m done. We just don’t have a common basis in functional written communications. You wore out Barry also, he just gave up rather than continue. That’s where I’m at, so, no more on this issue. We disagree, we don’t communicate well, and I suggest just leaving it at that, unless you are one of those that relish an “xkcd” moment. Even if you are, I’m not going to waste any more time or posts on it. Sorry, I’m just worn out. – Anthony
Ric Werme (15:07:04) :
Well, I tried my suggestion and got nice spikes after remembering that I needed to get the tops of all the sinusoids to add up, and that’s nicely down with a 270 degree phase angle. (The 0 degree phase angle gives a saw tooth pattern.)
Then I noticed there was too much of the high frequency, and I found that reducing the amplitude of the harmonics let me create just the spikes. Either my memory is fuzzy or three curves aren’t enough, or I’m really modeling a pulse with amplitude 1 and a finite width,
Try http://www.eserc.stonybrook.edu/ProjectJava/WaveInteractionApplet/ with:
Wave 1: 144/40/270 (Wavelength, Amplitude, Phase)
Wave 2: 72/18/270
Wave 3: 48/4/270
The first mention of step change in this thread that I can find is this observation which is just an observation of possibilities with no suggestion of a cause.
My original comment about a “rogue wave” and the origin of this thread had nothing to do with suggesting a step change only the observation that the shape and characteristics of the 1998 temp spike looked remarkably like the non-linear wave seen on the Draupner oil platform which was explainable using the Schrödinger equation.
It has the sharp peak which is significantly higher than would be expected from normal wave models and is also flanked by dips just like the Draupner wave.
I think the question is if the super El-Nino of 1997/98 was generated in the manner implied by the Schrödinger calculations what would be plausible testable mechanisms for it to “steal energy” from the system before and after it.
For that to work there must be some sort of periodic motion buried in the system that it could gather energy from adjacent oscillations. Is there a single oscillation or wave train that is primarily responsible for the strength of the El-Niño cycle or did it need to “steal energy” from 2 or more oscillations.
Since I am not a Phd level Math whiz, can the Schrödinger calculations be “reverse engineered” to give a hint on how this might work or where to look?
If nothing else the mere existence of the Draupner wave points out that there are complex and not intuitively obvious mechanisms out there that we do not understand and like the simple Newtonian models the Maritime engineers used which they “thought” described a well understood process there are surprises out there if we open our eyes to other possibilities.
One of the biggest limitations in engineering and science is simply the belief that a process is possible. I can remember in the 1950’s and 1960’s when engineers and physicists were declaring with authority that a dragster could never exceed 1 G of acceleration because it would require a coefficient of friction greater than 1. They forgot that not all tire friction to asphalt is due to simple sliding friction but some is due to momentary adhesive action between the hot rubber and the pavement and simple mechanical gearing as the rubber physically engaged small imperfections in the surface. Dragsters now pull over 4 G’s of acceleration on launch off the starting line.
Science and engineering is littered with such cases where the simple assumption of impossibility blocked progress and research because clues to other possibilities were over looked or simply tossed out as outliers that could not be real.
We don’t have to “explain everything” in the beginning, but it is useful to at least recognize that there is more than one possible explanation for complex processes and like wave action we may not know as much as we think we do.
As Anthony mentioned in the beginning, many times discoveries start out as educated guesses, what if questions, or even attempts to disprove something. Then like Sherlock Homes when you get done trying to falsify a theory, you end up with some improbable explanation as the only thing left that still fits the actual data.
Then it is time for another round of “what if” to look for other possible ways to explain what current “science” says is impossible but the data says must be possible.
When I lose my car keys, I look in all the obvious places they are supposed to be.
If I still don’t find them, then I need to change my mind set and shift to looking for them in places I have not already looked for them before.
If I still can’t find them, I drop back 20 and punt by changing my mind set again and start looking for them in all the places I “know” they cannot possibly be —- That is usually where I find them!
Larry
The dragster example was great Larry.
Don B wrote: “The problem is trying to force distribution of events under a Gaussian distribution, the bell shaped curve, as if extreme events were outliers rather than all too frequent happenings. Part of the reason for the current financial havoc is because risk analysis was done by people who could do complicated mathematics, but couldn’t think.”
Well put, Don. Thanks.
Chris
Norfolk, VA
hotrod (18:48:27) :
When I lose my car keys, I look in all the obvious places they are supposed to be.
Indeed in the absence of any evidence of an external forcing and its addition function,it is easier to realte to the otherside of the equation its dissipation relationship(subtraction) and the mechanical attributes of the fluctuation dissipation theorem
eg David Ruelle
General linear response formula in statistical mechanics, and the fluctuation-dissipation theorem far from equilibrium
http://dx.doi.org/10.1016/S0375-9601(98)00419-8
Abstract
Given a nonequilibrium steady state varrho we derive formally the linear response formula for the variation of an expectation value at time t under a time-dependent infinitesimal perturbation δτF of the acting forces. This leads to a form of the fluctuation-dissipation theorem valid far from equilibrium: the complex singularities of the susceptibility are in part those of the spectral density, and in part of a different nature to be discussed.
Giovanni Gallavotti
Breakdown and regeneration of time reversal symmetry in nonequilibrium statistical mechanics
http://dx.doi.org/10.1016/S0167-2789(97)00214-5
Abstract
A review and nontechnical exposition of recent studies on the relevance of time reversal, on its spontaneous breakdowns, and on its possible resurgence as a weaker symmetry that still anticommutes with time evolution are given.
Chen et al 2008 part 2 has in the conclusion the following inverse arguments
Hansen et al. (2005) compare observed ocean heat content variations from 1993 to 2003 to the planetary radiative energy imbalance simulated by a global climate model driven by all known external climate forcings and conclude that the upward trend in global ocean heat content is a signature of anthropogenic influences….
Chen et al. (2002) explain observed changes in the planetary radiation balance over 1985–2000 as the result of possible recent strengthening of the Hadley and Walker circulations, which causes subtropical and eastern equatorial Pacific drying and cloud clearing.
Our results therefore appear to be consistent with the conclusion of Chen et al.
(2002) that the observed top-of-atmosphere tropical radiative flux trend over this time is probably due to natural variability rather than external forcing.”
Back to the theory.
NONEQUILIBRIUM STATISTICAL MECHANICS AND ENTROPY PRODUCTION
IN A CLASSICAL INFINITE SYSTEM OF ROTATORS.
by David Ruelle 2006
.
Abstract. We analyze the dynamics of a simple but nontrivial classical Hamiltonian system of infinitely many coupled rotators. We assume that this infinite system is driven out of thermal equilibrium either because energy is injected by an external
force (Case I) , or because heat flows between two thermostats at different temperatures (Case II). We discuss several possible definitions of the entropy production associated with a finite or infinite region, or with a partition of the system into a finite number of pieces. We show that these definitions satisfy the expected
bounds in terms of thermostat temperatures and energy flow.
Returning to the argument
“Perhaps the applications of the studies of rogue ocean waves might be useful in figuring out if the 1998 event was in fact a synchronicity of natural cycles, linear, non-linear, and chaotic for a brief time, and if so, applied towards forecasting future super El Niño and La Niña events. I think it is worth considering.”
First we remove the obvious
Some theory first
A REVIEW OF LINEAR RESPONSE THEORY
FOR GENERAL DIFFERENTIABLE DYNAMICAL SYSTEMS.
by David Ruelle*.2009
Abstract. The classical theory of linear response applies to statistical mechanics close to equilibrium. Away from equilibrium, one may describe the microscopic time evolution by a general differentiable dynamical system, identify nonequilibrium steady states (NESS), and study how these vary under perturbations of the dynamics. Remarkably, it turns out that for uniformly hyperbolic dynamical systems (those satisfying the ”chaotic hypothesis”), the linear response away from equilibrium is very similar to the linear response close to equilibrium: the Kramers-Kronig dispersion relations hold, and the fluctuation dispersion theorem survives in a modified form (which takes into account the oscillations around the ”attractor” corresponding to the NESS). If the chaotic hypothesis does not hold, two new phenomena may arise. The first is a violation of linear response in the sense that the NESS does not depend differentiably on parameters (but this nondifferentiability may be hard to see experimentally).
The second phenomenon is a violation of the dispersion relations: the susceptibility has singularities in the upper half complex plane. These ”acausal” singularities are actually due to ”energy nonconservation”: for a small periodic perturbation of the system, the amplitude of the linear response is arbitrarily large. This means that the NESS of the dynamical system under study is not ”inert” but can give energy to the outside world. An ”active” NESS of this sort is very different from an equilibrium state, and it would be interesting to see what happens for active states to the Gallavotti-Cohen fluctuation theorem.
Now the conjecture,
In the period 95-98 both polar atmospheres were perturbed ie very cold.This led to A)Enhanced ozone loss,and B) Amplified polar vortex.
eg “Air parcels move on isentropic surfaces (surfaces of equal potential temperature) rather than pressure surfaces. The 450 K surface in the south polar area lies between the 70 mb and 50 mb pressure surfaces. This is near the altitude where ozone is in greatest abundance in the vertical profile. This figure shows the size of the polar vortex with respect to previous years. The polar vortex defines the area in which cold polar air is trapped by the very strong winds of the Polar Night Jet. During the winter/spring period, when the polar vortex is strongest, air outside of the vortex can not enter. So, because the warm air from the mid latitudes can not mix with the cold polar air, the polar air continues to get colder due to radiative loss of heat. Also, when ozone in the vortex is depleted, it is not replenished with ozone rich air from outside the vortex. Not until mid to late Spring does the polar vortex weaken and eventually break down. After this, thorough mixing occurs and ozone amounts are replenished. ‘
http://www.cpc.noaa.gov/products/stratosphere/polar/gif_files/vtx_sh_1998.png
So we see retained energy(heat ) due to decreased polar dissipation
Hotrod wrote: “We don’t have to “explain everything” in the beginning, but it is useful to at least recognize that there is more than one possible explanation for complex processes and like wave action we may not know as much as we think we do. As Anthony mentioned in the beginning, many times discoveries start out as educated guesses, what if questions, or even attempts to disprove something. Then like Sherlock Homes when you get done trying to falsify a theory, you end up with some improbable explanation as the only thing left that still fits the actual data.”
Bravo again Hotrod.
Chris
Norfolk, VA
OT
hotrod (18:48:27) :
When I lose my car keys, I look in all the obvious places they are supposed to be.
If I still don’t find them, then I need to change my mind set and shift to looking for them in places I have not already looked for them before.
If I still can’t find them, I drop back 20 and punt by changing my mind set again and start looking for them in all the places I “know” they cannot possibly be —- That is usually where I find them!
Larry
This is out of topic but very very useful: There exists a book on methods of problem solving. The book was written in greek by a 40 year veteran mathematician who tutored for university entrance exams. It has been translated and published in english . The reason I mention it is because it also has a process algorithm for finding missing things, based on its problem solving philosophy.
The algorithm is as follows.
Make a list of what you are looking/scanning for. In the car keys example above the list could be:
metal
shiny
black
round
next to it, negate it.
not metal
not shiny
not black
not round
and start scanning with the negations in mind
It works. It assumes and it seems to be true that the reason we do not find things is a mental loop, we do not see them, as with the solutions of problems.
I will give you an example where it worked for me. I was looking for a felt covered beige phone address book in my office and could not find it anywhere.
so my negated list had
not felt
not beige
not book shape
I found it immediately. It was lying open (white, not felt) face up under some folders, (not book shape,) under my nose.
Here is some info http://www.encyclopedia.com/doc/1G1-195024897.html
The author is Spyros Kalomitsines.
Hey Tom P….stop wearing out the host!
There is a reason why this website [even in spite of the AGW orthodoxy of today] got the best science blog award.
Because…unlike some other similar blogs [not to mention any names realclimate.org], they welcome FREE INQUIRY here.
However…..
Free inquiry and the sacred INDUCTIVE scientific method is not at all the same…as reading into and manipulating people’s statements, shifting arguments, and trying to impose a legalistic or forced explanation on things that are just not able to be proven (or disproven) without a shadow of a doubt at this time.
No one said that the two peaks of the Draupner and the 1998 are the same. Not at all. Rather…similar [but remarkably similar].
Rogue waves in the sea, in and of themselves, are scary, fascinating, and unpredictable beasts.
But….all waves have some common characteristics to some degree…..be them gamma frequencies…. or sound waves…or ocean waves….or gravity waves….or multidecadal oscillations…or even Milankovitch slow-pokes.
This is a fun thread….and you are taking all of the fun out of it. No need to do that. Lighten up, please.
Carry on everyone. Thank you for your posts.
Chris
Norfolk, VA
Tom P (02:19:25) :
Tallbloke,
“Bob Tisdale has done some great work on the step changes induced by el nino’s.”
http://www.woodfortrees.org/plot/uah/plot/uah/to:1998/trend/plot/uah/from:1999/trend
What is the physical basis for an El Niño event producing a step change in temperature? This can only happen if there is a one-off permanent injection of energy from the event.
As Bob Tisdale explains, the energy came from a sub-surface region called the Pacific Warm Pool and was disipated across the oceans by el nino. The amount of energy in it is not picked up by sea surface readings. Have a read of his site before dismissing things a priori.
http://bobtisdale.blogspot.com
Paul Vaughan (12:26:58) :
tallbloke (00:36:38)
http://users.beagle.com.au/geoffsharp/ephemeris-z_axis1874.csv
The gun is firing blanks and the room is full of smoke.
So I put Geoff of going to the trouble of getting my data hosted at your request and without giving any expanation or reasoning you dismiss it?
http://solarcycle24com.proboards.com/index.cgi?action=display&board=general&thread=568&page=1
I won’t be joining that discussion.
Good, that’a a level of arrogance I can live without.
Angry enough to make typos and formatting errors.
Gah!
Save the Sharks,
I’d appreciate seeing some examples of where I’m the one “reading into and manipulating people’s statements, shifting arguments, and trying to impose a legalistic or forced explanation on things that are just not able to be proven (or disproven) without a shadow of a doubt at this time.”
It’s certainly less than fun to have my last submitted comment disappear without a trace of explanation. Of course it’s Anthony’s blog to do with as he pleases, but I don’t see quite why such heavy weather is being made over what is a simple point about background trend fitting and the persistence of a signal.
Tallbloke,
Thanks for the lead – I can assure you that I won’t reject any offered explanation out of hand. I had taken a quick look at Bob Tisdale’s site, but only came across analysis rather than explanations. The Pacific Warm Pool would certainly spread out the effect of an El-Niño event. I still don’t see how it can produce a permanent step change in temperature, though. He appears to put that down to an imbalance of El Niños to La Niñas, not to any one warming event. He gives no underlying reason as to what might cause such an imbalance, though, so his analysis is more descriptive (more warming events mean higher temperatures) than explanative (why are there more warming events).
REPLY: Tom. I’m unaware of any other comments you’ve made, or the one you refer to that disappeared. If you submitted one and it disappeared, it perhaps made it into the spam filter and went unnoticed and was deleted. This occasionally happens depending on combinations of words and/or phrases. Even posters who have been on WUWT for months sometimes end up there. I and the other moderators try to recover all legitimate comments, but sometimes we’ll miss one or two, especially if we also get a spam blast that fills up the holding bin quickly.
Feel free to resubmit. If it disappears again, please send me a note. – Anthony