In comments on WUWT, people often think freely and throw out all sorts of ideas. Like in any collection of people, some are bad, some are average, a few are good, and even fewer are noteworthy. However, one that was noteworthy recently was from a WUWT regular known as “hotrod” in the “NASA Deep Solar Minimum” thread.
The thing that has been nagging at me is, that the trace of a rogue wave in this link, looks a lot like the 1998 temperature spike. On thinking about it, if a [rogue] wave is possible in the ocean, is it not conceivable that the same sort of behavior could exist in an average temperature plot for a body like the earth, as it oscillates around an average temperature? This like the PDO and AMO are just different types of periodic motion.
He was referring to what has now become known as the Draupner Wave, named for the oil platform that recorded it on January 1st, 1995.
In the case of the Draupner Wave, it has an amplitude about 3x that of the average background wave amplitude. It was created when the amplitudes of some waves of dissimilar amplitude and period combined in sync to form a new wave peak for an instant. That instant passed and the sea went back to normal background amplitude.
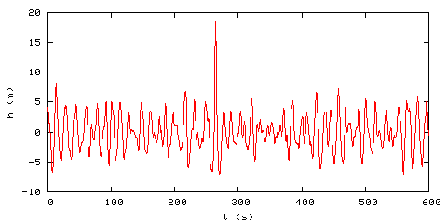
In the case of the 1998 Super El Niño, there is a similar sort of event where the temperature peak is about 3x that of the background peaks. This plot of the RSS Global Temperature Anomaly below (done by Barry Wise) shows the 1998 super event in red:

Barry writes:
The 1997/98 El Niño temperature spike seems to have had a long lasting effect that is dissipating. This graph shows what the trend was before the event and how the trend was affected by it. The dashed red line is the trend with all of the data and the purple is the trend based on the data before the area highlighted in red. Notice that there appears to be a decaying oscillation. If correct we’re in the third peak which is less than the previous two, and is much closer to the purple trend line.
[Note: I should point out that Barry’s method creates a different result than if the 97/98 El Nino data is removed, and before and after trend lines are plotted (h/t to Tom P) the resultant effect of the 1998 Super El Niño is less apparent. See comments for more discussion.]
Certainly there appears some similarity between the Draupner Wave and the 1998 Super El Niño worldwide temperature spike. And certainly we have a number of periodic systems and forcings going on here on Earth that are sinusoidal by their nature. They span short (high frequency) and long (low frequency) periods. Here are a few that I’ve thought of, short and long, but by no means is it a complete list.
Diurnal solar insolation and temperature variation, daily and monthly lunar tide cycles, seasonal variation of solar insolation by hemisphere, seasonal variation of temperatures by hemisphere, seasonal biomass variations, seasonal sea ice variations, seasonal albedo variations, 11 and 22 year solar cycles, Earth’s length of day variations, El Nino Southern Oscillation, North Atlantic Oscillation, Pacific Decadal Oscillation, Atlantic Multidecadal Oscillation, and at very long periods, Milankovitch cycles.
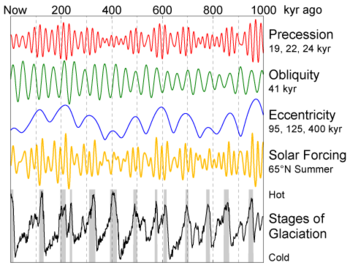
There are many many cycles on earth that are known, some yet to be discovered. Almost all of them have a root cause in periodic circular motions such as planetary rotation and orbital motion in our solar system and the variances of orbital eccentricity, obliquity, and precession. For example, the graph below shows how these different waves eventually synchronize to cause cycles of ice ages on earth.
To illustrate how sinusoidal cycles can conspire to produce peaks and valleys in amplitude, this interactive Java sinusoidal generator allows you to combine three different waves of varying phase, amplitude, and wavelength and see the resultant wave that forms from them:

During my limited experimentation above I couldn’t get the generator to produce a Draupner type wave, but as you can see in the screencap above, I was able to illustrate how a new peak can be generated (in blue) that is larger than any of the source wave peaks.
Here is an example of how “wave focusing” can occur to produce a Draupner type peak:

Lest you think this essay is about childs play with sinusoids, I’ll point out that there have been some serious works done on the mathematics behind the creation of “rogue waves”. For example there’s this brief discussion from the link commenter “hotrod” originally provided:
BBC Two, on November 14, 2002, aired a program on this phenomenon and its recent mathematical analysis. Freak waves, also “rogue waves,” “monster waves,” are extraordinarily tall and steep waves that appear sporadically and wreck havoc with shipping. One is suspected to have washed away the German cargo München which went down with all hands in the midst of a routine voyage in 1978. More recently, the cruise ship Caledonian Star was struck by a 30m wave on March 2, 2001. The standard analysis of ocean waves predicts a Gaussian-like distribution of heights; extreme heights, although possible, should be very rare – a 30m wave is expected once in ten thousand years, according to the BBC. But these waves occur much more frequently than predicted. The program focused on new methods of analysis, and on the work of the mathematician A. R. Osborne (Fisica Generale, Torino). Osborne has applied the inverse scattering transform, which he describes as “nonlinear Fourier analysis,” to the time series analysis of wave data. He conducted simulations using the nonlinear Schrödinger equation and found near agreement with the standard analysis, except that “every once in a while a large rogue wave rises up out of the random background noise.” His paper, available online, gives an example of such a simulation:

From CIM Bulletin #14 at http://at.yorku.ca/i/a/a/h/51.htm
Here’s a paper (PDF) on the Draupner wave titled: THE SHAPE OF THE DRAUPNER WAVE OF 1STJANUARY 1995 from Paul Taylor, Department of Engineering Science, University of Oxford. Taylor did a mathematiucal analysis of the Draupner wave, created a model to approximate the formation of it, and concluded that: “The New Year wave is ~ 1 in 2×10^5 waves” which when you think about it, makes it fairly common especially when you view it in context to images like the one below:

So it seems that such amplified rogue waves are fairly common in the nature of our oceans. That’s quite a journey from them one time being considered “mystical” by science.
Another scientific paper (PDF) of interest is: Physical Mechanisms of the Rogue Wave Phenomenon by Christian Kharif and Efim Pelinovsky of IRPHE in France and the Institute of Applied Physics in Russia, respectively. They conclude (emphasis mine):
All the physical scenarios of possible extreme wave generation (focusing, wave-current interaction, modulational instability), in fact, were known but only now (during the last 5 years) they are “dressed” by mathematical models of various levels (linear, weakly nonlinear, fully nonlinear models). Results of numerical simulations show the behaviour of each mechanism taking into account the random character of the wind waves in the ocean. Computations provide also the probability of rogue wave occurrence for simplified conditions. The many results are very sensitive to the model parameters (shape of wave spectrum, various corrections of the weakly nonlinear evolution models, accuracy of numerical schemes for long49 time computations).
Given that rogue waves were once thought to be the fantasy of imaginative sailors and fishermen, and given that science has now only addressed the problem once one was measured in 1995, it illustrates how something once thought to be impossible is now possible once it is measured, better understood, and studies published about it.
By the same logic, things like the Pacific Decadal Oscillation weren’t discovered until fairly recently. The PDO was named by Steven R. Hare, of the University of Washington, who noticed it while studying salmon production patterns (See BAMS article, PDF). Almost simultaneously the PDO climate pattern was also found by Yuan Zhang. This happened in 1997. It is one more natural cycle added to the many that were already known such as the El Niño-Southern Oscillation (ENSO) and the North Atlantic Oscillation (NAO)
Perhaps it is not an unreasonable to consider that on occasion, some of these cycles conspire to produce extreme ocean events like the 1998 Super El Niño.

And, given the difficulty in predicting exactly when natural cycles might coincide to produce such an event, perhaps this is why they are so hard to predict. For example, there was Dr. James Hansen’s 2006 prediction about a “super El Niño” that would rival the 1983 and 1997-1998 El Niño events.
In March 2006, Hansen wrote a paper claiming the following:
We suggest that an El Niño is likely to originate in 2006 and that there is a good chance it will be a “super El Niño”, rivaling the 1983 and 1997-1998 El Niños, which were successively labeled the “El Niño of the century” as they were of unprecedented strength in the previous 100 years.
We all know now that prediction was a bust. While there was in fact a 2006-2007 El Niño event. In the words of climatologist Mike McPhadden the event:
“started late, ended early and was below average strength”
Hansen’s prediction of a “super” event “rivaling the 1983 and 1997-1998 El Niños” never came true. Undeterred, Hansen is still predicting the onset of an El Niño event that will drive global temperatures to a new record high in 2009 or 2010. (h/t to Roger Pielke Jr on Prometheus)
Perhaps the applications of the studies of rogue ocean waves might be useful in figuring out if the 1998 event was in fact a synchronicity of natural cycles, linear, non-linear, and chaotic for a brief time, and if so, applied towards forecasting future super El Niño and La Niña events. I think it is worth considering. – Anthony
In all things there is a law of cycles.– Publius Cornelius Tacitus (55-117) Roman historian.
Then shouldn’t we be seeing something like this on the negative end as well?
Tim Channon (17:50:51) :
It’s hard for me to tell whether the rise in the polar data is leading or lagging the tropic graph. It’d be nice to see an overlay.
If the heat pulse is moving poleward I would assume the effect on the global temperature would be less just because the temperature of the water moving north would be colder requiring more heat to achieve the same temperature effect when averaged into the global value, (or am I way off because it’s too late at night to be thinking about this).
Whether it’s a damped oscillator or other effect (and there are a number of other overlayed patterns in the data so I wouldn’t expect it to look like a classic oscillator that was just my first guess looking at the graph), the question is whether the system was driven out of the normal state and is now returning to it’s previous state or if it has been driven to a new state.
Now I’m wondering if the polar melting over the last decade is related to this pulse.
Anthony,
Your two approaches to the 97/8 El Niño event contradict each other. Either it can be analysed as
1. a “rogue wave” one of whose defining properties is its transience.
2. a persistent phenomenon which has dominated temperatures up to the present.
You currently appear to advocate the effects of both models operating at the same time.
REPLY: I don’t agree with your line of thinking that they are contradictory, because your thinking assumes the 97/98 event to be essentially a singularity, without any harmonics or return of energy back into the system. As Barry points out in comments, not all of the heat from the El Nino is radiated into space, some goes back into the system via weather, cell transport, oceanic transport, and other mechanisms. By simply removing or flattening the 97/98 data, you don’t remove the effects of that recycled heat in the system, nor can you predict how much of the real data after 97/98 is reflecting the return to equilibrium in the system from that heat event. If the 97/98 El Niño had not occurred, what would be the trend? We don’t know exactly, just as we don’t know how much of the signal after 97/98 is a portion of that heat returned to the system.
In Barry’s case, he extrapolates a trend line as if the event doesn’t happen at all, and the trend continues as it was, basically a persistence forecast for the temperature trend, not unlike some temperature trend forecasts we’ve seen issued by others.
In your case, you remove the 97/98 data, but do not make any adjustment for the effect of the 97/98 event recycling heat back into the system, nor can you, because you don’t know the magnitude.
Each method has its flaws. The ground truth trend (if a 97/98 El Niño did not occur) likely lies somewhere between the red an purple lines Barry plotted, or perhaps between your trend line minus El Niño and the purple line, but we will never know exactly where the trend would have been since we can’t remove the total effect of the El Niño, post event. – Anthony
Wow many thanks Anthony for the continued free-speech approach to scientific inquiry. The freak wave idea is a good one.
And thanks Hotrod for creating this little bit of reality….
The problem is that, as Tallbloke mentions in another thread, one wave suddenly robbing the energy from waves on either sides to become a steep-walled, super-high, nearly vertical, mega-troughed (the “hole”) wave…all of this happens “at once.”
Perhaps our impression of of what is “at once” needs to change.
There is a remarkable similarity between waves…if their periods are a few seconds or a few thousand years.
A wave is a wave….a transfer of energy.
So how to explain these big monsters?
Gotta delve in a little quantum.
Check out Anna V’s posts on rogue waves….
As others have alluded to here, if you can get a ‘rogue wave’ in the climate then you should be able to get a ‘rogue trough’. I’d like to know if there are any candidates for this in the past.
Anthony wrote: Perhaps the applications of the studies of rogue ocean waves might be useful in figuring out if the 1998 event was in fact a synchronicity of natural cycles, linear, non-linear, and chaotic for a brief time, and if so, applied towards forecasting future super El Niño and La Niña events. I think it is worth considering. – Anthony
Well said….
I realize the heatburn my chopping of the end data is giving to some people but you’re missing my point. IMO there is either a step change after the El Niño or the system is slowly returning to a previous state prior to the event. Just look at the peak values prior to it (in the neighborhood of .03) and after (over .4) with the last peak back to about .3.
Tom P (18:45:29) :
I disagree with your statement that what I’m proposing is at odds with the rogue wave. The temperature change in the atmosphere is related to a change in the forcing, either more energy coming in or being released by a sink. The rogue wave would be cycles of forcings that cause the spike. In this case, the ocean cycles (and maybe some other forcing) released enough heat to spike the global temperature. Once it’s in the atmosphere it’s got to go somewhere. Where did it go? Some was radiated away but some has to stick around because of good ole ghg’s. Why would the temperature spike and then return to previous values if there is residual heat in the system? Why is the slope prior and after the event so different? If not related where did the step after 2001 come from? Probably many answers based on data I’m ignorant of, but the heat has to come from and go to somewhere.
If you read the comments to the Scientific Socialism (formerly Scientific American) article about the ice bridge, you will see what is getting common with these types of articles. Almost all comments are skeptics heckling the scare-mongering. Science News website draws the same fire from skeptics.
Right after the 1998 event, there was a massive spike in snow accumulation on mountains in the Pacific Northwest region — for example ~9.5 metres, at ~900 metres elevation, at ~49 degees (latitude) north. [FYI: 1m ~= 3.3 feet]
For some refreshing ideas on ENSO, see p.5-6 in:
http://eprints.soton.ac.uk/19292/01/ex19.pdf
And if you are up for something a little more complicated – but along the same refreshing line of thinking:
http://forum.decvar.org/presentations/ENSO_WORKSHOP/documents/presentations/posters/Sonechkin-poster.pdf
BarryW (20:21:23) :
I realize the heatburn my chopping of the end data is giving to some people but you’re missing my point. IMO there is either a step change after the El Niño or the system is slowly returning to a previous state prior to the event.
Chen et al part2 2008
Another dramatic phase change occurred from the mid- to late 1990s. Though the PC time series begins to decline after 2000 and the GISTEMP time series (Fig. 1, top, black) even drops below zero in 2003, the 1990s event may turn out to have been a regime shift because, unlike the change that occurred in 1989, the peak in late 1999 reaches an amplitude comparable to those peaks between 1945 and 1975, suggesting a possible phase change on the interdecadal time scale. At the same time, the 1990s event coincides with dramatic interdecadal changes in the Pacific biosystem (Chavez et al.
2003) and ocean circulation (McPhaden and Zhang 2004). According to an analysis based on the Zebiak–Cane model, the interdecadal warm phase of the tropical Pacific since 1976 ends after the 1998 El Niño (Seager et al. 2004).
Take a look at the S&P stock price index 1871-2009
http://en.wikipedia.org/wiki/File:IE_Real_SandP_Prices,_Earnings,_and_Dividends_1871-2006.png
Looks to me like the rogue bankers created a rogue wave.
savethesharks (19:40:40) :
The problem is that, as Tallbloke mentions in another thread, one wave suddenly robbing the energy from waves on either sides to become a steep-walled, super-high, nearly vertical, mega-troughed (the “hole”) wave…all of this happens “at once.”
I had a bit more of a think about this. From the point of view of someone on a coast measuring the incoming waves in a mist, they would only see the amplitude of each wave as it was arriving. If they knew about rogue wave theory, they might measure several consecutive deeper then usual troughs and decide it was time to retreat further up the hill.
Perhaps Hansen, believing temperature on the longer term is increasing still, sees the several consecutive deeper dips in sea surface temperature since 2003 and concludes that ‘the big one’ is on it’s way.
If we could see more of climate ‘all at once’ like we are able to get in a spotter plane and see a rogue wave with the deeper troughs both in font of, and following it, we’d be able to predict short term climate anomalies like el nino’s produce.
I think it was Anthony that commented some time ago that the aa index seems to predict temperature several years ahead. It was mentioned upthread that someone has patented a weather prediction method based partly on the aa index. I produced my own prediction graph some time ago based on this idea (prior art!) and although it’s a bit early to tell how good it is, it seems to be working so far, though I got the recent temperature drops in the UAH and RSS a bit early. Matches SST’s quite well though.
http://1.2.3.10/bmi/cache.backpackinglight.com/backpackinglight/user_uploads/1231245089_09231.gif
“…During my limited experimentation above I couldn’t get the generator to produce a Draupner type wave…”
If I remember correctly, the idea about the appearance of Draupner waves was that there was a non-linear interaction between several consecutive waves in which one of them “stole” energy from the others nearby to rise to a greater height that was supposedly possible (or with a greater probability that was supposedly possible). In that case, linear addition of waves in a generator is not going to produce a monster wave.
Thinking about it, to “prove” the 1998 Super El Niño was caused by a Draupner wave effect we would need to find a mechanism by which the energy of previous and subsequent El Niños would be “concentrated” into one of the oscilations. If the energy for any of the oscilations is accumulated over several years, we just have to find a physical effect that would allow for the energy to be accumulated in a non-linear way. Maybe here is a PhD thesis for some student in non-linear physics?
tallbloke (22:58:25)
“[…] It was mentioned upthread that someone has patented a weather prediction method based partly on the aa index.”
That was LOD.
See the following for a good overview of the physics:
http://images.astronet.ru/pubd/2008/09/28/0001230882/425-439.pdf
The story is pitched at an accessible level.
Tip: Study your aa index correlations more carefully before you put money on your forecasts.
Thanks Paul, reading too many things at once here.
By the way, Geoff Sharp has offered to host the data you requested, link to follow.
Paul, here it is.
http://users.beagle.com.au/geoffsharp/ephemeris-z_axis1874.csv
Another very interesting thread, thanks everyone. Sometimes it’s difficult to handle too much “fringe” or otherwise unfamiliar stuff all at once, it can easily press our “can’t cope! must explain away or silence!” buttons.
We know that amplification can work, small amplifiers causing big results, which is why soldiers crossing a bridge have to fall out of step. Then there’s the “rogue wave”, well-attested now, perhaps given its own inner strength to continue as per the “soliton” (think of smoke rings). Then there’s the possibility of rare extraterrestrial influences (the January 21st Sudden Stratospheric Warming seems related to an “anomalous x-ray pulsar”; there’s also the evidence, mentioned in this thread, of a super-luminal velocity gravity wave setting off the 2004 tsunami).
I found this paper by Arno Arrak via ICECAP and it’s another fresh “fringe” approach that IMHO is worth looking at even if not perfect. It suggests a correlation between the El Nino Major and gamma ray burst GRB 971214. The time frame is right: December 1997, the time from which the El Nino spike starts. Also the observations on longer-term effects are interesting.
“evidence, mentioned in this thread, of a super-luminal velocity gravity wave”
I should have said “possibility” rather than “evidence”, to be more scientifically correct…
Tom P (17:50:58) :
The RSS data, complete and without the El Niño event is here:
http://img9.imageshack.us/img9/32/rssdata.png
Another way to consider the data is to look at the trends up to and after the 1998 spike.
http://www.woodfortrees.org/plot/uah/plot/uah/to:1998/trend/plot/uah/from:1999/trend
Bob Tisdale has done some great work on the step changes induced by el nino’s.
Anthony, Barry,
Your statements
“…you don’t remove the effects of that recycled heat in the system, nor can you predict how much of the real data after 97/98 is reflecting the return to equilibrium in the system from that heat event.”
and
“…the heat has to come from and go to somewhere.”
are not consistent with the modelling the 97/8 El Niño event as a rogue wave.
A rogue wave does not cause a permanent, or even a short-lived change in sea level beyond the duration of the event. Where does the mass of the rogue wave go? Well, it wasn’t there in the first place – there are corresponding troughs on each side as can be seen in the in the University of Bergen animation and as was mentioned a couple of times earlier in the thread. For instance the Draupner wave time series, your first image, shows two substantial minima either side of the maximum which bring the overall mass in the wave very close to zero judging by a quick calculation of the areas.
Similarly if the the 97/8 El Niño can indeed be modelled as a rogue wave it would necessarily be associated with adjacent cooling episodes, and there is evidence for these troughs. It is not possible, though, to model this event as a rogue wave AND insist that there is residual heat in the system that then takes over a decade to dissipate. A rogue wave just doesn’t behave like that – you’re muddling the maths from two distinct and contradictory physical phenomena.
As for Barry’s point as to why the slope is different before and after that El Niño, that’s just reflecting the increased noise as you chop up a time series into smaller parts. There are plenty of rapid changes in the data apart from 2001, for instance 1983, 1987, 1990, 1993, 2004, and 2008. Unless you have have some unbiased statistical (and I hope scientific) basis for making the change in 2001 a special case, there is no justification for splitting the RSS data into two at that point.
I can see why it might be tempting to ascribe the 2001 step as a delayed response to a super El Niño, but it has no physical or statistical foundation, and such a delayed step change in temperature is just not seen in the historical data, see e.g.:
http://img12.imageshack.us/img12/9844/superelninos.png
The most prominent signal apparent in the RSS data series, with or without the 97/8 El Niño event, is a simple linear trend of about 0.015 degC/year:
http://img9.imageshack.us/img9/32/rssdata.png
REPLY: I don’t agree with anything you’ve said or the bounds that you are placing. Your assumptions that the atmospheric system behave exactly like the oceans in response to a wave is not convincing. While they are both fluids, they do in fact behave differently to stimulus, and the stimulii are different. I think you are taking the wave comparison too literally, and attaching expectations and bounds that aren’t relevant because the systems behave differently. The idea of this essay is raise the idea that many cyclic events in earth’s systems came together to produce a large peak in the heat system, much like waves of dissimilar period and amplitude come together to produce a rogue wave in the ocean. To say that the total earth systems response (with its wide mixture of processes) must behave exactly like the ocean wave is not reasonable, IMHO.
You write: “are not consistent with the modelling the 97/8 El Niño event as a rogue wave.” Nobody is making a model here (except maybe you, which is why I think you are overreaching), all that is being said is that the way the peaks are formed in both cases, a brief synchonization of cycles, appear similar. Your statement of “Where does the mass of the rogue wave go? Well, it wasn’t there in the first place ” I agree with that, but you are making an extension of that idea to heat, and I can assure you that the heat was in fact there, and it was released into space, and also diffused into earths systems. The comparison you suggest of mass (in a rogue wave) to heat (in earth’s systems) and as “never having been there in the first place” is invalid. It was there, and measured.- Anthony
What a cool article. I’m no scientist, and just the other day I was looking at the 98 peak wondering what on earth could cause that. Then I remembered seeing that Freak Wave documentary, and wondered if this was anything similar 🙂
When Shell oil designed the platforms for the Brent oil field in the North Sea they had tons of research on the area, it is one of the worst weather locations to establish a platform that you could imagine. The Brent Delta Platform was designed with a air gap in anticipation of the Hundred year wave, the first winter on location the hundred year wave arrived 30 plus times scarring the c**p out of all as the platform felt like it was disintegrating.
Tallbloke,
“Bob Tisdale has done some great work on the step changes induced by el nino’s.”
http://www.woodfortrees.org/plot/uah/plot/uah/to:1998/trend/plot/uah/from:1999/trend
What is the physical basis for an El Niño event producing a step change in temperature? This can only happen if there is a one-off permanent injection of energy from the event.
You also have to explain why such a step change is only seen with the 97/8 event, and not previously. It is indeed fortunate for our survival that such an El Niño is rare: if we see an uptick of at least 0.1degC every time we experience a Super El Niño, even if it’s no more than once a century after ten thousand years we’d be toast!
Unless Mr Tisdale has some startling new physics underpinning his analysis, presenting such discontinuous temperature trends is scientifically and historically meaningless. On the other hand, I can think of one possible explanation as to why only more recently might an El Niño give the impression of bumping up the temperature: spikes on a noisy upward-trending data series will often appear as steps.
REPLY: ‘You also have to explain why such a step change is only seen with the 97/8 event, and not previously.” Tom, this demonstrates exactly why you are overreaching with your analysis. We have good global temperature data for about 100 years, global SST for about 30. To imply that just because it hasn’t been seen a second time in that 30 years worth of data is to ignore the fact that nature seldom reacts conveniently to our expectations. The 1983 event was masked by El Chicon, prior to that, we have no other examples that have been globally measured. Your logic then of only seeing such a step once would be to deny the existence of rogue waves because it was only measured once at the Draupen oil platform? – Anthony
Just more kudos. The rogue wave concept is interesting and maybe has some validity. At the least to this non-expert, it does not seem to be something to dismiss lightly.
Lucy Skywalker (00:36:55) :
Then there’s the possibility of rare extraterrestrial influences (the January 21st Sudden Stratospheric Warming seems related to an “anomalous x-ray pulsar”
I asked Leif about this at the time, but he thought it was probably just data error…
Massive bow shock to magnetosphere: 2009 21st Jan 11.40pm
I wonder if it was somehow linked to the x ray pulsar. Perhaps just sending the satellite sensor haywire?