Ed Hoskins
As at its current concentration atmospheric CO2 at 420 ppmv is already more than 85% saturated, its Global warming potential is almost entirely exhausted.
All attempts by Mankind to limit further CO2 emissions will have no further significant controlling effect on Global temperature.
Further actions by the Western minority of Man-kind to protect against a supposed Global Overheating Catastrophe from CO2 emissions are pointless.
Introduction
A cogent case can be made that all future Man-made emissions of the minor Greenhouse gasses are:
- irrelevant to the future of the World’s climate.
- cannot pose any real overheating problem in future.
- certainly not imposing any existential disaster for Mankind.
- this is fortunate as the developing world, 80+% of the global population, is taking no notice of the alarm about CO2 emissions causing Global Overheating that is now fashionable in the West.
instead
- atmospheric CO2, even at its current historically low level, is making a huge and absolutely essential contribution to the well being of Planet Earth via it support of photosynthesis and healthy plant growth.
These analyses, they show that:
- as at the current CO2 level of 420ppmv the effectiveness of CO2 as a warming agent is now almost fully saturated.
- there is no possibility of any overheating Climate emergency, nor any future temperature Catastrophe caused by increasing Man-made CO2 emissions from burning of Fossil Fuels.
- there is now no rational imperative for Western economies to eliminate CO2 or other Greenhouse Gas emissions from Methane and Nitrous Oxide by implementing their Net Zero policies.
- there is no reason whatsoever to try to control Methane or Nitrous Oxide emissions to avoid Global Warming. The inherent chemistry of these powerful Greenhouse gasses means that any extra emissions are always be rapidly purged in the Earth’s Oxygen rich atmosphere, leaving only small residues in the atmosphere, only measurable in parts per billion, resulting in a minor and static effect on Global temperature.
Although studiously ignored by Climate Alarmist thinking, the Water in the atmosphere either as Water Vapour or as Clouds is the main Greenhouse Gas, accounting for roughly 85% – 95% of the total warming effect or about ~30°C of the estimated ~+33°C Greenhouse effect. The Greenhouse effect of Water in the atmosphere varies according to latitude, local climate and local humidity roughly within that range. Mankind has no influence on the amount or distribution of water in the atmosphere.
The water-based Greenhouse effect of ~+30°C is essential to the continuance of all life on Earth.
The Water in the atmosphere maintains the habitability of the planet and thus supports all Life-on-Earth.
This note and its illustrations show the context, proportionality and scale of the temperature effects of the minor greenhouse gasses emphasizing their future irrelevance.
Note: the values shown here are deliberately approximate, as indicated by the symbol “~”. The values here show minimal values for the temperature effect of CO2 and other Greenhouse gasses. Actual values are more variable according to local climate conditions, humidity, longitude, etc. Nonetheless, the values are at the right scale and in the right ball park.
The long-term context of the atmospheric composition and temperature
The diagrams below summarize the evolution of the Earth’s atmosphere over the past 4.6 billion years and show global variations in temperature and CO2 concentration over the more recent the Phanerozoic eon, the last ~600 million years, the period over which the whole of advanced Life-on-Earth has emerged.
Over most of Phanerozoic eon Global temperatures have been substantially higher than at present, (+~ 15°C ). Global temperatures are now low by comparison.
About 2.5 million years ago the Earth entered an Ice Age, with permanent ice sheets at both poles. Long cold periods lasting ~1000,000+ years are interspersed by shorter inter-glacial periods of ~10,000+ years. This pattern is established by the mechanics of the Solar System and its Milankovitch cycles.

The more recent temperature pictures show a massive decline that started some 55 million years ago. And the history of our current Holocene inter-glacial shows that any temperature recovery from the recent little ice age is marginal in comparison with more significant variations even in the recent past.
Over most of the 600 million year Phanerozoic eon Global temperatures have been substantially higher than at present, (+~15°C ). Global temperatures are now low by comparison.
About 2.5 million years ago the Earth entered an Ice Age, with permanent ice sheets at both poles. Long cold periods lasting ~100,000+ years are interspersed by shorter inter-glacial periods of ~10,000+ years. This pattern is established by the mechanics of the Solar System and its Milankovitch cycles.
The more recent temperature pictures show a massive decline that started some 55 million years ago. And the history of our current Holocene inter-glacial shows that any temperature recovery from the little ice age is marginal in comparison with more significant variations even in the recent past.

Our current Holocene inter-glacial is the most recent of those warmer inter-glacial times.
The warmer Holocene epoch of the last ~10,000+ years has been the enabler of the development of Man-kind’s civilizations, from the stone age to computing.
Judging from past inter-glacials after ~10,000 years, our current Holocene period, should be drawing to its close, sometime this century, next century or this millennium.
The ending of the Holocene and the subsequent reversion of the World to real Ice Age conditions will result in a true catastrophe for the World and Humankind.
There is now a real risk that the inexorable Carbon sequestration processes progressing in the world’s oceans will lead to atmospheric CO2 levels falling below the Photosynthetic terminal level of 150ppmv during some future Glaciation.
With the eventual failure of Photosynthesis from lack of atmospheric CO2, all Life-on-Earth will end in some future Glacial period. There is even a chance that the happenstance of Man-kind’s current activities, adding to CO2 levels by burning fossil fuels may raise the threshold of atmospheric CO2 and thus delay the final steps of the CO2 sequestration process and even prolong the survival of life on Earth.

For the last 100 million years atmospheric CO2 levels have been reducing progressively. At the start of our current the Holocene epoch only 20,000 years ago, the CO2 level had fallen to 180ppmv. This was only 20% above the terminal level for all Life-on-Earth, (Photosynthesis fails below 150ppmv).
With industrialization and the exploitation of Fossil fuels Man-kind has made especially rapid technical advances over the last 200 years. This has resulted in huge advances in the well-being for the majority of the 8 billion people now sustained by planet Earth.
The radiation physics of atmospheric CO2 by Professor William Happer
This presentation by Professor William Happer provides an explanation of the atmospheric radiation physics shows that the temperature effectiveness of CO2 diminishes logarithmically. At the current 420pppmv the temperature effect of atmospheric CO2 is ~85% saturated. Any possible future CO2 temperature effects are well below any of the Alarmist and official predictions that are asserted by the Climate Modelling of the IPCC, (UN Intergovernmental Panel on Climate Change).
Professor Happer’s specialism is the radiation physics of energy transfer in the atmosphere. In the early 1990’s, whilst Director of Energy Research in the U.S. Department of Energy during the George Bush presidency, Professor Happer was responsible for setting up many of the American Climate Research establishments.
Professor Happer explains the atmospheric Radiation Physics involved in this presentation.

Paraphrasing Professor Happer
“The important point here is the red line on this chart. It shows what would happen if the concentration of CO2 was doubled. The gap between the black line and the red line shows the extent of the effect of doubling CO2. So, you can see that doubling CO2 now makes virtually no difference.
On the basis of this minuscule difference, we are supposed to give up our liberties, give up the gasoline engines in our automobiles, give up all the benefits of Western Industrial society and submit to dictatorial Government controls”.
“The message I want you to understand is:
don’t let anyone convince you that is a good bargain: it is in fact a terrible bargain.”
Alarmist reasoning for their view of a massive temperature increase from Man-made CO2
Climate alarmists, assert via their models that the release of additional “Western” increments of Man-made CO2, greater than 420ppmv, (capable of only causing very small temperature increases), will result in a massive positive temperature feedback from the additional water evaporated into the atmosphere. Massive positive feedback processes like this are unknown in the earlier natural billion year past records. Much higher concentrations of atmospheric CO2 have never caused runaway warming. Such massive positive events would conflict with the Le Chatelier principal with determines that positive feedbacks are very rare and almost unheard of in nature.
Low levels of Carbon Dioxide contribute most to Greenhouse warming
The following diagram uses the US EPA estimate that the whole CO2 based component of Global warming amounts to ~8.2% of the total Greenhouse effect: 33°C * 8.2% = +~2.71°C up to a maximum CO2 level of 1000ppmv. As the warming effect of CO2 still diminishes logarithmically further increases of the CO2 level have ever less important effects on Global temperature. In this analysis the increments are ignored beyond 1000 ppmv.

Notes:
- the background of the diagram represents the influence of CO2 on plant viability, from death of plants below 150ppmv shown in black, to verdant green at 1000ppmv on the right.
- the other minor contributors to Global Warming are:
- the temperature contribution of each 10ppmv tranche of CO2 as Orange columns reducing logarithmically with increasing CO2 concentration:
- the stable temperature contribution of Methane is shown as pale blue.
- the stable temperature contribution of Nitrous Oxide is shown as purple.
- the temperature effect of CO2 up to the current 420ppmv is shown as solid Red.
- the temperature effect of CO2 beyond 420ppmv is shown as hatched Red.
- the Temperature values of each 10-ppmv CO2 tranche, (shown in Orange), are cumulative to the overall CO2 contribution to Global temperature.
- Logarithmic Diminution of the CO2 Greenhouse temperature effect means that the lowest concentrations of CO2 have already made by far the greatest temperature contribution.
- thus, the characterization of Carbon Dioxide as a pollutant in future:
- as is asserted in the US EPA “Endangerment Finding”.
- as is taught throughout Western educational establishments.
- as had been accepted and promoted by many Western Governments, under the guidance of the UN IPCC, (the UN Intergovernmental Panel on Climate Change).
is a gross misrepresentation of the role of atmospheric CO2.
On the contrary CO2 in the atmosphere is the absolutely essential Gas of Life.
- accordingly, the first 10 ppmv tranche of CO2 contributes ~+0.35°C or ~13% of the total CO2 warming effect.
- a first tranche up to 150 ppmv CO2 maintains the viability of Photosynthesis and is thus is essential for the marginal survival of all Life -on-Earth.
- at 150 ppmv the temperature effect of CO2 amounting to +~1.42°C or 52% of its total warming effect.
- at the start of our current Holocene inter-glacial the CO2 concentration was 180ppmv, a level only 20% above the terminal level for the failure of Photosynthesis.
- the increase of CO2 from 150ppmv to 280ppmv, the pre-industrial CO2 level contributes ~+0.30°C or up to ~63% of the total CO2 warming effect: this increase of CO2 can be attributed to the continuing out-gassing from the warming oceans as the Holocene progressed.
- the more recent increase from 280ppmv to 420ppmv CO2 level is partly attributable to Man-made CO2 emissions. It contributes ~+0.2°C or up to ~70% of the total CO2 warming effect.
- the total Greenhouse Gas effect including CO2, Methane and Nitrous Oxide contribution to date with at CO2 420 ppmv amounts to +~ 2.45°C or ~90% of the total CO2 warming effect.
- having now reached 420 ppmv the warming effect of CO2 is >85% saturated. This is well beyond the point where whatever further increase of the concentration of atmospheric CO2 could produce any significant temperature increase.
- ECS, Equilibrium Climate Sensitivity is defined as the temperature effect of a doubling CO2 concentration from the current 420 ppmv onwards to 840 ppmv.
- reaching ECS could now only result in a ~1%+ effect to increase the CO2 temperature ~+0.33°C, well within the range of natural variability.
- the reduction of the warming effect of CO2 beyond ~420 ppmv, can be seen a as the long tail of diminishing orange columns approaching 1000 ppmv.
- thus, the continuing increase in atmospheric CO2 if produced by mankind will have only very marginal temperature effects.
- any further increase in atmospheric CO2 would make a huge contribution to the well being of planet Earth by the further enhancement of Photosynthesis.
CO2 starvation
- even at the present with the value of 420 ppmv, (a level which is considered by Climate Alarmists to be “excessively dangerous for Global overheating”), the Earth is still in a state of CO2 deprivation when compared to past levels of atmospheric CO2.
- at 420 ppmv Planet Earth is still close to CO2 starvation from the point of view of plant viability and productivity.
- only ~20,000 years ago, at the start of our present warm Holocene interglacial period, that the level of CO2 in the atmosphere had reached ~180 ppmv by the end of the last Ice Age.
- CO2 at 180 ppmv was only ~20% higher than the terminal level CO2 essential for plant Photosynthesis, so, very close to the level for the survival of all Life-on-Earth.
- at a CO2 level of 180 ppmv and Plant life was already under stress with limited viability, especially at higher elevations. CO2 is a much denser gas than air and tends to accumulate at lower elevations.
- however earlier in the Phanerozoic eon, (over the last ~550 million years), atmospheric CO2 concentrations had been even higher, (~8000 ppmv), with no adverse runaway Global warming.
- when plants evolved on land, some 450 million years ago atmospheric CO2 levels were ~5000+ ppmv.
- plant life still much prefers a CO2 rich environment. That is why CO2 is added to commercial Greenhouses at a level ~1500ppmv to promote productive plant growth.
- fortunately, over the earlier years of our current warm Holocene interglacial CO2 concentration rose to ~280 ppmv: This was probably caused by the natural outgassing of CO2 from the gradually warming Oceans.
- that ~100 ppmv increase was from the start of the Holocene Epoch and this growth in the level of CO2 predated any burning of Fossil fuels by Mankind.
- roughly half of any added CO2 released into the atmosphere is rapidly taken up by the Photosynthetic processes of plant life.
- an immediate recent Greening of the Earth is already evident: ~+15% even in the last 50 years, as confirmed by NASA.

- the massive fertilization effect of added CO2 on all plant life as is well evidenced by current increased growth of all vegetation, leaf coverage and vastly improved crop yields.
- this added productivity for all plants includes the essential crops needed to sustain the current World population of ~8 billion.
- this high population level is now sustained by significantly less arable area under cultivation than in previous times.
- a further doubling of CO2 concentration, (Equilibrium Climate Sensitivity), 420–840 ppmv would continue to increase Global Plant productivity but could only have a further ~1% or ~+0.35°C effect on Global temperature.
- a ~1% value for a further doubling of CO2 concentration to 840 ppmv accords closely with the radiation physics assessments of Wijngaarden and Happer.
- at current CO2 rates of increase this beneficial process might take ~170 years.
- at its current level of 420 ppmv, the CO2 Warming effect of CO2 is now well beyond the tipping point where the temperature contribution of increased CO2 had become marginal as its concentration approaches and exceeds 1000 ppmv: the diminution can be seen in the long orange tail of reducing temperature increments in the diagram above.
The temperature contributions of the Methane CH4 and Nitrous Oxide N2O
Oxygen, the by-product of Photosynthesis is ~20% of the atmosphere. The inherent Oxidation chemistry of both Methane and Nitrous Oxide means that they are continuously purged from the atmosphere leaving only minor residues, measured in parts / billion in the atmosphere. Even at those low concentrations Methane and Nitrous Oxide still make a limited but stable combined contribution to Global temperature of ~+0.53°C. That temperature contribution is independent of the level of Carbon Dioxide. Climate Alarmists believe that the continuing release of CH4 and N2O will contribute massively to Global overheating as they are very powerful heating agents. These Alarmists are in error because they do not account for the inherent chemistry of these gasses in the Oxygen rich atmosphere where they react and dissipate so they are only capable of sustaining levels measured in parts / billion by volume. At these low concentrations their heating effect is real but limited to ~0.5°C.
- Methane is continually released with natural gas leakages, leakages from industrial processes, the processes of natural decay, and all forms of organic life: the oxidation of Methane in air is even visible as “wil o’ the wisp” over swampy areas.
- Nitrous Oxide is continually generated by organic decay in the natural Nitrogen cycle, by the partial burning of hydrocarbon fuels and from the 8 million daily lightning strikes.
- as Methane and Nitrous Oxide both react chemically with Oxygen in the atmosphere, they are almost entirely purged: their residual levels remain limited to a few parts / billion in the atmosphere.
- if Methane and Nitrous Oxide were not subject to rapid chemical breakdown, their continual releases would have long since accumulated to much higher levels.
- the much higher warming potentials of Methane and Nitrous Oxide are virtually negated by the extreme dilution of their residues:
- Methane CH4 at 1,900 / 1,000,000,000 – parts per billion, warming influence is ~+0.33°C, of which a small part might be attributed to Man-made emissions. This small temperature increase is immeasurable.
- Nitrous Oxide N2O at 53 / 1,000,000,000 – parts per billion, warming influence is ~+0.2°C, of which only ~+0.1°C, might be attributed to Man-made emissions. This small temperature increase is immeasurable.
- Nitrous Oxide is mainly destroyed in the atmosphere by the action of light in the stratosphere and otherwise by its interaction with Oxygen, leading to a long-term, stabilized contribution to warming of ~+0.2°C over the eons.
- as a result, any further Man-made or natural releases of Methane and Nitrous Oxide are immaterial.
- the consequences of Man-made Methane or Nitrous Oxide releases have been grossly misrepresented and over-emphasized by Climate Alarmists. Such beliefs have acted as the instigator of massive costly and destructive interventions to control these irrelevant Man-made emissions.
- Man-made contributions of extra CH4 and N2O can only have minimal temperature effects that do not justify any policy actions to control their emissions to limit Global warming.
- so, all attempts the control any Man-made releases of Methane and Nitrous Oxide can only be based on fear inducing misinformation.
- this is particularly so, as limiting Nitrous Oxide emissions by reducing the use of Nitrogen based fertilizers, as is being mandated by the European Union, could lead to truly catastrophic losses of agricultural productivity worldwide.
- any limit on the use of artificial Nitrogen based fertilizers will lead to massive famine for billions of the World population. This dire outcome has already been clearly evidenced by the disastrous attempt to return to solely “organic farming” in Sri Lanka.
Water is by far the most significant Greenhouse gas
Adding in the temperature Greenhouse effect of Water as both Water vapor and Clouds and rescaling the earlier diagram shows the comparative insignificance of the minor Greenhouse gasses when set in the overall context of the full ~33°C Greenhouse effect.
The current temperature contributions of the Minor Greenhouse gasses: Carbon Dioxide, Methane and Nitrous oxide are roughly as follows:
- Carbon Dioxide CO2: +~1.9°C: with diminishing effectiveness.
- Methane CH4: +~0.33°C: static
- Nitrous Oxide N2O: +~0.20°C: static
- Water H2O: +~30°C: variable.
Rescaling the earlier diagram and adding in the major impact of atmospheric water, stresses the relative insignificance of future CO2 concentrations and the limited but stabilized future temperature effects of Methane and Nitrous Oxide:
- as the temperature effect of any added CO2 is approaching the saturation there is no longer any risk of gross Global temperature increase arising from Man-made emissions of Carbon Dioxide.
- from now on, (CO2 >420 ppmv), there can be no rational imperative to limit Mankind’s CO2 future CO2 emissions from burning of Fossil Fuels. That restriction will do nothing to protect the World from a non-existent overheating catastrophe nor is there any rationale to pursue any of the policies to reach “Net Zero” in the Western world.
- the sole outcome would be to undermine the successful developed economies of the Western World.
- in any event, all efforts at CO2 emissions reduction now being pursued by Western economies, (only ~17% of the Global population), are rendered wholly pointless in the context of the continued burning of fossil fuels throughout the developing world: notably China, India, Indonesia, the far East and Africa.
- that major part of the World population, (~83%), considers the immediate advancement and the prosperity of their populations to be much more important than any artificial Western fear of probably beneficial global overheating in the far future.
Colder Oceans progressively re-absorb CO2 from the atmosphere
During glaciations, the cooler Oceans are capable of absorbing more CO2 from the atmosphere. Oceanic reabsorption of CO2 has been ongoing at least for the last ~150+ million years, since the start of the Cretaceous period, when atmospheric CO2 levels were ~3000+ppmv. Oceanic marine life, especially plankton and molluscs, naturally sequester CO2 as Calcium Carbonate, to create their protective exoskeletons. Those calcium carbonate deposits are eventually transmuted into limestone rocks, like the white cliffs of Dover, as well as marble and all the other forms of deposited limestone.
During some future 100,000-year glaciation, this inexorable natural process reabsorbing CO2 will eventually result in the termination of all Life-on-Earth as CO2 is progressively sequestered in the Oceans to be deposited as limestones, Calcium Carbonate.
The natural re-absorption of CO2 will eventually result in the atmospheric level of CO2, falling below the ~150 ppmv plant survival level. It was only ~20,000 years ago, at the start of our Holocene inter-glacial global CO2 level was about 180 ppmv: this was very close to that terminal threshold, when Plant Photosynthesis could no longer operate and so plants could no longer survive. Even at the 180ppmv level much of plant life was already severely stressed, especially at higher elevations. It is even conceivable that the by burning Fossil. Fuels and emitting some extra CO2 that Mankind could delay by millennia the CO2 levels reaching the fatal threshold of 150 ppmv.
Conclusions
- from the current CO2 level at 420 ppmv CO2 warming potential is >85% saturated,
- the demonizing of CO2 from Western sources and the Western pursuit of “Net Zero” to prevent a Man-made global overheating catastrophe is a pointless and economically destructive “fool’s errand” for any nation that participates. The World’s developing Nations are bound to continue to use their available fossil fuels to ensure their advancement and indeed their is no reason why they should not continue to do so.
- any attempt by Mankind to remove CO2 from the atmosphere or from the exhausts of fossil fuel burning plant is similarly misguided.
- “Carbon Capture and Storage, (CCS)” can only be characterized as “a costly and energy expensive way of throwing away irrelevant amounts of useful plant food”: the idea could only ever have been promoted by individuals, who had carefully forgotten all their elementary Biology.
- as both Methane CH4 and Nitrous Oxide N2O are purged from the atmosphere by their inherent chemistry, the temperature effect of the residues these powerful Greenhouse gasses is also limited: together they contribute a limited and stable total of ~0.53°C overall to the Greenhouse effect, with ~0.33°C attributable to Methane and ~0.20°C attributable to the Nitrous Oxide.
- this +~0.53°C overall temperature contribution from the residual combination of CH4 and N2O has been stable ever since Photosynthesis took hold and raised the level of Oxygen in the atmosphere over the past billion years.
- the simple fact the Methane and Nitrous Oxide are naturally purged from the atmosphere means that any Green policy ideas of controlling Livestock farming or limiting the use of Nitrogen fertilizers are pointless. They would be destructive to the survival of current civilizations and fatal to their populations.
Never forget:
Sun Tsu’s first art of war:
“The supreme art of war is to subdue the enemy without fighting.”
That is exactly what is happening as Western governments pursue self-harming Green Energy policies. There is no better way to damage Western societies than by rendering their energy supplies unreliable and expensive.
So Green thinking can only be regarded as a continuation of the “Cold War” intended to undermine the viability of the economies of the Western world.
Cui bono Who Benefits ?
and
The late Professor David MacKay:
“the dependence on Weather-Dependent “Renewable Energy” to power a developed economy is an Appalling Delusion”.
There’s so much delusion and I think it’s so dangerous for humanity that people allow themselves to have these delusions that they’re willing to not think carefully about the numbers, the realities, and the laws of physics and the realities of engineering… humanity really does need to pay attention to arithmetic, and the laws of physics.”
Arithmetic? Laws of physics? Engineering? These are all lost on politicians, to our incalculable cost.

References
This short paper sets out the long-term context for the Greenhouse effect and the importance of warmth to the flourishing of all life on planet Earth.
A Brief History of Climate, From Prehistory to The Imaginary Crisis of the 21st Century
Dependence of Earth’s Thermal Radiation on Five Most Abundant Greenhouse Gases W. A. van Wijngaarden and W. Happer https://arxiv.org/pdf/2006.03098.pdf
It is a bit annoying to not give sources for graphs.
The one of the Schwarzschild Equation is presented in a slide at ~ 16:35 by William Happer in the above-linked video. He may not have created it, but, he is clearly adopting it as being accurate.
Waaayyyyy too complicated for the NYT.
The Marmaduke cartoon is waaayyy too complicated for the average reader of the NYT.
Have you given any thought to how glaciation starts? Have you given any though to why interglacials last for around 10,000 years?
The current upswing in the boreal sunlight began around 500 years ago. That marked the termination of the current interglacial. It will be at least 160 years before snowfall overtakes snow melt and the permafrost advances south again. Greenland is the only region currently exhibiting advancing ice in both extent and elevation.
Milankovitch was mostly right. His major failing was thinking that glaciation results from cold weather. Look at the current snowfall trends as the NH warm ups. The cold comes after the land is covered in permanent ice.
Maybe all of the dark particulate matter from EV tire wear will be enough to forestall the next glaciation.
I get the sarcasm. However it brings up a good point.
My concern is that “scientists” who believe the addition of ppm of a non condensing, non solidifying radiative gas to the atmosphere actually does anything will think that humans can prevent glaciation by adding a bit of soot to the atmosphere. They have no idea of the energy involved in producing glaciation and how puny humans really are.
If the residents of anchorage think they saw heavy snow fall this year, they will run out of suitable descriptors for what will come.
Now those would be credible ‘climate refugees!’
Funny that Alaska’s population peaked more than a decade ago.
In the US, a lot of people have been moving south since the South got more urbanized. Many more than have been moving north.
All scientific research concludes that the current warming – faster than at anytime in 100,000 years — is caused mostly by mans burning of fossil fuels and the resulting CO2 emissions equal to about 40 billion tons a year. Each year.
Your own statement shows the current warming has happened before. So it isn’t unusual.
I don’t have time for your stupid word games, Gorman. You know what the statement ‘unusual’ meant.
Total and utter BS of course.
Warming up to the Holocene Optimum was far larger and more protracted than the tiny amount of current beneficial warming
All you are doing is regurgitating fallacies of the AGW-cult mantra.
Because that is all you know.
You still haven’t produced a single paper as evidence that human CO2 causes warming.
And I’m betting you NEVER WILL. !!
“I don’t have time for your stupid word games,”
Stupid, ignorant words is ALL YOU HAVE. !!
There are lots of people smarter and more knowledgeable (less ignorant of certain facts) than I am.
I consider a genuine “scientist” to be one who doesn’t care about the results, even when they prove him wrong, as long as he learns something.
No agenda. No “The Cause”.
Just gaining more understanding. (Sometimes from a correction of a misunderstanding.)
You sound like a “scientist”.
>> As at its current concentration atmospheric CO2 at 420 ppmv is already more than 85% saturated
Is not correct for many reasons.
One is the language, the reader has to guess that the article means the absorption bands near ground level are 85% saturated at that partial pressure (which is also incorrect, for the CO2 bands the saturation is well above 99% at this partial pressure).
The biggest problem in my opinion with statements like above is that as the density of gases reduces with height above ground, so does the medium free path length between the molecules and the average interaction time gets longer.
There always will be a certain height at which additional CO2 means that it gets more likely to thermalize absorbed energy than to re radiate it by emission.
In other words about 12km above ground additional CO2 has a clear and well understood effect (similar to an extra blanket) leading to additional warming at ground level!
In order to promote freedom by clearing up reader confusion possibly caused by the above comment, note:
1.Doubling CO2 decreases heat lost to space from earth by ~ 1%.
Thus,
2. Doubling CO2 results in only ~ .71 C warming (Stefan-Boltzmann) — per Happer in above video around 23:00)
3. Human CO2 is ~ 5% of total atmospheric CO2.
Therefore:
Doubling human CO2 could potentially cause only ~ .04 C warming.
NEGLIGIBLE.
“3. Human CO2 is ~ 5% of total atmospheric CO2.”
Total BS that only stupid people believe
Human CO2 is about 33% of total atmospheric CO2, not 3% or 5%, a conservative myth believed by ignorant people that should never be repeated.
The most basic climate science knowledge is that humans have added a lot of CO2 to the atmosphere (up +50%) and no one was harmed.
If you claim humans have not added a lot of CO2 to the atmosphere, then no one will take you seriously when you try to refute CAGW scaremongering.
I’m sorry if I have hurt your feelings. This is a climate propaganda war and we conservatives are losing. We have to stop shooting ourselves i the foot with the 5% manmade CO2 myth and the there is no AGW myth.
“Total BS that only stupid people believe”
“Stupid is as stupid does.” It’s amazing how often that movie gets quoted here.
Dickie still can’t let the facts get in the way of his AGW-cult LUKEWARMER nonsense.
33%.. you have got to be joking..
Denial that natural sources increase by large amount with warming.. very sad.
Denial that natural sources are about 95-94% of total CO2 flux, so only a small increase in natural emissions easily meets or exceeds human emissions.
Found that paper with empirical scientific evidence of human released CO2 causing warming , yet ?
If you continue with your rabid AGW-Cult CO2 warming rants, no-one will take you seriously… they will continue to laugh at you.
Yes, about a third of the present concentration, an increase from ~280 to ~420ppm. Persistently contributing a gain of 5%/year will do that.
For anyone confused by P Dot, his math is nonsense. It is NOT a matter of human CO2 accumulating at a rate of approximately 5% per year.
*face palm*
WRONG.. since it is a cycle, with only 5% max human contribution…
… and nature LUVS all CO2..
…. nearly ALL of that human released CO2 is absorbed into the carbon cycle.
Had mankind not started burning fossil fuels, the present CO2 levels would still be in the 280ppm range.
Not necessarily. Given (per ice core data), CO2 LAGS temperature by about 800 years, natural warming caused the overwhelming bulk of CO2 rise.
Moreover, natural CO2 sources and sinks, roughly in balance, are 2 ORDERS OF MAGNITUDE (~ 150 gtons v. 6 gtons) greater than human CO2.
Human CO2, if it causes any warming, is, thus,
NEGLIGIBLE*.
* (for R. G.: “Negligible” does not mean “none.”)
no. Simple math shows 50% of the rise in atm co2 is from the burning of fossil fuels. Furthermore, the ratio of carbon isotopes in the atmosphere shows the same.
(And to correct you –, CO2 both leads and lags warming . Two distinct effects. First, the release of Ci2 from warming oceans, and second the increase in the atm greenhouse effect)
“ Simple math”
Which is what you are limited to….
Complex maths and actual isotopic measurements show there is very little fossil fuel CO2 in the atmosphere.
Well, there’s some real maths and plenty of imaginary 🙂
It takes 800 to 1000 years for natural warming to result in increases in CO2 levels. It’s only been 200 years since the end of the little ice age.
1000 years ago, the planet was starting to cool down from the end of the medieval warm period.
Dangerously low.. I like to think we gave the carbon cycle a “kick-start”
Enabled that extra beneficial CO2 above base survivability levels.
The NATURAL warming since the LIA will also have kick-started a lot of CO2 release from land and oceans into the atmosphere.
NATURE LUVS CO2
I would love to see CO2 levels get back above 1000ppm.
However the belief that nature, not man, is responsible for the current increase in CO2 levels is not supportable.
why?
Another dimwit, all fluxed up, as usual
Natural CO2 emissions are offset by natural CO2 absorption in the seasonal carbon flow. Nature does NOT increase the atmospheric CO2 level year over year — only manmade CO2 emissions do.
The atmospheric CO2 increased +140 ppm since 1850 because manmade CO2 emissions were about +250ppm (I add a small amount of emissions for wood burning not ordinarily counted).
If manmade CO2 emissions were about +250ppm
And atmospheric CO2 was up +140 ppm
Then nature must have absorbed 110 ppm gf CO2 (others claim absorption was closer to 50% of manmade emissions)
In fact, nature has been a net CO2 absorber since 4.5 billion years ago when CO2 was at least 1%, and probably much higher. The original atmosphere may have been similar to the atmosphere on Venus.
The CO2 level declined for billions of years to 180 ppm about 20,000 years ago.
The CO2 that was in the atmosphere is nt sequestered as carbon in rocks, shells, oil, gas and coal
I am amazed at how many stupid conservatives there are who can not even figure out that humans increased the atmospheric CO2 level by abut +50% since 1850 (and no one was harmed)
Do you not realize that very close to 100% of climate scientists say humans added a lot of CO2 to the atmosphere? The only exceptions I have found in 26 years of climate reading were three science frauds named Berry, Harde and I forgot the third loser.
I guess bNasty2000 is the third loser
4.5 billion years ago, Earth had a 60-100 bar CO₂ atmosphere. And about 0.8 bar N₂ (as now), And zero O₂.
And none of those life forms is alive today!
Only LOSER here is a fool that can’t follow basic science… that would be YOU, dickie-bot.. the AGW-cult LUKEWARMER.
Still sprouting all the fake AGW memes. !
Sorry you let your scientific incompetence over-ride any rational thought you might pretend to have.
Now.. where’s that empirical evidence of CO2 warming.?
Over 100,000 scientific studies
Almost 100% of climate scientists
And 127 years to refute the original 1896 theory that manmade CO2 is a greenhouse gas
And one stuck on stupid bNasty2000
Please write to Willam Happer and Richard Lindzen and Roy Spencer and John Christy and Judith Curry to tell them they are all fools for believing AGW, and YOU know better.
They are all science Ph.D.’s
You are a Ph.Dumb,
Still no evidence.… so sad. !!
So much bluster.
So laughable 🙂
Oh dearie me… poor dickie.
The Conclusion Humans Drive Atmospheric CO2 Increases Is Undermined By Carbon Isotope Data (notrickszone.com)
Most of the people you call climate scientists are not scientists. They’ve no idea (pdf) how to evaluate the physical reliability of their own data and models.
Nice paper.
Love this quote. It elucidates the difference between amateur statisticians and physical science graduates.
Math majors only see numbers to process on the way to obtaining a desired result. In other words the end result is decided a priori.
Physical science majors see measurements as the defining purpose of their work. Uncertainty is an intricate part of making a measurement that others can rely upon. Uncertainty describes how well a measurement fits into a mathematical equation.
This pretty much defines climate science.
It is an indication that the reviewer has never participated in a rifle or pistol match. I can put 10 shots in the same hole on the 1 ring. Very good precision, but accuracy sucks.
That one was a real killer.
Thanks, Jim. Part of the problem seems to be that most climate modelers seem to have a PhD in applied mathematics. They’ve no training in science at all.
And, I’m sorry to say, most climatologists seem to have no training in physical error analysis. Not even the AGW skeptics.
How do you know that?
Direct experience Warren.
Are Climate Modelers Scientists? | Watts Up With That?
Propagation of Error and the Reliability of Global Air Temperature Projections, Mark II. | Watts Up With That?
Why Roy Spencer’s Criticism is Wrong | Watts Up With That? (A surprise, that one)
And if you bothered to follow the posted links to my assessment of Ken Rice’s criticism — the one you found ever so compelling (but didn’t understand) — you’ll see more of the same.
Summarized here (pdf).
The same lack of training shows up every time I contend with a climate so-called scientist.
Mr. Ms. Mrs. Beeton is a troll. Treat it as such.
I see several links to WUWT sources to support your claims. Do you have any links to peer reviewed journals?
They all recount my direct experience with reviewers, Warren. I have 45 MB of evidence to back it up.
If you want to see for yourself, study Ken Rice’s supposed critique — the one you linked. If you know anything about calibration and physical error analysis, you’ll realize he hasn’t a clue.
“Peer-reviewed” is the inevitable counter-cry of the discomfited alarmist. Garbage consistently passes peer-review (pal-review) in AGW climatology. And the same process excludes good work. With defamation validating corruption for he believers. An example: your propaganda-inspired ire directed at Will Happer.
I laugh every time I read it! A statistician that I hope never designs something that can kill people.
Models have nothing to do with the evidence for global warming
No? Do tell then…
No, models create OUTPUT based on INPUT of physical data taken from the earth and known principles of physics. No scientists ever considers models to be evidence.
Well, that’s a relief! So if the models aren’t considered evidence, what is the basis for curtailing the use of fossil fuels? Note, this is the second time I’ve asked you for evidence.
Note that the evidence is overwhelming and is data taken from the physical word, never models. If you are serious about looking at the evidence, go to AR7, which summarizes current peer reviewed papers that individually contain all the evidence one could ask for.
‘Note that the evidence is overwhelming and is data taken from the physical word, never models.’
Great! I don’t need all of it, just a link of two to any evidence that our emissions of CO2 have caused catastrophic warming in the past, or will do so in the future. PS – you’ve already ‘ruled out’ the models, so suggest you look elsewhere.
“known principles of physics”
actually… NO THEY DON’T.
They are absolutely woeful on many aspects of atmospheric physics. !
Really? What cloud physical data is entered into the models? What enthalpy physical data is entered into the models? What ocean current physical data is entered into the models? Do I need to go on?
You don’t know how models work? Every engineer and scientist uses them. Are you neither?
Talk about not answering questions!
You are so interested in everyone’s bona fides. Tell us your degree and what subject.
Since you’re neither an engineer nor a scientists, i’m not interested in your resume, which is likely a blank sheet of paper.
Why don’t you answer with your bons fides?
I’ll give mine so you won’t feel bad.
I have a BSEE issued in 1973 from the University of Kansas.
Now let’s see your claim to fame.
They must not have a very good prof in solid geometry
Your response just confirms what myself and everyone else has already determined from your troll comments.
Why are you embarrassed to let everyone know what your education level is? It is nothing to be ashamed of.
But it does make your ad hominem comments about other’s education ring false.
Models project warming, based upon the assumption of radiation physics über alles. Then, all the data is forced to fit the assumption.
It’s a classic of subjectivist narratives, but uniquely decorated with mathematics.
A perfect cover for scientific naifs unable to distinguish an artful pseudoscience from the real thing.
Might be, but models are not evidence of warming
Not might be. Is.
And the global air temperature record is so ridden with uncertainty it can tell us nothing about the rate or magnitude of warming since 1850.
The only consistent evidence we have that the climate has warmed since 1850 is that the growing season is longer and the northern treeline has advanced some toward the pole.
And still, it’s not reached the northern latitude achieved during the 900-1300 Medieval Warm Period.
Try telling Michael Mann, Gavin Schmidt, or Jim Hansen that the global temperature record is too uncertain to tell us anything about the rate or magnitude of warming since 1850.
Your scientific competence has long been in doubt, Mr Frank. That uncertainty has now been removed by your performance on this forum.
You’re not fit to judge, Warren.
Tell you what dude, examine NIST TN 1900. You can get it here. https://nvlpubs.nist.gov/nistpubs/technicalnotes/nist.tn.1900.pdf
Tell us what NIST found for reproducability uncertainty of a monthly average of Tmax in Example 2.
Then tell us how you would propagate that uncertainty into an anomaly calculation. Then onto an average of anomalies.
You might want to read JCGM 100:2008 Section B.2.16. You should pay careful attention to Note 3.
Tell us how “Michael Mann, Gavin Schmidt, or Jim Hansen” have followed NIST guidance for calculating reproducability uncertainty in their results.
Don’t just tell us to read their works. You have obviously done the research to validate their work or else you would be guilty of the argumentative fallacy of Argument From Authority. That would make your references worthless.
I responded to this absurd claim by PT:
“And the global air temperature record is so ridden with uncertainty it can tell us nothing about the rate or magnitude of warming since 1850”
Mann, Schmidt Hansen and many others are now rolling in the aisles.
That isn’t an answer to my question and only displays your ignorance.
If you can’t answer this question, you are simply quoting an article of faith. That isn’t science.
Your prejudicial dismissals are not a response, Warren.
The published uncertainty of the GMST is smaller than thermometers can measure. That advances a physical impossibility.
And yet, “Mann, Schmidt Hansen and many others” have made that serious mistake. They’d all fail sophomore analytical chemistry.
You don’t understand the use of temperature anomalies to reduce systematic error? And instead of attempting to understand , you claim that scientists who employ this technique are ‘making mistakes’? You do realize that the concept is part of freshman level statistics, and used throughout many scientific fields, right? Or are you simply captive to another Denier talking point?
Learn some metrology or continue to be ignorant.
From:
https://www.researchgate.net/publication/1980683_Systematic_Errors_facts_and_fictions
In other words, statistics won’t help analyze a common systematic uncertainty.
From Dr. John R Taylor, An Introduction to Error Analysis, Page 93.
Anomalies can not, in any shape or fashion be used to reduce systematic uncertainty. Systematic uncertainty exists within each measurements of temperature. It is a constant and the only way to reduce it is through careful calibration and correction tables.
Anyone who says systematic uncertainty can be found and corrected via a statistical analysis of measurements does not understand metrology or statistics.
If a thermometer is off by a degree every reading will contain that same offset and no statistical analysis of repeated measurements will ever detect it.
“When a new paper comes along that claims that the entire climate science community has been doing it all wrong, and claims that the uncertainty in global temperature records is so large that “the 20th century surface air-temperature anomaly… does not convey any knowledge of rate or magnitude of change in the thermal state of the troposphere”, you can bet two things:
The scientific community will be pretty skeptical.The contrarian community that wants to believe it will most likely accept it without critical review.We’re here today to look at a recent example of such a paper: one that claims that the global temperature measurements that show rapid recent warming have so much uncertainty in them as to be completely useless. The paper is written by an individual named Patrick Frank, and appeared recently in a journal named Sensors. The title is “LiG Metrology, Correlated Error, and the Integrity of the Global Surface Air-Temperature Record”. (LiG is an acronym for “liquid in glass” – your basic old-style thermometer.)
Sensors 2023, 23(13), 5976
https://doi.org/10.3390/s23135976
Patrick Frank has beaten the uncertainty drum previously. In 2019 he published a couple of versions of a similar paper. (Note: I have not read either of the earlier papers.) Apparently, he had been trying to get something published for many years, and had been rejected by 13 different journals. I won’t link to either of these earlier papers here,, but a few blog posts exist that point out the many serious errors in his analysis – often posted long before those earlier papers were published. If you start at this post from And Then There’s Physics, titled “Propagation of Nonsense”, you can find a chain to several earlier posts that describe the numerous errors in Patrick Frank’s earlier work.
Today, we’re only going to look at his most recent paper, though. But before we begin that, let’s review a few basics about the propagation of uncertainty – how uncertainty in measurements needs to be examined to see how it affects calculations based on those measurements. It will be boring and tedious, since we’ll have more equations than pictures, but we need to do this to see the elementary errors that Patrick Frank makes. If all the following section looks familiar, just jump to the next section where we point out the problems in Patrick Frank’s paper.
Spoiler alert: Patrick Frank can’t do basic first-year statistics.”
Full text: https://skepticalscience.com/frank_propagation_uncertainty.html
You can’t even critique a paper properly.
Let’s look at some errors in your reference paper.
Tell us how you get a standard deviation with just one measurement?
This is so far out it is laughable.
This only tells you the difference between the two random variable data entries. It has absolutely nothing to do with THE MEASUREMENT UNCERTAINTY OF temperature measurements in system 1 or THE MEASUREMENT UNCERTAINTY OF temperature measurements in system 2.
Your “source” is obviously a simple statistician that has no idea what a measurand is or how to calculate measurement uncertainty.
He doesn’t even bother to define a measurand, such as a monthly average of system 1 or system 2.
Read NIST TN 1900 Example 2 for a tutorial.
Read this section from NIST Engineering Statistics Handbook.
https://www.itl.nist.gov/div898/handbook/mpc/section4/mpc432.htm
No wonder you can’t get published.
Your usual blind appeal to authority, Warren. You’ve no idea what you’re talking about. As a result, you trot out one garbage analysis after another.
Bob Loblaw, jg was no better than the others. Full take-down here.
In the whole of AGW-inspired climatology, no one pays any attention to physical data quality. Not the modelers. not the temperature-collectors. They accept their numbers at face value. Big big mistake. And obvious to anyone who looks deeper than does a dilettante.
Steve McIntyre said it best, when he was exposing the crock that is tree-ring proxy air-temperature reconstructions (paraphrasing): these people are so incompetent that a scientist of ordinary ability can disprove their work.
so the only website that will accept your ‘takedown’ is NoTricksZone. In addition to 13 rejections by p r journals, that confirms the ludicrous nature of your ‘expertise’, doesn’t it?
Wrong answer, Warren. Papers get judged on their independent merits.
NTS invited the response, which I’d already written. SkS is known for being science cowards, They disallow debate. My response explodes Bob Loblaw jg’s essay for the unscientific rant it is.
All your arrows are limp spaghetti, Warren. You offer nothing but heated bluster.
LiG Met was accepted after one round of review. Propagation… was accepted after three rounds, upon the attention of an editor possessing scientific integrity and two highly competent reviewers.
Competence and integrity. Traits missing from everything you’ve posted here.
Your whole schtick is that measurement uncertainty of temperatures is very, very small as shown by a multitude of papers. You should then be able to assess how they were able to achieve such remarkably small values. Let’s check how well you can assess their findings versus what NIST shows for uncertainty in actual temperature recordings..
Your knowledge of what is being discussed will show in your answer. If you show no math, you are ignorant of the process of measurement uncertainty and its propagation. Consequently, any reference based on faith rather than computations belies your ability to accurately assess what is correct and what is not.
Here are 22 daily temperatures used by NIST in their TN 1900. Why don’t you show us how to calculate the reproducibility uncertainty of the measurand “monthly average”.
18.75 28.25 25.75 28.00 28.50 20.75 21.00 22.75 18.50
27.25 20.75 26.50 28.00 23.25 28.00 21.75 26.00 26.50
28.00 33.25 32.00 29.50
Also, NIST made the assumption that measurement uncertainty of daily temperatures was negligible to simplify their example. What would you use as the single measurement uncertainty for an ASOS station?
These may also help you.
2.5.3.1.1. Type A evaluations of time-dependent effects (nist.gov)
2.4.3.3. 3-level nested design (nist.gov)
I look forward to your actual calculations as a display of your knowledge about what you are critiquing.
I look forward to the publication, in a peer reviewed scientific journal, of your paper and your claims that contradict 130 years of atmospheric physics.
Those who can do, those who can’t just ad hominem like a clown!
🤡🤡🤡🤡🤡🤡 How many more clowns are you going to earn?
So, given your own standard, incessantly repeated here, we can all declaim, along with you, that none of your own ideas have any merit because you have no publication, in a peer reviewed scientific journal, of your [stupid ideas] and your claims that contradict 2500 years of the scientific method (invented by Thales of Miletus).
None of Jim’s claims contradict atmospheric physics. Rather, climate modelers (and you) make a mockery of atmospheric physics. And in so doing, they (and you) betray every bit of scientific ethics.
The only charitable grace is that (like you), they’re not competent to evaluate the physical reliability of their own data and models.
My ideas are the same as those in the body of peer reviewed mainstream science, which you’ve announced you reject — eg, “there is no discernible global warming occurring’ — and other gems that put you solidly into the most extreme class of science Deniers. And then you double down by announcing that ‘none of Gorman’s claims contradict atmospheric physics- – by which I assume you mean you accept his claim that the atmospheric Greenhouse Effect does not exist, even though it’s foundational physics and has been known for 130 years and accepted worldwide throughout the scientific community.
You both seem to be hangers-on in the fringes of science, and your own attempts to publish in scientific journals have led to rejections by scientific journals and damning reviews by Ken Rice and others. It’s difficult to see how anyone with such notions of the physical world as you and Jim Gorman share could do much better than write for WUWT and NoTricksZone.
“My ideas are the same as those in the body of peer reviewed mainstream science,”
No, they’re not. Consensus climatology violates the standard methodology of science. However, the mindless vacuity you call your ideas do not attain even that standard.
“eg, “there is no discernible global warming occurring’”
Not my words. Your lie.
“you accept [Jim Gorman’s] claim that the atmospheric Greenhouse Effect does not exist”
Jim didn’t mention greenhouse once in this thread.
“damning reviews by Ken Rice and others”
Reviews revealing sophomoric ineptitude and that, in any case, you are unable to understand and unqualified to judge.
You claim an Engineering Masters (pdf) and yet are unable to appraise calibration and physical uncertainty. How did that happen?
Your efforts here are meritless bombast, Warren.
“It’s difficult to see…”
Perfectly describes your perception of science.
You claim “numerous papers” in your biography (pdf). Also here, (pdf) with identical wording. But a google scholar search turns up only one from 2003.
Care to explain the contradiction? Surely not a self-serving embellishment!
Show me where I said the Greenhouse Effect does not exist. If you can’t, then you are creating a falsehood, kind of like the “hallucinations” some of the current AI systems. Since you claim to be human, guess what that makes you?
CO2 can impart energy into the atmosphere via collisions with N2, O2, H2O, etc. This raises the temperature of the atmosphere. That is your “Greenhouse Effect”.
However, “back radiation” toward the surface WILL NOT raise the temperature of the surface of the earth. That is impossible due to the 2nd law of thermodynamics. This means your conceptual understanding of the Greenhouse Effect is faulty.
You appear to be incapable of discussing the mathematical basis of physical phenomenon nor the internationally accepted determination of measurement uncertainty.
You declined my request of you to show how you would calculate measurement uncertainty of monthly average temperature as shown by NIST through complete silence. Why is that? Here is the question again.
If you are the Warren Beeton with a Masters of Engineering, then I know you have had many high level laboratory classes in physics, chemistry, and your Bachelor’s area of expertise. I know that measurement uncertainty is taught in these classes and that it is a fundamental part of passing the lab. Yet you appear either unable or unwilling to discuss the subject using simple mathematical concepts.
Your simple posting of papers without using the mathematical treatments included in them does not speak well to your understanding of what is being discussed. It only confirms your FAITH in consensus pseudoscience.
What is the formula for the uncertainty in a sum or difference, Warren.
Or for the uncertainty in a mean?
Given (A±a + B±b) – C±c = D±? How is ‘d’ calculated?
If you knew them, you’d know that taking anomalies increases uncertainty.
See Section 3.1.1. Resolution in LiG Met; the sentence beginning, “In constructing an air-temperature anomaly,…”
I’ve done the work. And you criticize in ignorance, Warren.
Your ignorance of temperature anomalies — basic math and physics — continues to astound.
🤡🤡🤡triple clown show!
How would you know. Warren? You know nothing of either.
Physical models provide the interpretative context. Absent models, there’s no explanation.
Absent climate models, there’d be no matrix to assert that our CO₂ emissions are warming the climate. Because nothing unusual is occurring.
And climate models have no predictive value.
you haven’t even bothered to check the numerous analyses of model performance, which show they accurately project current warming.
Yes, I have. In detail.
As you are evidently incapable of competent judgment, you should not judge.
A predatory journal. Were you unable to get your paper accepted in a reputable peer reviewed journal, Mr Frank?
Wrong answer, Warren. Any paper stands on its own merits. Let’s see you find a mistake.
You’re the guy who argues from authority. My reviewers are named. Suppose you look them up.
A predatory journal. Were you unable to get your paper accepted in a reputable peer reviewed journal, Mr Frank?
First, the proper honorific is Dr. and not Mr.
Second, only fools judge a paper by where it is published rather than by its content.
Your comment tells everyone that you are unable to assess the paper’s content and make cogent criticisms. It is appalling that you you do not have the expertise to make a valid case for refutation.
Mr is more appropriate in your case.
And when someone can’t get published, except in predatory journals, there’s usually a good reason.
🤡🤡 double clown show! Is that all you’ve got!
“except in predatory journals,”
How about Nature, Warren. I co-authored a paper published there. Now predatory by association with me?
Analytical Chemistry. Now predatory?
Inorganic Chemistry. Now predatory?
I have dozens more examples.
You’ve a special case of foot-in-mouth disease, Warren. You continually bluster off though knowing nothing. Never learning to have your facts before holding forth.
Wrong answer again, Warren. Any paper stands on its own merits. Let’s see you find a mistake.
You’re the guy who argues from authority. My reviewers are named. Suppose you look them up.
“Any paper stands on its own merits”.. Spoken like a true incompetent, Frank. No one can judge you. Why you even write your own reviews!
🤡🤡🤡🤡🤡🤡🤡🤡. You are up to eight clown statements. Are you going to go for ten?
On what should a science paper stand but its merit, Warren?
Explain your double-secret judgmental standard.
“No one can judge you.”
My work is subject to competent judgment. My work is not my person. One would think even you could parse that distinction.
“Why you even write your own reviews!”
Display an example or stand revealed as lying.
Let’s note that you, purported holder of a Masters in Engineering, passed in silence a challenge to supply the formula for the uncertainty in a sum.
In summary:
In short, Pat Frank exhibits one of the most astounding cases of Science Denial and Dunning-Kruger syndrome ever seen among Science Deniers.
🤡🤡🤡🤡🤡🤡🤡. More clown posts. When are you going to stop?
1) “Pat Frank claims there is no discernible global warming occurring,”
A lie.
2) “Pat Frank claims that as a result of his own statistical analysis, ‘back radiation’ and the Atmospheric Greenhouse Effect can’t possibly work,”
Another lie.
3) “Pat Frank can’t get his statistical or climate papers published in reputable scientific journals”
My pre-publication reviewers are first rank scientists. The 13 sets of other reviewers were not, as proved by their own words.
4) “Ken Rice and B Loblaw, among others, tear apart his junk papers.”
Rubbish proved to be incompetent rubbish and incompetent rubbish. You merely demonstrate a complete inability to assess technical debate and a dishonest fixation on partisan.
“No one with relevant expertise comes to Frank’s defense.”
Many have, actually. You’ve been arguing with some of them here. Not that you’d ever admit the competence of anyone who dared disagree with you.
In any case, the work defends itself.
5) “Pat Frank posts a defense of his work, written by ..wait for it…Pat Frank! And published in ..wait for it…NoTricksZone!!”
Refuted by no one. Including you. Pierre Gosselin is an honorable man.
“In short, Pat Frank exhibits...” blah, blah, blah.
Your every post is a rant, Warren. You display zero understanding of data analysis; zero affinity for rational argument; zero grasp of facts or science; zero responsive intelligence.
And a manifest partisan fixation consistent with the pathology of cognitive rigidity, the hallmark of the ideological extremist with a bent to authoritarianism.
Hmm. I don’t seem to recall your peer reviewed paper overturning the last 50 years of climate research, Mr Frank. But maybe I missed it. Could you cite your paper so we could read it?
.
Propagation of Error and the Reliability of Global Air Temperature Projections
Negligence, Non-Science, and Consensus Climatology
Systematic Error in Climate Measurements: the global air temperature record
LiG Metrology, Correlated Error, and the Integrity of the Global Surface Air-Temperature Record
https://skepticalscience.com/frank_propagation_uncertainty.html
“We’re here today to look at a recent paper that claims that the global temperature measurements that show rapid recent warming have so much uncertainty in them as to be completely useless. The paper is written by an individual named Patrick Frank, and appeared recently in a journal named Sensors. The title is “LiG Metrology, Correlated Error, and the Integrity of the Global Surface Air-Temperature Record”. (LiG is an acronym for “liquid in glass” – your basic old-style thermometer.)
Sensors 2023, 23(13), 5976
https://doi.org/10.3390/s23135976
Patrick Frank has beaten the uncertainty drum previously. In 2019 he published a couple of versions of a similar paper. (Note: I have not read either of the earlier papers.) Apparently, he had been trying to get something published for many years, and had been rejected by 13 different journals. I won’t link to either of these earlier papers here,, but a few blog posts exist that point out the many serious errors in his analysis – often posted long before those earlier papers were published. If you start at this post from And Then There’s Physics, titled “Propagation of Nonsense”, you can find a chain to several earlier posts that describe the numerous errors in Patrick Frank’s earlier work.
Today, we’re only going to look at his most recent paper, though. But before we begin that, let’s review a few basics about the propagation of uncertainty – how uncertainty in measurements needs to be examined to see how it affects calculations based on those measurements. It will be boring and tedious, since we’ll have more equations than pictures, but we need to do this to see the elementary errors that Patrick Frank makes. If all the following section looks familiar, just jump to the next section where we point out the problems in Patrick Frank’s paper.
Spoiler alert: Patrick Frank can’t do basic first-year statistics.”
Full text: https://skepticalscience.com/frank_propagation_uncertainty.html
Incompetence already exposed.
Evidently, you never learn, Warren.
Stupidity has no bounds!
Where is your substantive argument, bnice2000?
You have presented zero to bother with.
Let’s see you debunk this science by a real scientist: https://www.realclimate.org/index.php/archives/2007/06/a-saturated-gassy-argument/
“Let’s see you debunk this science…”
Radiation physics is not a valid physical theory of the terrestrial climate, Warren.
Right here: “As we have seen, in the higher layers where radiation starts to slip through easily, adding some greenhouse gas must warm the Earth regardless of how the absorption works.” is where Spencer Weart makes the physically unjustifiable jump.
His conclusion was not a deduction from a falsifiable physical theory of the climate. He made an inference from the radiation physics of CO₂. One that assumes ceteris paribus — nothing else changes.
Concluding from inference is not valid science. It’s not science at all.
Dr. Weart mentioned Gilbert Plass’ detailed calculations from radiation physics. He did not mention, however, that already in 1963, Fritz Möller engaged Plass and refuted the conclusion of inevitable warming,
Because applying ceteris paribus to the climate is a fatal mistake.
Here’s Möller in his own words, from 1963: “The more important consideration of my paper is, in my opinion, the review at the end of the article which shows how strongly other meteorological elements, e.g. cloudiness, influence the radiation balance and that a disturbance of radiation equilibrium caused by a change in the CO₂ content can and may be compensated without any change of temperature. I am glad to take from Plass’ concluding remarks that he acknowledges this point.”
The take-home message is two-fold.
1) Spencer Weart was scientifically careless (as are all the authors at RealClimate).
2) We have no idea whether FF CO₂ emissions will warm the climate.
And just to add. All available meteorological data show that the climate is doing nothing unusual.
You make basic mistakes that even a college freshman wouldn’t:
a) ‘Radiation physics is not a valid physical theory’ Radiation physics is a Scientific field of study, not a theory!
b) ‘Adding GHGs must warm the earth is an unjustifiable jump’ If you can’t understand that simple logic, then you should redo your freshman physics — or did you take any at all?
c) Plass’ remarks do not refute the validity of Pierrehumbert’s conclusions, which are the same as those of the last 130 years of scientific research
d) Your conclusion that Weart was scientifically careless has no basis
d)” We have no idea whether FF CO2 emissions will warm the climate’ is contradicted by all scientific research. Are you completely ignorant of the findings of those last 130 years?
e) ‘All available meteorological data show the climate is doing nothing unusual.’ An astounding statement for someone who is passing himself off as a scientific authority.
‘a) ‘Radiation physics is not a valid physical theory’ Radiation physics is a Scientific field of study, not a theory!’
Your first ‘response’ was to a point not actually stated. Ditto for the rest of your responses. Forget it Warren, you’re beaten.
Replying in the same spirit:
a) wrong
b) clouds
c) Dyslexia. It was Fritz Möller. Yes they do.
d) Weart inferred his conclusion. Unscientific.
d’) No it’s not. There is no valid physical theory of the terrestrial climate.
e) Astounding to you, but a fact. You may wish to consult WUWT’s “Everything Climate” page.
Still invested in remunerative environmentalism, are you?
You are a clueless troll that has no knowledge of the subjects on which you speak.
CO2 only stays in the atmosphere for around 4 years before either the plants take it up or it gets dissolved in the oceans.
Individual CO2 molecules have an atmospheric lifetime measured in a few days. But when atmospheric CO2 concentration is increased, it takes hundreds of years for the concentration increase to be reabsorbed and return atm CO2 ppm to its original state.
Argument via consensus is not a scientific argument.
Just in case dickie-brainless doesn’t see this elsewhere.
The Conclusion Humans Drive Atmospheric CO2 Increases Is Undermined By Carbon Isotope Data (notrickszone.com)
Let the blustering and tantrums ensue !! 🙂
explain to us where you think the additional 40 billion tons of annual co2 emissions has gone? What does the scientific research say about it?
Measured science.. get over it numb-brain. !
The photo-synthesizers are certainly happy about it.
You understand, don’t you, that photosynthesis turns off at 120 ppm CO₂, and at 80 ppm the entire floral ecosystem collapses. Everything then dies except anaerobic bacteria in anoxic spaces.
“You understand,”
NO, the beetroot most definitely DOES NOT understand…
… anything to do with science, maths or climate.
Richard I did this for you awhile back, but one more time.
There is about 3000 giga tonnes of CO2 in atmosphere. Of that about 950 giga tonnes is probably human in origin.
So of the total in atmosphere about 3.2% is human.
It has been estimated that 2,400 gigatons of CO₂ have been emitted by human activity since 1850, with some absorbed by oceans and land, and about 950 gigatons remaining in the atmosphere.
total weight of CO2 in the atmosphere is ~3,208 Gt CO2.
So 950 GT remaining out of 3208 in the atmosphere is 30%, not 3,2%.
Bad math.
“So of the total in atmosphere about 3.2% is human.”
So now you have been seriously wrong twice and have no idea what you are talking about
Either almost 100% of actual climate scientists are wrong, and you are a genius
Or almost 100% of actual climate scientists are right, and you are a fool.
My judgement:
You are a fool.
Your fool’s judgement is meaningless.
Still waiting for actual empirical evidence of warming by human CO2..
…. waiting .. waiting
950/3000 is 32% of anthropogenic origin, not 3.2%.
Funny how everything you disagree with is a ‘conservative” myth.
Even when you accidentally get something right, your innate offensiveness means nobody pays you any attention.
I find his comments helpful as I can speed through the comments faster by skipping over them as they add nothing to the main post. As I’ve said before there are a lot of hobby horses ridden at this rodeo.
Lots of science cotent in that nastygram
“Lots of science cotent …… ????”
Basically NONE in most of yours. !
Maybe yes, maybe no. However if everyone skips over your posts because they tire of your nastiness, then the only one who benefits is you. Who apparently get an emotional thrill out of belittling those who disagree with you.
No body pays me attention?
You just contradicted yourself
You paid attention.
Only for that slap-stick comedy act !
It is great for a laugh. !
Did you say something?
Dickie is a closet AGW-cultist/LUKEWARMER..
… who occasionally pokes his little mind out of his closet.
He’s also a closet trendologist.
I’m a lukewarmer, though I’ve never been much for closets.
When Human CO2 declined by 6 percent in 2020, at the start of the pandemic, when there were lockdowns and businesses that dealt with large numbers of people, like restaurants, closed, the increases in CO2 didn’t change a bit.
https://www.co2.earth/monthly-co2
That’s because human contribution to the rise in atmospheric CO2 is actually quite small.
A decline of 6% from a contribution of 5% leaves 4.7%… well within the margin of error.
Interesting new study finds no isotopic evidence of fossil fuel CO2
The Conclusion Humans Drive Atmospheric CO2 Increases Is Undermined By Carbon Isotope Data (notrickszone.com)
First off, it only declined by 6% for a couple of months. The rest of the year the decline was a lot less.
CO2 levels are increasing by about 2ppm per year.
A 6% (or less) decrease in 2ppm is not noticable.
Fact. Known by such climate ignoramuses as Richard Lindzen, William Happer, and Murry Salby.
Dickie won’t like this.. 🙂
Prepare for yet another blustering science-free tantrum. 🙂
The Conclusion Humans Drive Atmospheric CO2 Increases Is Undermined By Carbon Isotope Data (notrickszone.com)
Good for you. Now take it another step: what does scientific research estimate as the effect of this 50% CO2
increase on global temperatures
Scientific research has scientists on both sides of CAGW. Your claim is based on consensus science, better known as psuedoscience. The church practiced consensus science with geocentric science. One man, although punished for heresy, upset that apple cart. Those who fail to learn history are doomed to repeat it, so be careful about what you stand behind.
after you’ve vented about that bugaboo of scientific research, now tell us what it says.
The science shows that an increase of 50% in CO2 concentrations would result in a temperature increase of a few tenths of a degree. Way too little to be noticable.
No, wrong. The scientific research shows a range of climate sensitivity from 2 to 4.5C for a doubling of CO2 concentration . What is your scientific source for a much smaller number?
Poor beetroot..
Science research shows no such thing.
These are estimates using erroneous models and assumptions. NOT SCIENCE
They bear no resemblance to actual energy movement in the atmosphere.
The most recent scientific estimates are fora range of 2.6 – 3.9C. Do you agree, or are you still trying to justify some mysterious set of numbers thatno one else knows about?
Again, based on radiative fallacies only
You really are MORONIC if you think radiation is the only movement of energy in the atmosphere. !
Now, do you have any empirical scientific evidence of warming by human CO2.
Or are you just going to continue waffling mindlessly !
“12km above ground additional CO2 has a clear and well understood effect 12km above ground (similar to an extra blanket)”
Where the **** did you come up with that nonsense.
Have you been taught by John Kerry !!
Do you have any measurements of this “extra blanket” [lol] ?..
Your logic appears to be faulty. As you increase height, the density of the whole atmosphere decreases. That doesn’t make it more likely that thermalization will occur. In fact, it increases the probability of emission.
Oops, maybe I wrote it wrong,
and
>> me “reduces the medium free path length with height above ground
>> Jim Gorman “it increases the probability of emission.”
>> Jim Masterson “I think the opposite is true.”
Of course both Jims are right.. lol how could I make so many mistakes in a few sentences..?
Thx for reading and commenting!
Yes, at “great height” additional CO2 will re-radiate (in all directions) and NOT thermalize (much) resulting in MORE radiation towards the surface.
>> bnice2000 Where the **** did you come up with that nonsense.
Aww, I falsely reversed the main argument, but after correction these facts are hardly controversial. Just look up the elementary wiki pages to get a most basic understanding on absorption, thermalization and emission.. it´s really not complicated, you can learn it too!
>> .Janice Moore: Doubling CO2 decreases heat lost to space from earth by
No, this is a process geared towards equilibrium! However the atmosphere changes, the long term emission is equal to the absorption (plus energy generated on earth, natural radioactive decay mostly)
“. . . the elementary wiki pages . . . .’
That’s not a good look for you either. Wiki is the the final, definitive authority on “climate nonsense.” Find another source.
wiki. edited by very ignorant agw-cultists and mal-informers like that cretin W. Connelly and others.
Most of what wiki says about “climate” is just AGW mantra garbage.
I’d trust wiki to be correct on 2+2=4.
Maybe even some historical events. (The Axis lost WW2.)
Beyond that, a shaker full of salt is required.
(Give it 10 years and the Axis won WW2. So today we need to stop (what we call) the Facists from winning!)
“I’d trust wiki to be correct on 2+2=4.”
You’d only trust them because you already know that 2+2=4. In 1984, O’Brien made Winston Smith believe that 2+2=5. It’s interesting that you picked an obvious relatable example to the 1984 novel.
“to get a most basic understanding on”
Apparently you have gained a LOT LESS THAN a basic understanding. !!
More like a ZERO understanding. !
You need to get well up into the mesosphere before CO2 reemission becomes something to talk about. Remember, at sea level CO2 is about a millions times more likely to give up absorbed energy via kinetic collisions (~10-20 nanoseconds) vs reemission (~10-20 milliseconds).
However, it is irrelevant. Kirchhoff’s Law tells us that absorption is limited to emission rates. Doesn’t matter if it is direct reemission or excitement from a collision. The ratio will change as you go higher.
The other big problem with your claims is they ignore the fact that more CO2 also leads to more emissions. Climate alarmists only look at absorption (which is what you did). Yes, there is more absorption but there is also more emission. The two increase proportionately. Hence, no change in the amount of OLR.
The only change is due to a slight increase in absorption at the edges of the CO2 absorption bands. This is what leads to a potential temperature increase. However, that is nullified by CO2 inducing increased evaporative cooling at the surface of a similar magnitude.
>> Richard M “You need to get well up into the mesosphere”
No, but of course it is always not trivial
https://scienceofdoom.com/2010/04/18/stratospheric-cooling/
My 12km height is well referenced there, which would be the lower Stratosphere!
>> bnice2000 and others “Most of what wiki says about “climate””
Has nothing to do with my post, read again!
Wiki is a good tool to learn basic science, of course critical thinking help too!
>> me “Just look up the elementary wiki pages to get a most basic understanding on absorption, thermalization and emission..”
Kindly point to political motivated statement in either of those pages!
SoD gets almost everything wrong because he doesn’t understand the evaporative cooling at the surface.
https://tropical.atmos.colostate.edu/Includes/Documents/Publications/gray2010_ams.pdf
Poor fella doesn’t know the history of the fakery of climate matters on wiki.
Silly child think it can educate itself about absorption, thermalization and emission from wiki pages….. Hilarious. 🙂
“resulting in MORE radiation towards the surface.”
Of very low intensity.
“. . . as the density of gases reduces with height above ground, so does the medium free path length between the molecules . . . .”
I think the opposite is true.
The opposite is true. CO2 is a radiator of heat. The heat absorbed by CO2 needs to be captured by a poor radiator like N2 if it is to store the heat. As you go up in height, volumetric heat capacity is reduced giving CO2 more time to radiate heat to space.
You’ve got it backwards. Collisional decay is orders of magnitude faster in the troposphere than radiative decay.
Above ~12 km, low density means a lower rate of gas collisions. CO₂ radiative decay comes to dominate the physics. But the “downwelling” radiation (~50%) is so low intensity as to do nothing.
The supposed “greenhouse” works by increasing the height at which long-wave radiation is lost to space — the 255 K radiative surface. The steady lapse rate then means the surface must be warmer.
But we have no valid falsifiable physical theory of the climate. That means no one knows whether the lapse rate effect operates in fact. Small changes in cloud cover could obviate any sensible warming. But no one knows.
The whole of global warming alarm assumes ceteris paribus — nothing changes except atmospheric CO₂. Not to mention the molasses atmosphere needed to keep climate simulations from diverging. It’s all false precision and artful pseudoscience.
Also, Hi Janice! Nice to see you here. 🙂
Why don’t you tell us the natural causes of warming after 1975, in your opinion, since you appear to be dismissing all manmade causes?
Those would be the same natural causes of warming as before 1975, Richard. It’s not complicated – warming has happened in the past due to perfectly natural cyclical causes and that has never changed.
Apart from localised urban and land-use-change warming…
… do you have any evidence at all of human caused “global” warming ?
You have, so far, been totally unable to present any.
You have had many opportunities… and FAILED.. every time.
I’m not dismissing human causes, Richard. My position is that no one knows. There’s no valid and explanatory physical theory of the terrestrial climate.
Absent a theory, the data show nothing unusual is happening.
No one knows? Sorry, but all climate researchers know.
Climate researchers continually prove themselves UTTERLY CLUELESS
Which is why gormless twits like you remain so utterly clueless.
No, they don’t.
See also.
And.
Stop passing yourself off as a scientific authority. You are utterly ignorant of science.
“You are utterly ignorant of science.”
Ignorant of science? Then how did this happen?
Did you notice the name of the author on the three peer-reviewed papers linked above?
Really Warren, you keep shooting yourself in the foot with your talking-points-only pistol.
Cite just one peer reviewed paper that disagrees with AGW. Just one. But you cannot. They don’t exist
Möller, 1963
Soon, et al., 1999
Soon, et al., 2001.
Anagnostopoulos, et al., 2010
Frank, 2019
Koutsoyiannis, et al, 2021
And that doesn’t exhaust the list.
A major fail by you:
Moller is a letter/article, not a scientific paper!
Soon and Balliunas published in a predatory pay to publish journal, not in reliable scientific journals (no wonder –no reputable journal will publish anything by these two frauds)
The last three papers are about models, not about whether or not rising CO2 causes modern day warming.
Keep trying
Wrong answer, Warren. Ignorant dismissals do not constitute an argument.
You’re very free with slanderous dismissals of first-rate scientists. Yet one more sure sign of self-righteous ignorance.
And just to add, Möller’s paper was the last comment of a longer debate. But you didn’t bother to do the research, did you.
Blah, blah, blah, Warren. That’s all you’ve got.
You’re not fit to judge science. You’re unable to evaluate papers by their merit.
You’re so benighted as to proffer dismissal as a refutation and slander as judgment.
Your comments here are merely an exercise of petty villainy.
Pat has magnitudes more scientific knowledge than a mindless scientifically illiterate moron like you ever has the capability of understanding
Stop passing yourself off as having any knowledge of anything…
…because you obviously don’t.
Frank is the laughing stock of the scientific community. How he keeps his job at SLAC is a mystery.
No surprise it’s a mystery to such a degraded intellect as yours, Warren.
Typical troll behavior. Trolls don’t answer questions because they can’t. Still waiting on these.
———-
Since you are obviously familiar with how college professors treat temperature, you should have no problem providing a textbook example or class notes showing how temperatures should be averaged and the results of averaging them.
————-
Tell us how “Michael Mann, Gavin Schmidt, or Jim Hansen” have followed NIST guidance for calculating reproducability uncertainty in their results.
Don’t just tell us to read their works. You have obviously done the research to validate their work or else you would be guilty of the argumentative fallacy of Argument From Authority. That would make your references worthless.
—————
Why don’t you answer with your bona fides?
I’ll give mine so you won’t feel bad.
I have a BSEE issued in 1973 from the University of Kansas.
Now let’s see your claim to fame.
‘Not to mention the molasses atmosphere needed to keep climate simulations from diverging.’
That would seem to be a somewhat inconvenient truth. Is there a link to that in the ‘approved’ literature?
See here. It gets very complicated very quickly. Hyperviscosity suppresses energy cascades (enstrophy).
Jerry Browning has published at least one paper showing that the need for a hyperviscosity arises because the so-called primitive equations used in climate models is wrong.
“primitive” is a very apt description for the climate computer games.
Climate models can’t model cumulus convection–the resolution is too course. So they parameterize it–make it up in other words. Cumulus convection is a primary atmospheric process, and it’s made up.
Not only is model resolution too coarse, but cloud physics is not in hand.
Long cold periods lasting ~1000,000+ years are interspersed by shorter inter-glacial periods of ~10,000+ years.
Extra zero here?
Correct further down in what appears to be a duplication, except it’s slightly different…
There is a bunch of stuff here that I don’t think quite correct in perspective.
One example, CO2 saturation and resulting ECS.
It is well established that the no feedbacks logarithmic doubling of CO2 is about 1.15C (Curry 2010 1.1, Lindzen 2011 1.2, Monckton’s published ~2016 equation with his inputs 1.16). So the next log doubling will add that again. ‘Already’ 85% saturated is not the correct perspective. It never saturates. Just each log doubling takes twice as much CO2 ppm as the previous one.
Since water vapor is admittedly (as also in this post) a positive feedback, ECS must be something significantly greater than ~1.15C, not 0.33C as asserted.
EBM observational methods say about 1.7C.
That value can also be triangulated from Lindzen’s 2011 Bode feedback curve (ECS 3.2 ~ Bode f 0.65 = WVF [IPCC says WVF doubles CO2 alone so +~2.4 C so Bode] 0.5+ clouds 0.15 [since IPCC says all else sums to zero]. Using zero cloud feedback as first shown by Dessler in 2011, and water vapor feedback half of climate modeled based on ARGO ocean ‘fresh water store’ mixed layer salinity observations that show twice as much actual rainfall as modeled gives Bode f= 0.65-0.15-(0.5/2)= 0.25 =>~ ECS 1.7.
Both observations as posted in comments several times previously.
A guy called Leckner actually did some scientific measurements on CO2 absorption.
His experimental results seem to indicate the “log” assumption is not quite correct (it’s an IPCC thing)
His measurements seem to show that the absorption levelled off at around 280ppm.
There is no evidence that water vapor in the real world results in a net positive feedback. Not once evaporation, circulation and clouds are included. In fact if water vapor did result in a net positive feedback, none of us would be here.
It is most likely that the actions of the atmosphere act to totally cancel any tiny theoretical CO2 warming. Which is why no-one can produce any empirical evidence of CO2 warming.
Hard to provide evidence for something that doesn’t actually happen….. !
Absolutely correct.
Crunch time will come as AR7 is put together and a dispute erupts between the CEREES team and the Argo team. The ocean heat content was used to calibrate the CERES radiation instruments during the period 2005 to 2015 but Net radiation is accelerating while OHC is decelerating causing them to part ways since 2015.
The assumption that the missing heat is in the oceans is WRONG. There is no missing heat. The oceans have retained heat because summer advection to boreal land has, and is, slowing down.
This is why there are concerted efforts to push the breakdown of ocean currents. There is less heat missing in the oceans. But the Earth is gaining more heat if the CERES stuff is right. It could be that the CERES team will be forced to recalibrate their physics. Or the Argo team remove the fouling from temperature sensors. But there is a dilemma emerging because the basic assumption is wrong. And the idea of measuring a radiation imbalance of Earth of 0.74W/m^2 or a temperature difference of 0.13C in 7.3E17m^3 of ocean is waaaaay beyond fantasy.
“The assumption that the missing heat is in the oceans is WRONG. There is no missing heat.”
Blimey, Trenberth is going to be so disappointed 😀.
Measurement uncertainty make these values nothing more than fantastical guesses.
Negative feedbacks can never completely cancel out the initial change.
You are assuming there is an initial change.
No evidence of that.
No signal… no possibility of feed-back.
And yes, the atmosphere is always trying to balance itself.
Even if there was a microscopic indetectable warming, the atmosphere would balance it so quickly no-one would ever notice it.
You are assuming that if something can’t be discerned, it doesn’t exist.
Finding a signal of a few tenths of a degree in the extremely noisy real world data is not easy. We would need a much more accurate, as well as a much more extensive (both geographically and temporarily) sensing network to have a chance of proving such a change.
The signal being looked for is similar to looking for a specific frequency in a complex waveform. For that you would do a wavelet or Fourier analysis.
For a “global ΔT signal” one would need to look for the signal in the components, i.e., individual stations. There are so many stations that do not coincide with the combined signal, one must suspect a problem in the methodology being used.
A good example, is a recent WUWT post looking at the central U.S. that has had minimal warming. How can that be with well mixed CO2? The conclusion is that there are large areas with very large amounts of warming.
If you look at the radiation imbalance over tropical warm pools in thermal equilibrium at 30C on the surface, you find that the ratio of reflected sunlight increase from cloud is twice the reduction in OLR decrease from the same cloud. So a very powerful negative feedback prevails once the atmosphere is in dynamic equilibrium with the surface due to cyclic convective instability.
Agreed. In fact clouds create massive surface area for radiation from liquid water or ice. And if you look the altitude and the curvature of Earth, more than 50% is radiated to space.
Q: Why does WUWT need to vigorously present the powerful data-driven science which REFUTES, utterly, the “climate change”/human CO2 lie?
Answer: In a word: Freedom.
(Dr. William Happer at 00:25 in above lecture video).
Only stupid people say humans have no effect on the climate
William happer is not stupid
And he does not say that
Why don’t you try being civil. I am getting tired of your nasty comments.
And I am tired of wild speculation presented as a proven fact, obvious climate myths and misrepresenting the views of scientists such as William Happer.
There are people here who deny the greenhouse effect
Deny AGW
Deny that CO2 can warm the planet
Claim the all warming is caused by El Ninos and they get heat only from underseas volcanoes
Claim only 3% of CO2 had manmade origins
I present a hard challenge to a climate myth echo chamber when I read such myths. Good practice for dealing with leftists who control the narrative and are winning the climate propaganda war.
Tell almost any climate scientist there is no greenhouse effect, or no AGW, or no human effect on the climate, and you will be laughed out of the room.
I rarely see anyone quote my sentence(s) and explain why it could be wrong. The response to something a reader does not want to hear is usually insults, not science.
There are too many people here who believe consensus climate science is 100% wrong, and anything from the government is always 100% wrong.
That is not reality.
That is an extreme position, just as dumb as the leftist position that the government is always 100% right.
… holy moly, you just get weirder and weirder.
Maybe you wife should let you keep looking at the girly pics.
“And I am tired of wild speculation presented as a proven fact”
THEN STOP DOING IT !!
CO2 warming… you have presented no evidence… pure speculation.
El Ninos ARE the only warming in the UAH data… stop your DENIAL.
Human CO2… not supported by isotopic data
The Conclusion Humans Drive Atmospheric CO2 Increases Is Undermined By Carbon Isotope Data (notrickszone.com)
You present absolutely NOTHING but self-opinionated bluster.
Leftist control the climate propaganda… because closet AGW-cultists like you continue to support their baseless conjectures.
A very common trait of a closet AGW-cultist / LUKEWARMER…
…. constantly pushing failed AGW conjectures.
“Tell almost any climate scientist… blah.. blah…”
Getting your directions from Mickey Mann now ??
Only people getting dumber are those putting any credence in your Billy Madison style rants.
I’m suspecting it’s some kind of mental condition.
A desperate need to feel superior to others, even if it’s only in his own mind.
Humans have an effect on their localised micro-climate… eg urban warming, land-use changes.
But there is no evidence of any effect on the global climate.
AGW is defined by the IPCC as caused by human released CO2…
Did you ever find any empirical scientific evidence that human CO2 causes warming ?
100,000+ scientific studies
Almost 100% of climate scientist
But you know better?
“And I am tired of wild speculation presented as a proven fact, obvious climate myths and misrepresenting the views of scientists such as William Happer.”
“100,000+ scientific studies”
“Almost 100% of climate scientist”
Don’t you feel a complete idiot saying these things and being caught out repeating obvious climate change myths and misrepresenting the views of climate scientists? Don’t you feel ashamed to repeat the CAGW nonsense and the ideology of these Green idiots or do you really have no damned clue what on earth you are saying?
He’s a closet AGW-cultist/lukewarmer…
… of course he feels no shame or embarrassment!
Do you have any facts that dispute Mr Greene?
Dickie has NEVER posted any facts…
His pointless opinions are not backed by science.
I have always said there is no scientific evidence for warming by atmospheric CO2.. and dickie continues to prove me correct.. by produce NO EVIDENCE.
Perhaps you would like to try AND FAIL.
Produce a paper that presents empirical scientific evidence for warming by human released CO2.
Stop your mindless yabbering and whinging.. and put up.. or shut up.
Your post is so stupid that it’s hardly worth a response.The evidence for warming by rising atmospheric CO2 is unequivocal. If you’re not aware, you’re a scientific illiterate –a conclusion that many on this forum have already reached.
Your post contains absolutely NOTHING but NOTHING.
Where is this unequivocal science.
You certainly haven’t presented any. !
All you have managed in mindless waffle.. just like dickie.
Again.. poor dickie only has his mindless consensus mean to slide back on
It really is quite hilarious watching him dodge and weave and slither, as he tries to avoid posting evidence he KNOWS he does not have.!
Finding a small signal inside a noisy signal is a difficult task. It requires reliable instruments and complete coverage. It also requires large samples.
None of these requirements are satisfied when it comes to measuring the earth’s temperature over time.
You are making the mistake of believing that if something can’t be measured, it doesn’t exist.
Happen SAID, the effect of human CO2 is NEGLIGIBLE.
That’s the position I’ve always taken. Though I should point out that negligible is not a synonym for nonexistent.
Prove it is existent !
Or are you turning into a lukewarmer like dickie. !!
The day that scientists like Dr Happer and Dr Lindzen pass away will be very sad days for science. However, we can perhaps take comfort in knowing that the science they leave behind like that in this posting will eventually bring down the climate alarmist house of cards.
The saturation of GHGs is perhaps the dirty little secret that the alarmists dare not mention and talk about. I find it extraordinary that the alarmist narrative has stayed alive this long without the science in this posting (along with feedbacks) debunking it. Someday, future generations will look back on this and wonder how it could have possibly happened.
But I guess when governments make the alarmist narrative pay well (along with scare’s usefulness for demonizing fossil fuels), nothing is allowed to threaten it. Orwellian Big Brother is alive and well.
State funded jollies to far flung placed in first class accommodation makes a very powerful argument/reason for the ongoing commitment to Climate Change being a man made event needing government input.
The annual pilgrimage now required by tens of thousands of committed climate change advocates ensures the yearly COP sermon, based on the mountain of lies continues to grow. With state gifts funding and star billing not to mention stars attending, why would those wanting a freebee not go?
If tele-conferencing of COP was mandated to replace the fly away gatherings of the Climate Alarmists, there would be a marked decline in the number attending those ‘essential’ get togethers.
A lot of arm-waving here. The only science seems to be in the linked paper by Happer (13). But that doesn’t say that future warming will be negligible. Here is the table with their ECS calculation:
The ECS that they derive from their 1D model is almost exactly the same as the classic sources. >2C per doubling. Incidentally, the log dependence on CO2 has been known at least since Arrhenius (1896) and is built into the definition of ECS as x per doubling of [CO2].
It takes an arm-waver to know one.
Hysterical arm waving is a critical part of modern leftist climate “science”
You must also be able to say “Climate change will kill your dog” without bursting out laughing
“Hysterical arm waving is a critical part of modern leftist climate “science””
Just have to watch dickie-bot in action, to know that is true.
My dogs are doing fine. I don’t laugh at killing dogs. You should get a life–on another planet.
That’s for fixed relative humidity, which is still up in the air (so to speak).
The kind of model Happer is using can’t do any better.
No, but the range is likely to be somewhere between fixed absolute humidity and fixed relative humidity.
That is still means plenty of warming.
No evidence of that.
Warming by human CO2 has never been observed or measured anywhere on the planet.
Calculations based on radiative effects only give a maximum possible value… but ignore all the other “movers” of energy in the atmosphere.
Arrhenius was wrong.. even his equations were not dimensionally correct… anything after that was baseless supposition.
“. . . even his equations were not dimensionally correct . . . .”
You know, Bnice, you’re smarter than you look.
Thanks… , yep, I gots me some edumacation ! 😉
‘Arrhenius was wrong’. So please cite the research that shows Arrhenius was wrong.
Somewhere between 1.3K and 2.9K according to the table.
Is that “plenty”?
Barely take us up to the MWP or RWP !
And it’s not real warming, just in the minds of degenerative AGW-cultists.
K per doubling. 2.9K is a mid value in the IPCC range.
So what. !
Meaningless calculation based on a small fraction of atmospheric energy transfer.
Now you’ve retreated from ‘warming is negligiblel’ to , ‘well it’s only a small fraction of energy transfer’. You might as well go all the way and accept Nick Stokes post.
No evidence of any warming by CO2 at all.
You have proven that by producing NO EVIDENCE.
Energy transfer making any theoretical warming from CO2 immeasurable and basically NON-EXISTANT.
If it existed,, you would be able to produce evidence.
and you have proven THAT YOU CAN’T.
Yep, and it’s the highest figure in the table you showed.
Purely on the basis of “temperature anomaly” vs ln(CO2) since 1950, the OLS regression line is T = -20.58 + 3.57 * ln(CO2).
T vs ln(CO2) is all over the place pre-1950.
CO2 in 1950 was 312 ppm
CO2 in 2022 was 418 ppm
For 280 ppm, that’s -0.46K
For 420 ppm, that’s 0.98K
For 560 ppm, that’s 2.01K
So, on that basis the 2.2K – 2.9K (2.5K +/- 0.4) range seems reasonable.
Again, the assumption that only CO2 is causing the warming…
Over a period of several very solid solar cycles.
Not a sensible assumption, at all..
You can regress anything against anything else.
The object of the exercise is to see if the fit is good enough to be worth investigating.
T vs ln(CO2) is useful for seeing if there is a relationship.
T vs TSI, UV or cosmic rays would be useful for alternative hypotheses.
But since 1950 isn’t ECS. It isn’t a jump start, and it hasn’t reached equilibrium.
It’s TCR, but there’s been 70+ years since 1950. Equilibrium is rarely reached in any system with varying inputs and slow responses.
If you look at the T vs ln(CO2) pre-1950, it’s all over the shop, with a pronounced spike around 310 ppm in the 1940s.
If you leave out that spike, the slope from around 307 ppm (1930-ish) to 420 is similar to the post-1950 (312 ppm) slope.
The slope is negative from 280 ppm to 307 ppm.
“Equilibrium . . . .”
Mr. Stokes wouldn’t understand the concept of equilibrium if it hit him in the face.
OC,
“It’s TCR, but there’s been 70+ years since 1950.”
TCR requores that CO2 double over 70 years (with exponential increase).
Poor Nick.. so you now admit that the concept of TCR is total anti-science gibberish with no basis in reality..
We had already figured that out..
Sorry it took you so long to catch up.
You know better than that, Nick. CO2 increase and the response aren’t quantised.
There’s theoretically an increase in response proportional to the natural log of the increase in GHG concentration, principally CO2 and H2O.
The observed relationship is as above.
You can pick another start date if you prefer. 1959 is the start of the Mauna Loa observations, but there is quite a good correspondence with Law Dome where they overlap.
There is no evidence CO2 has done anything since 1950…
… except enhance the carbon cycle and everything that depends on it.
So Nick is correct for once… by pure accident…. it isn’t the mythical ECS.
There is evidence of more sunlight reaching Earth’s surface from less SO2 air pollution and a smaller percentage of clouds.
That’s not CO2 warming
In addition the GAT surface temperature statistics are questionable..
The 1979 to 2024 UAH may be acceptable
But assuming all warming after 1979 was caused by CO2 is a worst case assumption, not likely to be an accurate assumption.
“The 1979 to 2024 UAH may be acceptable”
And shows no evidence of warming by human CO2…
… just warming at El Nino events.
The UAH chart does not reveal the causes of the warming trend
There are variations caused by El Ninos and La Nonas
You El Nino Nutters ignore the La Ninas that flatten the trend line and stare at the El Ninos that cause spikes
The ENSO cycle is neutral in the long run,
You El Nino Nutters are lost in space, or should I say lost in the deep sea of climate myths.
If El Ninos controlled the climate, then they caused global warming from 1975 to 2024, and global cooling from 1940 to 1975. El Ninos cause everything!
It’s so much fun to be an El Nino Nutter.
So you now agree that there is no evidence of CO2 warming in the UAH data.
Warming ONLY happened at El Nino events.
LONG period of no warming between.
Sorry if your in-built AGW-cult-lukewarmer-bias-brain-washing cannot accept that fact.
Sorry you still have so little understanding of El Nino and La Nina… not my problem to fix.
Only a complete nutter DENIES facts that are in the data in front of him
Or someone trying to emulate Billy Madison, and make everyone who pays any attention to his non-science gibberings and bluster… much, much dumber.
The regression was purely T vs ln(CO2). Additional factors compound the complexity.
Feel free to regress T vs SO2 or T vs cloud cover or the others I mentioned earlier.
Something interesting may well come of those
There are too many climate change variables to measure exactly what each one does in the atmosphere. CO2 effects, for example, have to use lab testing as a proxy estimate.
Almost certainly. Regression with each candidate gives some idea of how good its correlation is.
CO2 concentration figures aren’t all that difficult to find.
If anybody can point me to similar figures for other factors, I’ll play with them as well.
Lab jar is nothing like the atmosphere… not evidence of anything.
“seems reasonable”
Well, again your regressing can’t give you ECS – no E. It is closer to TCR.
Yeah, that’s what I said above.
Equilibrium is rather unlikely with the inputs varying.
It’s probable that the CO2 concentration had stabilised at 280 ppm, but temperature doesn’t appear to have done so.
ECS is presumably asymptotic, with TCR forming the section of the curve below the inflection. Do you have the range of time frames proposed for ECS?
If it’s on the order of a decade, the regression includes the pre-2010 ECS. If it’s on the order of a century, the bulk of the pre-1990 ECS will be covered (depending on the shape of the curve).
Time frames are included in the Bern Model. Teere is a combination of differet processes, going from a few years to centuries. But ECS is missing both ends; a slow rise, and a long way to equilibrium.
If you are referring to Figure 4, that has a steep rise on the order of a decade (20 years for the vast majority of the increase) – essentially asymptotic.
On that basis, the vast majority pre-2000 ECS has already been captured in the regression.
If you regress far enough you too can come up with a fantasy, meaningless number which is irrelevant in a real atmosphere.
As you very often do.
And the IPCC range is plausible because..???
Plenty is a weasel word. It doesn’t quantify anything.
It is a descriptor of Happer’s quantified result. ECS=2.2 K/doubling.
Using radiative calculations only.
It is just a mythical theoretical number..
…with ZERO relevance in a real atmosphere.
As Happer says. CO2’s effect is negligible.
In fact.. UNMEASURABLE and thus UNMEASURED.
So you’ve accepted 2.2C as Happer’s work, and now you say ‘warming is negligible’. Which is it, BNICE2000?
Again. you are so stupidly ignorant that you don’t even comprehend that this is based on radiative effects only.. it is a maximum possible so long as there is no other energy movement within the atmosphere.
Do you really think radiation is the only way energy moves in the atmosphere.
Are you really that DUMB AND IGNORANT !!!
Now.. present a empirical scientific paper providing evidence for warming by atmospheric CO2…. or just remain an empty sack of mindless blethering.
You’ve just doubled down on your gobsmacking ignorance by claiming that long-term global temperature trends are affected by internal heat exchange in the atmospheric system.
You still haven’t produce a single bit of evidence that CO2 has caused the beneficial warming out of the coldest period in 10,000 years.
You still are totally ignorant of atmospheric energy transfer.
Your comment is just mindless ignorance-based gibberish.
After all these years of trolling on the climate issue, and you don’t know that RADIATION is the ONLY HEAT EXCHANGE MECHANISM THAT HEATS OR COOLS THE PLANET?
Go to school and learn something. Do you think the oceans and land don’t store heat for later release. That moderates the temperature swings and the radiation being sent into space.
All you trolls like to show how many zetajoules the oceans have stored over the last 100 years. Do you think that is radiated heat?
Do you know what a frost line on line is? Is that heat stored during the summer that moderates how deep the earth freezes? Is the heat stored for release during winter?
All your examples are heat exchanges internal to earths system, and therefore have no effect on the total amount of energy in earths system or its bulk temperature– the phenomena you cite merely move heat from one place to another within earths system.
Your problem is you don’t understand gradients and how they are used in heating and cooling. You can’t just average insolation and then use the average in a radiation diagram as your favorite authors do. Gradients control how much and when heat is absorbed and radiated.
You get another clown for your incomplete description of what actually occurs.
🤡 🤡 🤡 🤡 🤡 🤡 🤡 🤡 🤡 🤡 🤡 🤡 🤡 Thirteen so far.
A word salad that says nothing about earths energy and what causes it to increase or decrease. Hint: None of your prior examples have an effect.,
A word salad! From you that is hilarious! As someone who does nothing but that, I’m sure you are a good estimator.
Radiation is the only way that the Earth is heated and cooled.
At least you admit models suck.
No models can “do any better” in that climate is too complex to be modelled, hence the tangle of spaghetti graphs showing the climate “riding off in all directions”. But history and paleo-history shows no “tipping points” from a warm regime to a dangerously hot regime. Looking back hints that the next big change will be to the next glacial event and that near term global warming will be benign to beneficent to most of humanity and nature. Hence the imperative for climate activists to find danger in the global greening from higher CO2 levels. After all, we simply can not allow any virtue to higher CO2 levels as it would dilute the catastrophic narrative.
Nick Stokes,
The problem with the ECS calculations that you present in your comment is that they don’t take into account important negative feedback mechanisms such as evaporative cooling and meriodional heat transport from the tropics to the upper latitudes via atmospheric convection and ocean currents (advection). Both of these negative feedback mechanisms increase with temperature, particularly evaporative cooling which is highly sensitive to temperature.
I don’t present them. Happer presents them, in the same paper he talks about saturation. Ed’s 85% figure is nonsense, and he gives no basis for it.
It is a primitive model, which misses feedbacks both positive and negative. But it is what we are offerred here.
Happer deals only with radiation.. A small player in the movement of energy in the atmosphere.
Any value derived is a “theoretical maximum”.. and ignores any reality of atmospheric energy transfer.
Ed’s figure is far less “nonsense” than anything you have to put forward.
“Happer deals only with radiation.. A small player in the movement of energy in the atmosphere.”
Albeit radiation and albedo are the ultimate control knobs for how much energy is absorbed by the earth and emitted by the earth. A significant amount of thermal energy gets directly radiated to space. I would assume that phase changes in water is the biggest player of “movement of energy in the atmosphere.
Assuming an albedo is assuming a lot about convection, cloud cover, surface reflectivity…..assuming a lapse rate to get a radiative equilibrium is assuming a lot about water vapor and other greenhouse gases in the atmosphere. Both assume a lot about rainfall and evaporation. So saying Happer’s model deals with only radiation isn’t correct. It just reduces the 1500 or so parameters entered into GCMs (which the programmers have attempted to fit by eyeballing historical graphs) into a few parameters, also eyeballed from more general graphs.
When computer programs solving the Navier Stokes flow equation can predict the plasma wanderings in ITER in the next few seconds, and the weather in downslope Rocky Mountains more than 3 days in advance, then they might be able to predict the “climate” trend for the next 30 years, but probably not….till then, I’ll look at the sky and wind direction and take the coat that I think I’ll need that day….
Look at the absorbance chart in the article. “Zero” is not far away. You are running out of runway for catastrophic global warming.
There are obviously negative feedbacks to the water vapor positive feedback and I’d add increased cloudiness AS A POSSIBILTY IN THE LONG RUN
THERE HAS NEVER BEEN RUNAWAY WARMING BECAUSE THERE MUST BE SOME OFFSETTING NEGATIVE FEEDBACK(S)
That suggest the large Water Vapor Positive Feedback claimed by the Climate Howlers to demonize CO2 is the least likely possibility, not most likely.
No large Water Vapor Positive Feedback
= no CAGW
“THERE HAS NEVER BEEN RUNAWAY WARMING BECAUSE THERE MUST BE SOME OFFSETTING NEGATIVE FEEDBACK(S)”
Of course there is. It is Planck feedback; basically the outward flux that follows a rise in temperature. That is the biggie, and stabilizes. Other feedbacks add to that, positively or negatively.
Nick trying desperately to back-track.. using gibberish.
There is no evidence of a WV feedback to CO2 non-warming.
You have no real argument?
Do you have anything but yapping like a mindless chihuahua.
“There is no evidence of a WV feedback to CO2 non-warming.”
Produce some… or FAIL .
Since Mr. Stokes doesn’t know what feedback is, I would ignore anything he says about feedback.
Feedback explained here
PLanck feedback explained here
Thank you Nick. As you can see, the level of argument here is rather primitive, ie simply about whether positive feedback is a thing.
“. . . simply about whether positive feedback is a thing.”
You’re off the stupid narrative. It’s the positive feedback that supposedly makes climate change a problem.
There are both positive and negative feedbacks in the climate system and the net feedback is positive, about 3 to 1.
Raspberries! I eschew your comments!
Anytime you see an oscillation, there is feedback involved. A typical L-C circuit (inductor-capacitor) generates a second order differential equation. Such equations oscillate. There’s a cycle between building up a magnetic field in the coil and an electric field between the capacitor plates. The same is true for planetary orbits. There’s an oscillation between orbital energy (height) and orbital velocity.
The Lorentz equations clearly show there are feedback terms. You feed the output back into the input. There is an obvious oscillation too. If you run the equations, there is a non-repeating orbiting–typical of chaotic systems.
You couple (feedback) computer logic circuits to make an R-S (set-reset) flip-flop. It’s also called a monostable multivibrator. The output of one logic element–a nand (or nor) gate–is inputted into another similar gate. The result is that the device oscillates as a “1” (set) or a “0” (reset). R-S flip-flops can be used as a switch debouncer. They have problems when both inputs are zero (or one for nor gates). You add additional logic elements to prevent that from happening. Thus you have “D”, “T”, and “J-K” flip flops that prevent the occurrence.
So your post is silly and doesn’t disprove my original statement.
“The same is true for planetary orbits. There’s an oscillation between orbital energy (height) and orbital velocity.”
So where is the feedback? What is the feedback coefficient? What if the orbit is circular and the height does not change?
“generates a second order differential equation. Such equations oscillate.”
Equations don’t oscillate. They may have oscillatory solutions. It doesn’t follow from being second order.
y”+y=0 is the classic simple harmonic motion equation. But how can you say that it has feedback? What is the coefficient?
y”-y=0 is a similar second order ODE. Its solutions are not oscillatory. Why does one have feedback and the other not?
“So where is the feedback? What is the feedback coefficient?”
Please Mr. Stokes. If the output is fed into the input–it’s feedback.
“What if the orbit is circular and the height does not change?”
Show me one such orbit in the the Universe.
Venus orbit is close to circular. The orbit of a geocentric satellite is circular.
What you never explain with DEs is what you call output and what input, let alone feedback.
I am reminded of a Star Trek movie where Kirk knew Khan didn’t understand 3D movement. I’m not sure you do either. Pilots do. Have you had any flying lessons?
Here is how the solar system is really dragged through space by the sun. I don’t see flat circular motion here. Do you?
https://youtu.be/fJuaPyQFrYk?si=vpEnuIPr8qXF6QUo
geocentric— geosynchronous is more exact.You are talking mathematical gibberish again Nick !!
Your simple equations do not include all the necessary components for harmonic motion. Think of a pendulum. Why does a pendulum slow down once started? You learn about these things in engineering. There are many, many components that cause the oscillatory motion to cease. Did you know friction can be negative feedback? How about the tension and compression in the string connecting the pendulum to the center point? What happens to a pendulum when you add positive feedback? Think about adding new energy at the end of each oscillation. If you’ve ever had someone push you on a swing to go higher and higher, you might recognize what happens.
You guys really don’t know any maths. First Jim M tries to tell us that any second order de oscillates. Then Jim M tries to tell us that the SHM equation doesn’t.
Here is the equation for SHM described.
I’ve never seen a well trained mathematician look like a deer in the headlights when it comes to feedback. If the output is fed into the input–you have feedback.
I thought about circular motion last night. The general equation for an ellipse is:
x^2/a^2 + y^2/b^2 = 1.
If a and b are equal, then you have a circle (a circle is a special case of an ellipse where the major and minor axes are equal).
In that case, the equation reduces to:
x^2 + y^2 = r^2
Now if you solve for x, you get a function of y. If you solve for y, you get a function of x. Therefore x depends on y and y depends on x–classic feedback. This is not as obvious as Lorenz’s equations where there is clear feedback..
Your silly prime notation is an attempt to obfuscate. Show us the solutions to those “primed” diff-eqs.
SHM? You mean we have energy transferring from a spring to a weight and then back again? Seriously! The electrical differential equations are essentially the same for the mechanical equivalent. Although, most electrical engineers agree that those equations describe the electrical systems better than the mechanical systems.
One of my fraternity brothers, who was a mechanical engineering student, said mechanical engineers are better than EE’s because they do both. I then asked him about Fourier and Laplace transforms and more deer in the headlights.
I remember a EE prof describing an experiment by a mechanical engineering prof trying to find the “Q” of a mass-spring system. Unfortunately, a worm gear does not allow energy to travel backward–like many electrical systems do. His experiment failed.
You have a very strange notion of feedback. I’m not going to pursue it any more.
The solutions of y”+y=0 are sin(x) and cos(x).
The solutions of y”-y=0 are sinh(x) and cosh(x). Or exp(x) and exp(-x)
This stuff is really elementary. We did it in high school.
Oscillation! There must be a feedback term somewhere. So there are really two terms: x and y with your silly prime notation. It’s too bad your political position prevents a clear view of various situations–even in mathematics.
“I’m not going to pursue it any more.”
Well, there’s that.
If two variables depend on each other–then there’s a feedback.
I love the no-feedback harmonic claim.
x+y=0
A straight line through the origin.
x and y depend on eah other
Feedback?
Linear? Really? Your politics are showing. First tell me how you can average intensive properties, and I’ll succumb to your nonsense maths.
You can’t calculate the average temperature of a mass? Gee, we should tell our college profs that. They do it all the time. Oh wait. Could we be wrong?
You have no clue do you?
First, extensive means that when you split a body the mass is also split in similar proportions. Intensive means that when you split a body, the temperature of each part remains the same instead of being divided.
Secondly, you can multiply an average of masses by the number of parts and get the whole mass. You can not multiply the average temperature by the number of pieces to get the total temperature. This is a corollary of the first definition.
Thirdly, you can not “average” the temperature of a body with a non-uniform temperature and achieve any kind of an appropriate description of the body. One must develop a gradient that describes the temperature differential across the body. That is, a diffusion equation.
Since you are obviously familiar with how college professors treat temperature, you should have no problem providing a textbook example or class notes showing how temperatures should be averaged and the results of averaging them.
Believe me, I won’t hold my breath.
And linear equations do not oscillate. Why are you being a . . . mathematician?
So you lied when you said: “I’m not going to pursue it any more.”
A failed prediction.
Not feedback.
You don’t apparently know that feedback is the main feature of climate change. What a stupid troll!!!
Of course i know. That’s why cs is 3 and not 1. But your silly examples were not examples of feedback
Mr. Stokes hired you to explain his stupid nonsense. So the squeal you hear in a pa system isn’t feedback? More stupidity.
“Your silly prime notation is an attempt to obfuscate.”
It’s not Nick’s notation it’s Newton’s!
“A typical L-C circuit (inductor-capacitor) generates a second order differential equation.”
Such equations can have oscillatory solutions, it depends on the parameters. The nature of the roots of the characteristic equation for the system determine whether it’s oscillatory, imaginary eigenvalues result in an oscillatory solution.
I guess you’re right. If there’s no input, then there’s no output.
I don’t recall saying that. In the Wien Bridge oscillator circuit for example the voltage gain must be more than three to give an oscillation.
So, not a basic second order LC differential equation. From my personal electronics construction experience, amplifiers usually oscillate and oscillators don’t.
Since you jumped in, is your position that an oscillating system doesn’t necessarily need feedback? I say it does. The question then becomes, what is oscillating and how do they oscillate.. And if we are going to discuss more complex systems, then we need to get more precise with our terms. For example, we need positive feedback and of sufficient magnitude to overcome resistance–at least initially. And you’re right, we need to stay in the complex plane to oscillate–so not all second order diff-eqs oscillate. But did you notice the solution to one of Mr. Stokes’ equations was sinusoidal–when he said it wasn’t?
Newton also used dot notation for time derivatives. I prefer Leibniz’s notation which is usually, but not always, taught in Calculus today.
“ But did you notice the solution to one of Mr. Stokes’ equations was sinusoidal–when he said it wasn’t?”
Actually what Nick said was: “They may have oscillatory solutions. It doesn’t follow from being second order.
y”+y=0 is the classic simple harmonic motion equation. But how can you say that it has feedback? What is the coefficient?
y”-y=0 is a similar second order ODE. Its solutions are not oscillatory. Why does one have feedback and the other not?”
It was in answer to the statement that second order equations oscillate, he showed two examples, one that did oscillate and one that didn’t.
Ham radio has been a passion and hobby of mine for over 60 years. It is why I have an EE degree. As you say, LC and RC oscillators sometimes don’t work because low power is used to reduce drift and there isn’t enough voltage gain to overcome resistive losses. A pain. Also amplifiers that are designed to have high amplification (RF preamps) can have oscillations far removed from the frequencies you are dealing with due to parasitic inductance and capacitance. Many times you won’t even know it without using a spectrum analyzer. It is why most high power tube based RF amplifiers have parasitic suppressors in their plate leads.
Back to climate. Oscillations are difficult to deal with. Feedback of some type is required. Climate science has not dealt with this in a systematic mathematical way. To claim that there is a water feedback requires some mathematical proof, not just a generalized claim that it must happen. That requires some experimentation and actual data that I have never seen.
“Feedback of some type is required. Climate science has not dealt with this in a systematic mathematical way. To claim that there is a water feedback requires some mathematical proof, not just a generalized claim that it must happen. That requires some experimentation and actual data that I have never seen.”
if you haven’t seen it, you need to read some science. It’s foundational atmospheric physics, and found in any textbook.
Show a textbook example that has mathematical equations for atmospheric feedback of any kind.
If I had read your comment a few days ago, I’d have thought you weren’t serious. Now I know how utterly devoid of any knowledge of science you are. I’ve already suggested this remedial reading for you: for an example of feedback, see Chapter 3.4, beginning on page 153: https://a.co/d/heOpyhz
(And I predict the next comment we hear from you is “Pierrehumbert doesn’t know what he’s talking about, but I do!”
If you think I’m going to pay $50 bucks for a book where you could post shots you are crazy.
I have given you references in Planck’s thesis and you just ignore them. I suggest you read Planck to learn about heat radiation and entropy.
There is only one source of energy into the system. That is the surface absorbing sunlight.
Back radiation does not ADD to the sun’s energy although lots of folks like you think so. If you would read Planck you would learn that the surface radiation is “offset” by back radiation, reducing the cooling gradient, but not reversing it. Planck calls it “compensation”.
I see the conceptual problem under which you’ve been laboring. Of course incoming solar is not increased by ghgs. That’s the entire point. But OUTGOING IR is reduced by ghgs. So instead of energy in to earth system being equal to energy out, energy out diminishes due to ghgs , and earth warms. And you have been missing this simple idea forever, it seems.
You need to provide some resources to justify your assertions.
The prediction of no more snow arose from this faulty assumption. If energy in > energy out, every day would be warmer than the day before. Every night would be hotter than the night before. In other words, if CO2 “traps” heat how is the heat ever dissipated?
This misconception arises from the ignorant use of radiation only as a controlling factor. The land and oceans are not black bodies that immediately radiate away all absorbed energy. Heat diffuses into the soil to quite a depth for later release at cooler times. Same for oceans, el nino. They act as heat sinks. Surely you have studied heat sinks. These factors must be included in any heat equations for the earth as a whole system.
as long as atmospheric co2 continues to increase, the earth will be in a perpetual state of energy imbalance, and will continue to warm. Internal exchanges of heat energy within earths system (eg, between oceans and atmosphere) cause fluctuations in the upward warming trend of the atmosphere, but the atmospheric trend is inexorably upwards. Ie, you’ve answered your own question.
You are as bad as Phil with making up strawman arguments you can knock down! Did you get away with this if debate classes? I hope not because it is a reason to mark you as failing to present a cogent argument.
Do you think soil temperatures don’t give up energy at night or when fall and winter comes around? Do you know what a frost depth is and why water lines must be buried lower than that?
Do you think oceans don’t radiate at night or during el Nino’s?
Again, it is why time based gradients need to be used in developing accurate descriptions of what occurs with the earth. Radiation diagrams using averages of nothing but radiation have no chance of accurately illustrating what does occur.
I don’t think you understand that all bodies emit radiative energy, even when a nearby body is warmer. Or, more pointedly, that contrary to your bewildered claims, back radiation is absorbed by a warmer earth.
🤡🤡🤡🤡🤡🤡🤡🤡🤡🤡🤡🤡🤡🤡🤡🤡🤡🤡🤡🤡
Twenty clowns for this.
“the earth will be in a perpetual state of energy imbalance,”
Ceteris paribus clutched ever by the hopeful doomster.
“A lot of arm-waving here”
That is all you ever have, Nick !!
That’s not true, Nick also brings brow wrinkling and foot stomping.
and the result knicker twisting produces a bit of a positive (negative?) feedback.
If the friction from knicker twisting produces heat, that might be a positive feedback.
I think Nick is the only one that can say for sure … is it positive or negative.
It’s the transient value (TCR) that is relevant, equilibrium climate sensitivity (ECS) takes thousands of years by which time the next glaciation will be well underway.
Ony transients I have seen in the atmospheric temperatures,..
… come from El Nino events. No CO2 involved at all.
What Happer’s calculations show is that, even with the fuss he makes about saturation, ECS is unaffected. There is no reason to expect TCR to be affected.
No reason to expect TCR to be anything but zero. !
No reason we’d expect you to know anything about the volumes of scientific research finding a non zero value for TCR
In this paper under Fig 7, Van W &H state that doubling CO2 results in 3 watts of forcing….but 3 degrees warming at surface results in about 15 watts more IR emitted at surface. So 12 watts is back radiation by the extra water vapor due to warmer surface temp? This does not add up. I think it is more reasonable that the lines cross each other at about 1.2 C per doubling as one gets out of Modtran using clear sky cases, less with cloud cover.
https://wvanwijngaarden.info.yorku.ca/files/2023/03/GreenhousePrimerArxiv.pdf?x45936
Happer and Lindzen working together once stated an estimated ECS of about 1 degree C.
Happer alone more recently stated 0.7 degrees C.
I can not recall any “skeptic” scientist stating over +1.5 degrees C.
I prefer the +0.75 to +1.5 degree C. range
Everyone gets to pick a range
I like more CO2 and more warming so I prefer both to continue for another 48 years.
No, Richard, everyone does not get to pick a range – if you can’t justify a given range with evidence then it’s nonsense.
Just use a hat.. put the numbers in it
dickie’s idea of “science”
I want to point out a persistent error I’ve noticed for years. The curve labeled “Transparent Atmosphere” (solar insolation at top of Earth’s atmosphere) is incorrect. It is actually black body radiation at 5,900 K (Kelvin). The actual solar spectrum varies greatly from a black body at wavelengths shorter than about 1,000 nm (nanometers, infrared and longer). At all wavelengths shorter than that, the actual output is considerably less than the black body, except for a narrow peak in violet and ultraviolet that is a little higher than black body, and, at some x-ray frequencies from the corona. This would make a considerable difference. Also, the actual spectrum is somewhat variable. I would love to see the first graph and numbers redone using the actual solar spectrum. Of course, this does not contradict the general conclusion, only the details of warming.
OOPS! “. . . black body at wavelengths . . .” should read “. . . black body EXCEPT at wavelengths . . .”
“Although studiously ignored by Climate Alarmist thinking, the Water in the atmosphere either as Water Vapour or as Clouds is the main Greenhouse Gas, accounting for roughly 85% – 95% of the total warming effect or about ~30°C of the estimated ~+33°C Greenhouse effect.”
Without water, water vapour, and clouds the sunlit side of Earth at any given time would be as hot as on the Moon. Water vapour absorbs a third of the solar near infrared, or around 16% of the total solar heating effect. Yet Earth’s global mean surface temperature is around 90K warmer than the Lunar global mean. Because Earth has a much warmer dark side at any given time, mainly due to the sea surfaces barely cooling at night, and a lesser radiative contribution from the atmospheric thermal reservoirs of water vapour and clouds.
The proposed 33°C greenhouse effect, is derived from imagining that the solar heating is spread over four times the illuminated disk area, minus 30% albedo:
394K * 0.25^0.25 = 278.6K
minus 30% albedo:
278.6K * 0.7^0.25 = 254.83K (-18.3°C)
Apply that to the Moon with the relevant albedo, and the result is about 70K too warm. Because the divide by four is unphysical nonsense, the solar heating is only on half of the sphere. Divide by two gets far close to the Lunar global mean when averaged with the dark side mean temperature.
394K * 0.5^0.25 = 331.3K
minus 12% albedo:
331.3K * 0.88^0.25 = 320.89K
and averaged with a mean night side T of say 90K
(320.89 + 90) / 2 = 205.4K
“Because the divide by four is unphysical nonsense, the solar heating is only on half of the sphere.”
The divide by four comes from the fact that a sphere presents as a circle to the incoming solar radiation. If you spread that around the entire sphere, then you divide the area of a circle by the area of a sphere–that turns out to be exactly 1/4. It makes mathematical sense, but as to physical sense–that’s another thing entirely. You kill a lot of physics by using averages.
Yep.. as Ulric stated, it is totally unphysical nonsense.
The sun actually acts a cylinder of energy varying from high in the centre to near zero at the outside because of the curvature of the Earth’s surface… and acts on an off-axis rotating sphere (close as)
Given that warming is proportional to the 4th power of energy, you can’t just take an average and pretend it is remotely real.
The first video actually explains the 1/4 nonsense.
Oops, I meant to reply to Right-Handed Shark. Oh well, I can explain it by stating that I’m trying to see leprechauns–by drinking. (I was warned that I might actually see Banshees.)
You can’t see Banshees by drinking. The only time you ever get to see one is when you absolutely do not want to see one, often it’s one of the last things a person sees.
The last thing you see is the Cóiste Bodhar (death coach).
The total solar energy intercepted by the earth is proportional to 1/4 the Earth’s surface area but it is spread over 1/2 the surface ares, at any given location and time it is proportional to cos of the incident angle of the sun’s rays (0º when overhead, 90º at sunset).
That’s without an atmosphere. The atmosphere adds a level of complication that surpasses most simple or inappropriate complicated models. It’s too bad we don’t have an airless planet, orbiting a middle-aged G2 spectral class star to compare this with. It’s all arm-waving as Mr. Stokes previously mentioned.
The atmosphere doesn’t change the fact that the total energy intercepted by the Earth is (1/4πr^2)* solar intensity. The atmosphere can distribute that energy but it can’t increase it, Ulric’s quote that it should be one half is nonsense.
Spreading the solar heating effect over the whole sphere instead of the actual illuminated hemisphere results in an equivalent black-body temperature 113K too warm. That’s why the divide by four method does not work for the Moon.
I’m not saying that, to calculate how much light is received by the Earth (or the Moon) you have to divide surface area by 4. What you do with that energy afterwards is a different matter.
The Earth receives ~1360*(π*6400^2)*10^6 W
Surface area ~(4*π*6400^2)*10^6
It’s not the dividing by 4 that’s the problem, it’s what you’re doing with it afterwards.
You have no conception of a dynamic system do you? How about a non-linear radiation phenomenon?
Assuming that each part of the surface of the earth absorbs an equal amount of insolation is a massive error in climate science. It is why heat transport in the atmosphere has been neglected in favor of radiative research.
Do you really believe that the north and south poles fecieve as much insolation as the tropics? That is what your math proves!
You apparently can’t read! I said how to calculate the total amount of light received by the Earth, I did not say that “each part of the surface absorbs an equal amount”. On the contrary I pointed out that it depended on cosine on the angle of incidence among other things. The Earth’s albedo is 0.37 and that’s an average taking account of various parameters including angle of incidence.
No point on earth receives that average either. At any given point, the insolation varies by the sine and the cosine. Using the average, as many radiation diagrams do, is a result of the divide by 4 fallacy.
Phil said:
“to calculate how much light is received by the Earth (or the Moon) you have to divide surface area by 4.”
No they divide the power of the irradiance by four to spread the irradiance over four times the illuminated disk area. But Earth and the Moon receive the irradiance on one hemisphere which is two times the disk area.
Spreading it over four times the disk area creates an extra 113K out of thin air.
I don’t care what ‘they’ do, real scientists don’t do that.
Real scientists do exactly that. Read my first comment again.
Who are the real scientists you are referring to? The calculations that I’ve seen of the lunar temperature did not do what you say.
Re. “real scientists”. Please try to keep track, I am talking about the standard divide by four method as applied to Earth.
Divide by four ‘doesn’t work?? It’s 9th grade geometry
If you had a flat disk.
You don’t know much about trigonometry and spheres do you?
Read Max Planck’s Theory of Heat Radiation, Section 36 to learn about radiation that strikes a body at an angle of less than 90°. You’ll learn why an average doesn’t cut it since that assumes all radiation is normal to all points on a sphere.
So If the suns 2 D projected surface area is unrepresentative, where do you imagine all that other incident light goes?
Professing your ignorance.
At least you have got that far.
Now go get at least a junior school education, because no-one here is going to bother trying to educate a low-IQ muppet.
Except you have no answer. It’s freshman hs level geometry
You must be an expert in geometry from your posts.
To prove it why don’t you tell everyone how much insolation each m^2 at the edges of your flat disk receive looking North, East, South, and West at a single point in time when the sun is directly overhead at the center of the disk?
Zero. Which Is merely the result of division by 4!
So not every place on that flatcircular plate receives the average!
That should tell you that T^4 is much greater at some points than others. That means common radiation diagrams are useless.
Now answer why solar panels at latitudes ±60° are useless.
Good Lord. The amount of solar radiation incident on the earth has nothing to so with T^4 for either the sun nor the earth.
Seems you didn’t learn that the Moon and Earth are 3 dimensional objects…. even in your failed freshman week.. before dropping out.
Are you still a member of the Flat Earth Society ??
You might as well be claiming that a body’s emitted radiation is not proportional to absolute T^4. Your denial of basic physics is gobsmacking absurd.
Make up your mind. Oh I forgot, your weed smoking has messed with your mind.
Emitted radiation is based on the radiation absorbed. You don’t even understand what I said.
Using the “divide by four” idiocy is the climate equivalence of junior high.
That is where climate science is stuck.. junior high level (at best)
Thanks for pointing that out.
Does your 9th grade geometry make the solar irradiance heat the night side of the Moon?
The principles of geometry don’t apply to the moon?
“The principles of geometry don’t apply to the moon?”
Well yes, they do… The Moon is not a flat disk, either. !!
The principles of geometry apply to any sphere, but the Sun can only heat one half of the sphere at a time. Try to stay on topic.
Hi Genius. That’s why only the area of one side of the earths disk is used in the calculation! You know, as in pi r^2 (not 2pi r^2).
And spreading the disk area over four times its area is the unphysical nonsense.
You said “ Sun can only heat one half of the sphere at a time. “. And I said “That’s why only the area of one side of the earths disk is used in the calculation”
Do you agree or disagree with this answer?
The point is that due to T⁴, it is important to accurately model the insolation being absorbed and emitted at all points receiving insolation. Averaging simply is not a correct method to accomplish this mathematically.
You first have a sine function as the sun travels over the earth. Then you have a cosine function as the angle toward the poles change.
The point is that if the Moon had no albedo, and no heat capacity to keep its night side above zero K, its global mean surface temperature would be 112.94K below what the divide by four method predicts for Earth with no albedo.
If you want to get totally anal about it, there are a couple of other factors that can marginally increase the amount of energy the earth is capturing from the sun.
I believe when you talk about the radius of the earth, that value is measured to mean sea level (MSL). Mountains can temporarily increase the effective radius of the earth, but only when they are at the edges. (The portion of the planet that is approximately 90% from the line between the earth and the sun.
Also the atmosphere refracts the light passing through it, so that slightly more than 50% of the earth is receiving sunlight.
Finally, the atmosphere absorbs a portion of the light passing through it, so that some of the light that would otherwise miss the earth entirely, can still be absorbed.
Radius of the Earth at the equator 6378km, I don’t think an additional 9km for the Himalayas will make much difference, similarly for the atmosphere, it’s just a trivial adjustment. A bigger difference is that the radius at the poles is 6356 km.
It boggles ones mind how it is that so many on this thread (other than Phil) cant comprehend why the projected area of a sphere — ie, surface area divided by 4 — is used as the area on which the suns light is incident.
“It boggles ones mind . . . .”
In your case, I’m not a bit surprised.
I bet you also deny basic geometry. (Whoops! You’ve already demonstrated that)
Poor beetroot… mind like a turnip.
It is you that is stuck at the “basic geometry” level.
Incapable of even comprehending anything but a flat earth.
Your trolling seeks no bounds. I’ll compare my geometry knowledge with your lack of knowledge any day.
What a joker you are.
I have always thought the “divide by four” formula too simplistic, but I confess I had no idea how to wrap energy onto a sphere. About a year ago I came across these videos by Dr Markus Ott, which seem to have a better idea of how it should be done:
https://www.youtube.com/watch?v=Bj6ORbRBZ2s
https://www.youtube.com/watch?v=JXKHfL55G2A
There are a few more of his videos on Tom Nelson’s youtube channel, well worth watching them all.
Second video seems to get the logic and mathematics just about correct. 🙂
It should also be mentioned that the visible Sun sets after it actually does and rises before it actually does–due to atmospheric refraction. So the atmosphere actually makes the Sun illuminate more than 50% of the Earth.
I have spent time on deserts and in tropical forests. The difference in day-night temperatures is quite remarkable. There’s a large difference in desert day-night temperatures and a small difference in tropical forest day-night temperatures. The obvious explanation is the presence or absence of water vapor. Co2 is a non-player.
Yes if we were really wanting to be correct we would also need to look at the depth of the atmosphere the energy has to travel through to reach the surface.
Because of the angle of incidence, this is much greater at high latitudes than at the equator….
+, as you say.. refraction issues etc etc
The mathematics is so complicated that only a climate scientist would be stupid enough to claim knowledge. We’d need a Newton to figure it out–not a Greta.
Climate scientists never show any knowledge at all.
They still use the 1/4 nonsense… stuck at the kindergarten level.
Deserts tend to have fewer clouds and sand releases heat faster than dirt and foliage. They are greenhouse differences in addition lower water vapor
Someone tried to tell me that the Sahara has no clouds. I took this picture in the morning of our trip to Giza. It’s clouds above the Great Pyramid.
Interesting to see the chart at around 2:49 in the second video.
Here is a similar one I derived a few years ago using 1 degree lat/long and calculating the energy value using cos curves.. Then apply a colour gradient formatting to the cell numbers,… and shrink spreadsheet to 10% to fit on the screen.
Yes, it comes out square because of the Excel grid, so you have to imagine it “circular” in your mind…but very similar to what was in the slide.
I make the hemispheric heating value for Earth with no atmosphere but with 30% albedo (an oxymoron), 29.85°C. Include the 16% absorption of near infrared by water vapour and the 6% Rayleigh scattering, and it’s 11.85°C.
If the Moon rotated seven times faster, the sunlit side at any given time would still be close to equilibrium with the solar irradiance. The dusk terminator would be slightly cooler due to less regolith heating, and the dawn terminator slightly warmer because of a shorter night cooling time. The global mean should be roughly the same. The Lunar regolith doesn’t have enough heat capacity to cause appreciable lags, a 90K dark side temperature is only worth about 4W/m^2, which at a midday equator temperature of 394K, is worth about 0.3K.
I would not rely too much on Prof. Happer’s statements. Obviously he does not understand “the science” well enough.
When he claims 2xCO2 only produces a forcing of 3W/m2, or 0.71K, that is circumstantially true. It is true for clear skies (with clouds it will be less) TOA (top of the atmosphere). The problem is, this is not the “logic” consensus science claims. Accoring to it, CO2 forcing was the sum of the reduction in upwelling radiation at the tropopause PLUS the increase in downwelling radiation (from the stratosphere) there. The two “radiative fluxes” so to say. These are very different concepts.
By only naming the figures, which are wrong as they do not allow for clouds, he is talking around the main issue. Any “consensus scientist” can easily refute his claim by pointing out he did it wrong. The real issue is rather, what forcing concept is correct.
If you address this question instead, “consensus science” can easily be falsified, because it is self-contradicting.
https://greenhousedefect.com/unboxing-the-black-box
No idea what you’re talking about. Happer is clearly wrong, as you imply. But are you also saying that 130 years of scientific research, and thousands of published papers, are all overturned by one non atmospheric scientist who can’t even get his paper published in a reliable scientific journal?
You basically have “no idea” about anything. We have seen that on several occasions.
Happer is correct with what he does… just only considering radiative effects, which are a small part of energy transfer in the atmosphere.
You think you’ve overturned 130 years of climate research by spending 15 minutes in front of YouTube? Forrest Gump is a perfect description
So you are totally INCAPABLE of countering anything Happer has said.
Your slime is blowing straight back in your face… and you love the feeling.
Oh yes i can debunk Happer’s nonsense. Or to put it more succinctly, 130 yrs of scientific research, summarized here, debunks Happer’s nonsense. https://www.realclimate.org/index.php/archives/2007/06/a-saturated-gassy-argument/
Poor muppet, didn’t even understand the basic chart at the top.
So much junk science in your link it’s hard to know where to start.
Now. evidence for warming by atmospheric CO2
Or just keep FAILING. !!
As to underscore my point, that comment by Pierrehumbert outlines the incompetence on both sides. Yes, he is right in calling out the “saturation” and “absorption” nonsense, argued by people not understanding the basics.
Then Pierrehumbert goes on to expose his own total incompentence. Among a lot of other nonsense, he quotes the famous “cold desert” urban myth:
No, warm deserts like the Sahara do not like to freeze over night. DTR (daily temperature range) there is nothing unusual. It is up to 20K like in most non-oceanic places with clear skies.
What he actually means is the sand, which has a large DTR. But then it does not matter if it is sand in the desert, on a beach, or in a sand box. Sand has very low thermal conductivity and thus a large DTR. It is has nothing to do with the atmosphere above it.
And that is what we are talking about. 130yrs of accumulating entitled incompetence.
Pierrehumbert is correct and you are wrong.
From NASA: “Temperatures in the Sahara can plummet once the sun sets, from an average high of 100 degrees Fahrenheit (38 degrees Celsius) during the day to an average low of 25 degrees Fahrenheit (minus 4 degrees Celsius) during the night”
That’s a figure I first heard regarding hot deserts while I was in high school, but it seems to be just a good story.
Perhaps there are places in the Sahara with larger diurnal ranges, but even in Algiers, the largest average rang seems to be around 20 degrees C.
A similar range occurs in Alice Springs, in common with much of inland Australia.
‘Seems to be just a good story’.
I think you’ll more than an opinion to show that NASA’s data is wrong.
NASA may well be correct, but the Morocco and Algiers weather info doesn’t seem to support the size of the range.
The purpose of my post was to correct E Schaffer, who erroneously implied Dr Raymond Pierrehumbert was incorrect to state that “That’s even the case for water vapor in places where the air is very dry. (When night falls in a desert, the temperature can quickly drop from warm to freezing. Radiation from the surface escapes directly into space unless there are clouds to block it.)”
The professor appears to have been correct.
I wasn’t commenting on the purpose of your post, just the claim of a 40+ degree C average diurnal range in the Sahara during summer.
A 20 degree C range in dry areas seems rather more common.
The 100 degree F in the day and below freezing at night story impressed me at age 16, and I would still like it to be true, but it seems likely to be something which might occur when a cold change comes through rather than a regular occurrence.
Do you have data for a location where that diurnal range exists?
No, you’ll have a go to NASA for the data.
There were only 4 hits on that quote, none of which had a link to NASA data.
The reference may have been to NASA’s Earth Observatory, but that doesn’t have supporting data. Their example is Cairo, which has a 15 degree C diurnal range in summer.
Unfortunately, it does seem to just be a good story 🙁
Ah this might be where it came from, and misinterpreted. (same link)
“The daytime temperature averages 38°C while in some deserts it can get down to -4°C at night.”
This might be comparing summer daytime averages to winter night time averages, or perhaps contrasting high and low deserts.
I understand you may not have been able to find the original source, but it here is. Now you can quiz NASA if you have more questions: https://earthobservatory.nasa.gov/biome/biodesert.php#:~:text=During%20the%20day%2C%20desert%20temperatures,(about%2025%20degrees%20fahrenheit).
Thanks. That’s the link I gave above.
Climatogram of the Sahara: average = 22.5 C days, 17.4 C nights.
That’s quite a small temperature range, and doesn’t really seem to tie in with the previous section of that page, or the temperature ranges for some of the inland areas of the Sahara.
The figure seems to be for 48 degrees M. Athens is at 38 degrees N. Tunis is at 37, and about as far north as you can get in North Africa.
LOL! You want to challenge me with NASA? Looking up climate data is not rocket science. Just check out Faya-Largeau in Chad, a place as desert as it gets..
https://en.wikipedia.org/wiki/Faya-Largeau
Not just is the DTR there consistently <20°C, the record lows are all above freezing. Never were there -4°C.
Anyone with a brain might have realized anyway, that a general claim temperatures would drop to -4°C “in some deserts” is beyond debility.
So, I am afraid Pierrehumbert is an idiot, there are definitely lots of idiots working with NASA, and now guess what you are..? 😉
I’ll leave the Chad weather data to you; I’ll stick with NASA.
Oh, that I believe you! It is about science, complicated stuff, you know. I did not say Happer is wrong, but that he only read the 3W/m2 from a radiative transfer model, which is not a huge achievement, while failing to provide the far more important context.
Science btw. can not be measured in years, no. of scientists or papers, or any quantity. It is all about quality.
For which you seem to be as clueless as Happer
Coming from a very ignorant and gormless fool…
… that is a totally meaningless comment.
No it’s absolutely descriptive and accurate. You post gobbledygook as justifying your position that you’ve overturned 130 years of scientific research by 5 minutes of contemplation. Dunning Kruger.
“. . . 130 years of scientific research . . . .”
You failed to note that every “prediction” by so-called “climate scientists” have been wrong.
Sorry there are no such failed predictions by climate scientists. Nor can you cite any. They are unicorns, ie, nonexistent
Simply click on the “Failed Prediction Timeline” at the top of this site. It might enlighten you–but I doubt it.
“ no such failed predictions by climate scientists”
OMG the absolute ignorance of a beetroot !!
There are huge lists of them. !!
You can’t cite even one. Because they do not exist.
You didn’t click on the “Failed Prediction Timeline” or you wouldn’t make such a stupid statement. Trolls are just a waste of time.
Beetroot has to figure out what “click on” this link means.
This one is truly the most ignorant trollete we have ever seen !!
Yeah I did. None of these are failed predictions BY CLIMATE SCIENTISTS
Now you are flat out LYING since some of the predictions were indeed made by scientists and the overrated IPECAC (IPCC) the first three prediction failures show it was made by Scientists.
Your credibility is in the toilet.
Heh, heh, heh.
BWAHAHAHAHAHAHAHA…..
Show just one, or go away. There aren’t any false predictions by climate scientists. None. Nada. Do not exist. They’re either media predictions, or false claims by Deniers (yuck)
You are LYING again since it has been well known for years that scientists have made failed predictions, but you are a typical warmist/alarmist who as a group are known for LYING and IGNORING hard science research because you are wedded to a delusion cult.
You can’t cite even one!
There are eleven pages of citations. Blind adherence to the narrative. It’s a typical troll.
There are precisely zero peer reviewed scientific papers that include failed predictions. But there are lots of newspaper articles!. 😂
Those newspaper articles are quoting “scientific papers.” It’s more stupid troll-ism!!
You aren’t thinking straight. The newspaper quotes are about the likelihood of future events. Since we don’t have a Time Machine, how do you know the predictions will not come true?
The real question is how do you know they will come true.
Do you have a crystal ball you can look into or did your Magic 8-ball answer your question?
Does your device tell you the deterministic answer for coupled non-linear chaotic systems for any given date?
I have no idea whether the prediction will come true. And neither do you. So how can it be considered a ‘failed prediction’ since we don’t have a Time Machine we can use to determine whether or not the prediction will come true?
They are “failed” predictions. I guess English isn’t your first language.
If it’s a prediction about the future, and we are not yet in that future, how is that a ‘failed’ prediction?
It’s about PASSED failed predictions. Are you really this ignorant?
So now you are moving on from the large number of citations in the timeline that are future ‘failed predictions’ (ie, oxymorons), to predictions that have had a chance to play out. Unfortunately for you, there are no ‘already failed’ predictions that have been made by climate scientists. And I look forward to your failed attempts to cite any.
Future? Are you really this dense?
Still waiting for you to cite any of those unicorns. So far, the only failure seems to be your failure to cite any failed predictions by scientists..
I see you are still posting. When are you going to answer my questions. I have responded to yours. Show a little personal pride in yourself and answer mine.
———–
Since you are obviously familiar with how college professors treat temperature, you should have no problem providing a textbook example or class notes showing how temperatures should be averaged and the results of averaging them.
————-
Tell us how “Michael Mann, Gavin Schmidt, or Jim Hansen” have followed NIST guidance for calculating reproducability uncertainty in their results.
Don’t just tell us to read their works. You have obviously done the research to validate their work or else you would be guilty of the argumentative fallacy of Argument From Authority. That would make your references worthless.
—————
Why don’t you answer with your bona fides?
I’ll give mine so you won’t feel bad.
I have a BSEE issued in 1973 from the University of Kansas.
Now let’s see your claim to fame.
————
My Personal info is none of your business. And as far as Climate Scientists following NIST guidance, I have no interest in that inside baseball
This site needs to attract a better class of trolls. The current ones are really wanting. They don’t even know that “failed predictions” means predictions that didn’t come true.
And others need to be informed that predictions of an event to occur in the future cannot be considered to have failed if either a) that future time has not yet arrived, or b) we lack a time machine to check the future against reality.
Typical liberal. You need to remove your mask. Your brain cells need more oxygen. If in 1960 they predicted that all life will end due to acid rain by 1970, then is 1970 going to happen in the future or did it already happen? I know, you haven’t a clue.
And still no citations of any ‘failed predictions’ from you, Gorman. What a surprise!
Click on the link at the top of this site. There are eleven pages of citations. What a surprise that you are unable to do so.
And none of them — that is ZERO — fit the definition of a’failed prediction by a climate scientist’. It’s still up to you to single one out if you think you’ve found one and cite it specifically – then I’m glad to discuss.
But since you’re unwilling so far to do so, then You are the Fail!
I guess reading is not your strong suit either.
You’re playing that stupid game of “here’s a long list”. But I’m not biting. If you’re courageous enough to cite a specific ‘failed prediction’ then we can discuss it. But since you lack that courage, I know you’re blowing smoke.
You are one of the CAGW faithful. Nothing I say will convince you you to repent your sins. You’ll have to get absolution elsewhere.
Here’s one everyone might like from 1993: “Environmental Refugees in a Globally Warmed World: Estimating the scope of what could well become a prominent international phenomenon”
The author, Norman Myers, had a 1973 Ph.D. in conservation and development from UC Berkeley, and died in 2019 as a highly regarded environmental scientist.
Lead-off quote: “The gravest effects of climate change may be those on human migration as millions are uprooted by shoreline erosion, coastal flooding and agricultural disruption.-Intergovernmental Panel on Climate Change (1990)”
And from the 1993 conclusion: “In a greenhouse-affected world of the future, they are likely to become a prominent feature of our one-Earth landscape due to the burgeoning phenomenon of environmental displacement.”
Nary a one has appeared.
Google Scholar lists 676 citations of that paper, including by Paul Ehrlich, never one to pass up an opportunity to doomsterize wrongly.
And here’s Michael Mann, a bona fide climate scientist™ decrying “refugees fleeing environmental degradation” in October of 2023. A cynically opportunistic misrepresentation of cause as ever there was.
Nevertheless, millions of climate refugees purportedly moved to flight by the carbon dioxide demon: an explicit and failed prediction made by so-called scientists who do no science.
How do you know whether the migrations will occur, or not? Do you have a time machine?
We’re now 31 years beyond Myer’s 1993 claim of 10 million climate refugees. They weren’t there then, and they’re not here now.
In 2002, Myers predicted 50 million climate refugees by 2010. They never appeared. Like the climate tipping points. Always just around the corner.
Gee, in addition to your failure at statistics, you now fail basic English. Myers never predicts. He uses ‘could’, not ‘will’.
From Myer’s paper: “In the light of patterns and trends of environmental decline … it is probable that by 2010 there will be another 25 million such refugees on top of the 25 million in 1995,”
“Probable that” is a prediction.
Another failed prediction from the paper: “The numbers of people in
absolute poverty [in sub-Saharan Africa and India] are predicted to swell from 1.3 billion to 1.6 billion.” Wrong again.
Poverty has been declining globally since 1850, more rapidly after 1950, and no change in the steep slope after 2002. Poverty in India has been in steep decline for decades, and even much of sub-Saharan Africa is in better shape today than it was in 2002.
In Africa the child-labor mining of metals for your ever-so-virtuous renewables(sic) has been a major force for poverty and degraded lives.
So you are using someone that uses shoulda, coulda, woulda as evidence that you KNOW what is going to occur?
That earns another clown!
🤡🤡🤡🤡🤡🤡🤡🤡🤡. You’re now up to nine stupid statements.
The author is using ‘Could’, not ‘will’ occur, so he is not making a prediction. As usual, you got it backwards.
Yet you make everyone else’s personal info your business when you make ad hominem attacks about their knowledge and schooling.
You are the one that said:
You thereby inserted yourself into my personal life. You have also made insinuations about the education and abilities of others. That, my friend, is inserting yourself into their personal lives.
You are a pure hypocrite when you turn around and refuse to open your education and science background to those you have impugned.
As a hypocrite nothing you post carries any weight. Your debating skills are atrocious and will never convince anyone that you know what you are blathering about. I truly do feel sorry for little twits such as yourself. You will never experience the joy of intelligent discourse and debate. The only satisfaction you will ever have is creating ad hominem attacks without any substance whatsoever. What a dull existence you must have.
Lastly, as to your dismissal of knowledge:
Of course you don’t! You wouldn’t know a measurement of a physical quantity if it came up and bit you on the butt! This attitude is exactly what Dr. Pat Frank has been stating and covering and you just EXEMPLIFIED his observations and critique’s. How does it feel to have shown your incredible ignorance of physical science?
PS:
You still haven’t answered this question yet.
———–
————-
I’ve already said I’m not interested in your resume.
And since university textbooks often perform averaging, or other mathematical operations, on intensive properties, have you informed those professors as to the error of their ways? Or written a peer reviewed paper explaining why it shouldn’t be done, to the critical acclaim of the scientific world ?
Why are you attempting a baldface lie?
This is what you said.
That IS involving yourself in my resume.
Now you are not only a hypocrite but have moved into the realm of libeler. Congratulations! 🤡
130 yrs of scientific research, summarized here, debunks Happer’s nonsense. https://www.realclimate.org/index.php/archives/2007/06/a-saturated-gassy-argument/
Garbage science that does not counter Happer even remotely. !
Modern measurements show that any microscopic increase in absorption in the CO2 band is translated to the atmospheric window.
The clowns at “realclimate” are propaganda hacks.. nothing more.
No wonder you are so ignorant if that is where you get your information from.
The author –Dr Raymond Pierrehumbert – is a top scientist at the University of Chicago. As shown by your lack of any substance in your response, you aren’t fit to shine his shoes.
Humbert is a rabid anti-science AGW ACTIVIST….
Nothing more.
Certainly far LESS. !
Not to mention that he’s now Halley Professor of Physics at Oxford and an FRS.
https://www.physics.ox.ac.uk/our-people/pierrehumbert
Again.. real measure science is a total enema to you isn’t it , beetroot-brain !!
I’ll leave his shoe-shining and a**e-licking to people like you.
The only thing you are fit for.
The image distorts the situation because it is plotted vs wavelength, it should be either energy or wavenumber.
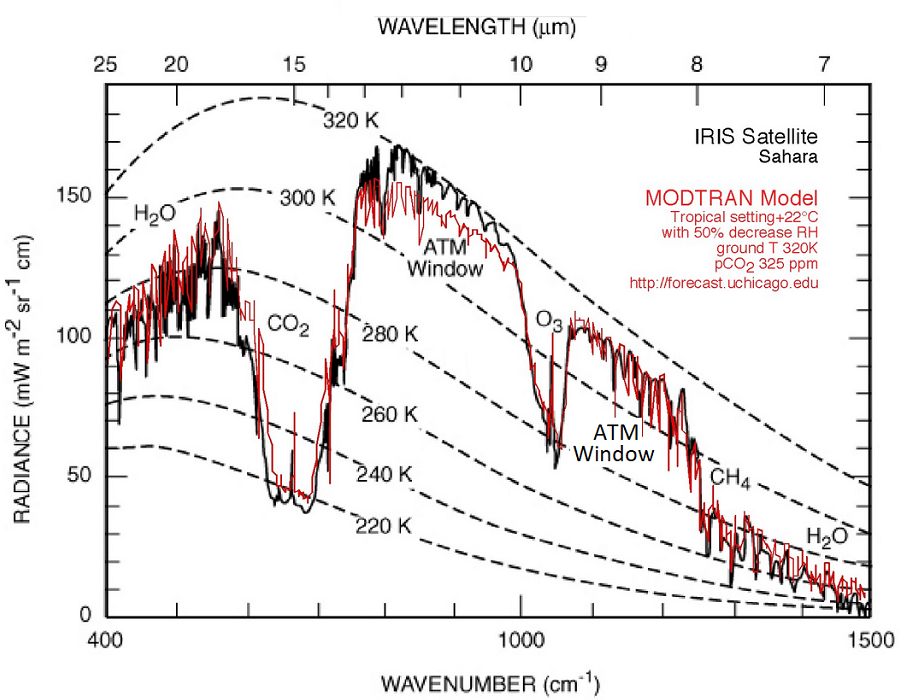
How many years of science and how many published papers did Einstein “overturn”?
As to not being able to get papers published, who was it who declared that he would keep opposition papers out of the journals, even if he had to redefine the meaning of “peer review”?
You’re not Einstein.
You aren’t even the equivalent of beetroot.
You are not Elmer Fudd either.
Since when is it required to be an Einstein to quote Einstein? What a stupid troll!
This report includes everything needed for a brilliant article but is way too long, veers off the subject too often and makes a few exaggerated points about plants and CO2. Desperately needs editing!
Unnecessary historical climate rough estimates do no reveal anything about manmade climate change variables because there were no manmade climate variables woth mentioning before the 1960s.
Happer’s last prediction for CO2 x 2 was +0.7 degrees C. That’s the low end of the range of predictions with +5 as the high end that I’ve seen. There is no reason to believe Happer is correct and everyone else is wrong
The main open question is the water vapor positive feedback where I’ve seen estimates of from zero to 6x amplification of the warming effects of CO2 alone. The obvious answer is no one knows. That subject is controversial and needed more attention here.
The claims about CO2 and plants were exaggerated.
The claimed CO2 starvation today somehow supports 8 billion humans and many animals. That is not CO2 starvation.
Real CO2 Starvation:
I have read about 200 CO2 enrichment plant growth studies in the past 26 years. Real climate science. Only one tested C3 plant growth at 150ppm CO2. I recall the growth was less than 10% of normal.
C4 plants can survive down to 10 ppm CO2
That would support some life: Corn, sugarcane, sorghum and pearl millet belong in this family. Also grasses for anumals..
Earth is not reaching 150ppm or even halting the rise of CO2 above the current 420ppm, so who cares about 150 ppm?
“C4 plants can survive down to 10 ppm CO2
That would support some life: . . . .”
Most plants, 95%, are C3. 10 ppm would kill most plants and most animals that live off of those plants.
“Earth is not reaching 150ppm or even halting the rise of CO2 above the current 420ppm, so who cares about 150 ppm?”
So your argument is: “Let them eat cake?”
Your positions are mostly nonsense. You apparently want more CO2, but your comments say the opposite.
If I want nonsense and insults, I will read your comments
All life on this planet does not end with CO2 below 150 ppm. That was an exaggeration.
What percentage of the world’s plants are C4?
Less than 1% of Earth’s plant species can be classified as C4, but they account for around 20% to 25% of global gross primary productivity
What percent of plants use C4?
C4 Photosynthesis
Although small in terms of total number of flowering plant species (3%), they constitute ∼50% of the 10,000 grass species. Their productivity is high and C4 grasses in savanna regions (15% of the Earth’s vegetated surface) are responsible for ∼20% of global photosynthesis.
So I researched C3-C4 plants before there was such a thing as Wikipedia. Back then, C3 plants made up about 95% of plants, C4 are about 3-4%, and CAM make up the rest. Since then, I noticed that the C3 percentage ranges from 85% to 95%. The troubling thing is that Wikipedia claims the C3 percentage is at 95% (I’m spring-loaded to Wikipedia is wrong). I’m not sure where you.re getting your info, but I really don’t care.
I completely forgot to mention why I rejected this article for my blog’s recommended reading list today. It was this paragraph:
“a further doubling of CO2 concentration, (Equilibrium Climate Sensitivity), 420–840 ppmv would continue to increase Global Plant productivity but could only have a further ~1% or ~+0.35°C effect on Global temperature.”
That is the lowest ECS number I have ever seen in 26 years of climate and energy reading. It is about half the HITRAN or MODTRAN estimate with no water vapor positive feedback. I also wonder about the accuracy of “85% saturation” since CO2 saturation never reaches 100%
I can’t go for that
Hall & Oates – I Can’t Go For That (No Can Do) (Live) (youtube.com)
“why I rejected this article for my blog’s “
Can’t let anything ruin a perfectly bad nonsense blog, now can you !!
“in 26 years of climate and energy reading”
… of AGW mantra propaganda.
Thank you Forrest Gump of Climate Science
My blog reached 730,000 lifetime page views this week. Three people read your there is no greenhouse effect comments. And one is your mother. I read them for a h good laugh.
Your billy madison style comments just make everyone who takes any notice of them.. A LOT DUMBER. !!
Are there any good studies on CO2 saturation?
Many, starting with Svante Arrhenius in 1896, who debunked the bs being perpetrated by Happer. No atmospheric physicists believe this nonsense.
No-one believes the crap you put forward.
The only thing Arrhenius did was figure out that CO2 was a radiatively active gas.
Anything else was based on false assumptions from very simplistic models.
He couldn’t even get his equations to balance dimensionally.
Science has progressed considerably since then
Climate “science” (so-called) has not !!
youre not even a competent scientist. How would you know?
Sorry muppet… you missed again.
Go get a junior school education.. as a starting point.
im always astounded when a non entity thinks she’s overturned 125 years of scientific research by thousands of PhD scientists by watching 15 minutes of YouTube videos. Dunning-Kruger personified.
I doubt you actually read Dr. Arrhenius 1906 paper which he dials back the CO2 effect.
Here’s what he said
”If the quantity of carbonic acid [ CO2 + H2O → H2CO3 (carbonic acid) ] in the air should sink to one-half its present percentage, the temperature would fall by about 4°; a diminution to one-quarter would reduce the temperature by 8°. On the other hand, any doubling of the percentage of carbon dioxide in the air would raise the temperature of the earth’s surface by 4°; and if the carbon dioxide were increased fourfold, the temperature would rise by 8°.”
ie, a CS of 4C.
Here’s why you’re wrong (as usual)
https://www.realclimate.org/index.php/archives/2007/06/a-saturated-gassy-argument/
Junk science waffle from a propaganda site.. NOT SCIENCE.
Try again, beetroot. !!
A guy called Leckner did actually measurements.. you know.. real science
And found that the so-called “absorption” levelled off at about 280pmm
Of course the IPCC just draws a straight line through the purple points, its all they know how to do.
Right here: https://www.realclimate.org/index.php/archives/2007/06/a-saturated-gassy-argument/
Same junk-science propaganda waffle.. Not science.
The bolded part makes no sense. The reference intensity is a black body. “Saturation” is synonymous with reduction. And intensity is zero bound. While theoretically you can’t get to 100%, 85% is no problem, and supposedly what we are seeing.
I have never seen a percentage such as 85%
The big debate is over feedbacks to CO2 caused warming, for CO2 x 2
What does percentage saturated tell us?
For a spectral absorption line to be saturated means that the population of the excited state is equal to the population of the ground state.
there ya go Richard.,
clamor about half full … get excited about half empty; and jump to iffy conclusions about intent.
What do you do when somebody tells you it is at 50% of capacity.
” … in 26 years of climate and energy reading.”
Tell us again how ‘it was a long paper so you just skimmed the summary’.
This one is for you dickie..
The Conclusion Humans Drive Atmospheric CO2 Increases Is Undermined By Carbon Isotope Data (notrickszone.com)
I expect to see yet another blustering tantrum 🙂
This is from one of the his main references:
“Since the Industrial Revolution, the carbon isotopic composition of atmospheric CO2 has undergone dramatic changes as a result of human activities and the response of the natural carbon cycle to them. The relative amount of atmospheric 14C and 13C in CO2 has decreased because of the addition of 14C‐ and 13C‐depleted fossil carbon, while the nuclear bomb tests increased 14C in the atmosphere in the 1950s and 1960s. Measurements of Δ14CO2 and δ13CO2 have been used to make invaluable contributions to our knowledge of atmospheric mixing, air‐sea gas exchange, plant function, and fossil fuel emissions.”
https://www.ncbi.nlm.nih.gov/pmc/articles/PMC7757245/
Yes.. and the measurements in the isotope have shown that the information in your citation was incorrect.
Is that what you are trying to point out ??
“Measurements of Δ14CO2 and δ13CO2 have been used to make invaluable contributions to our knowledge of atmospheric mixing, air‐sea gas exchange, plant function, and fossil fuel emissions.””
And they show very little fossil fuel in the atmosphere.
The measurements cited in the paper I referenced showed that there is a contribution from fossil fuels. For some reason the Notrickszone paper did not consider C14.
No tricks zone?? YGTBK
A site that puts forward actual measured science.
Yes, a total anathema to gormless twits like you.
You prefer brain-numbed alarmist propaganda sites.
So you think Notricks zone is SCIENCE? OMG.. You are absolutely submerged in your own little world of fantasy.
Nothing you have produced remotely resembles “science”
NTZ presents a peer-reviewed, measurement-based paper.
REAL EMPIRICAL SCIENCE.. pity you are clueless of what “science” actually is.
Link, please
He posted the LINK right in your face, you wearing bad glasses?
You must have eaten it. It’s nowhere to be seen.
It is constantly forgotten how thin the Earth’s troposphere is, in which weather processes take place. Any additional amount of gas increases the density of the troposphere and allows it to maintain a stable temperature near the surface. Between autumn and spring, the troposphere in high latitudes lowers to about 6,000 meters on average. The influence of the stratosphere during the winter season is so strong that the loss of energy of the troposphere is unstoppable.

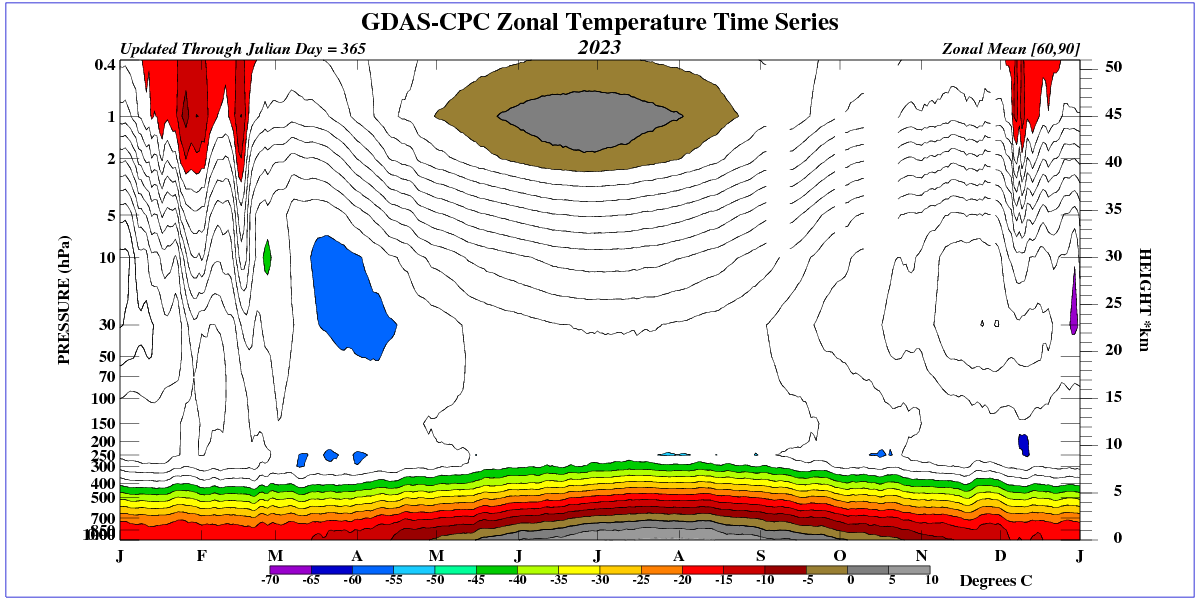
Perceived temperature in North America for March 21.

And… what about the clouds ???
What about the clouds?
OMG your ignorance is boundless. !!
wrong image.. next post shows the one I wanted.
clouds vs UAH
And what about the last decade?
Absorbed solar energy continues to increase.
Scientific source?
Try this one instead, beetroot.
Sources clearly stated.. measured data… not baseless supposition.
And your scientific source is what?
Actual measurements….. not baseless theory.
You should try it.
It is right there is the chart.
LOL
A chart with no title, no labels, no source. Genius! Not traceable — so you can claim anything.
The error in massive feedbacks was due to many Climate Scientists having negligible training in thermodynamics. Let us say that the “average” temperature is 300K. And we look at the feed back for a 2K forcing. If you know thermo, you instinctively would go to ABSOLUTE temperature, and use a ratio such as 302/300. From the Monckton articles, it appears they use “2”. The difference gets ugly fast, and thus you end up with catastrophic destructive feedback (in the models).
I was truly amazed when Lord Monckton, 3rd Viscount Monckton of Brenchley, revealed this error. It took me awhile to accept that they had actually done something so clueless.
That is one of the things they are clueless about, but not the only one. They also seem to have failed to grasp that EM radiation is an energy phenomenon, measured in Joules, not a power phenomenon, measured in Watts. That’s pretty fundamental too.
It is easier to accept how clueless they are when you realize that their goal is not to understand science, but to separate you from your money.
The error in massive feedbacks was due to many Climate Scientists having negligible training in thermodynamics. The IPCC was set up to scare people about dangerous manmade global warming. They need a large positive feedback to do that. I took a thermodynamics course on the way to a BS degree. I don’t recall being trained to invent a large positive feedback if you want to scare people. That’s pure leftist politics, not science!
If you want a large positive feedback, tell your wife she looks younger than she did 20 years ago.
Feedbacks were invented? Oh come on.
There is no scientific evidence a positive feedback exists…
… just conjecture (like warming from CO2 is an unproven conjecture)
If you think there is scientific evidence.. produce it.!
So do you deny that when arctic sea ice melts it increases the surface area of darker ocean exposed to sunlight, increasing heat absorption by the planet?
How much insolation does the Arctic circle receive of the sun’s radiation? In summer? In winter?
You should know that’s irrelevant. It’s positive feedback, whether it’s 5% or 50%.
Insolation (sunlight) is a feedback? You truly are nuts!
Why don’t you answer the questions I asked. You are a geometry expert so you shouldn’t have a problem calculating it!
It isn’t a hard question.
You’re off topic, and diverting attention from bnice2000’s mistake. So you can answer your own question.
It isn’t off topic. It directly addresses your points about dividing by 4 and about insolation warming the Arctic seas.
Why don’t you admit that you are out of your league when discussing science? You make a very good troll however with your ad hominem attacks
Only mistake I have made is thinking that a gormless idiot like you could possibly be educated to recognise reality or science.!!
WRONG ! Less sea ice allows more energy to escape.
That makes it a negative feedback.
Stop making scientifically illiterate comments.. you are wasting everyone’s time.
Over the year as a whole the pole receives about 40% of the insolation at the equator.
You might want to rethink your math. Let’s just look at the North Pole. The Tropics of Cancer lives at ~24°N. When the sun is at that point, there are ~66° to the pole.
Cos 66 = 0.41
That is about 40% of what is received at the Tropic of Cancer.
As the sun moves toward the Tropic of Capricorn, the North Pole receives 0% (cos 90 = 0). Assuming equal times, the pole would receive ~20% of what the equator receives. Think about why there are months of darkness. Forty percent of the equator would make solar panels useful at the poles.
As Nick Stokes implied in his post, you still seem confused. To calculate the amount of light incident on a sphere, just use the area of a disk representing the projected area of the sphere by dividing the surface area of the sphere by 4.
It’s all good. Your Denier friends will ultimately respect you when they realize they were wrong, too.
If you and Nick are sure of that, then explain why the poles have months where the sun is below the horizon and for a substantial period of that time the only light is scattered light from the atmosphere and not insolation from the sun!
I can’t believe you still struggle with high school geometry.
Nice dance but you are displaying your ignorance of 3 dimensional objects.
If you can’t answer a simple question where answers to it are all over the internet you are showing your inability to do scientific research.
🤡🤡🤡🤡Four clowns for your ignorant answer.
Actually it’s you who needs to rethink your maths, the times are not the same, as well as months of darkness there are months of daylight.
Your link doesn’t work.
Here is what I said using math.
How about you respond with some math and references.
Sorry that does not work, it did when I posted it. The essential error in your maths is the assumption “Assuming equal times”, the times are not equal.
Here’s a discussion of it:
“Based on this analysis, daily insolation will vary strongly with season at most latitudes. As shown in Figure 2.10, daily insolation at 40° will range from about 160 W/m2 on the December solstice to about 460 W/m2 on the June solstice. Insolation drops to zero at the North Pole at the September equinox, when the Sun’s circular path sinks below the horizon, and does not increase again until the March equinox. However, the peak insolation at the June solstice is greater at the North Pole, about 500 W/m2, than at any other latitude. At the Equator, daily insolation varies from about 380 W/m2 to about 430 W/m2 and there are two maximums—each near the time of an equinox, when the Sun is directly overhead at noon. At the solstice, insolation is lower because the Sun’s path is lower in the sky (Figure 2.9).”
Ref: https://geography.name/insolation-over-the-globe/#google_vignette
Someone needs to show how this is possible. The sun, when it is at the Tropic of Cancer (~20°), which is the highest latitude the sun is directly above, will receive the maximum insolation. As you move to higher latitudes the insolation absorbed is less due to relfection.
I’m sorry, but to claim the North Pole receives more insolation than any other latitude is nonsense.
Didn’t you read the link, it’s explained quite clearly, it’s because of the tilt of the Earth and it’s effect on the length of day.
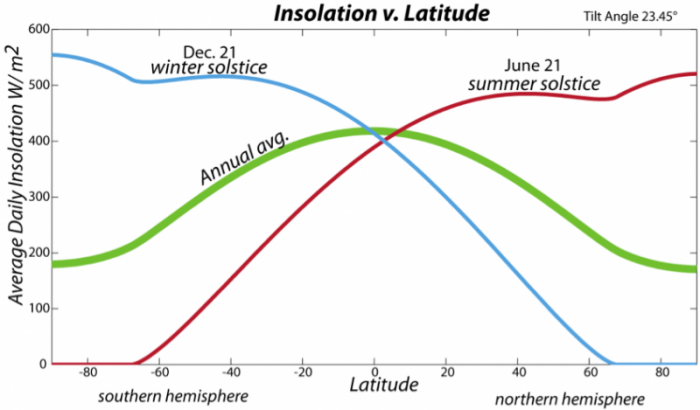
I did look at it. Look at Figure 2.7. It shows that the insolation at 30° is 1/2 that at the equator in terms of W/m² when the sun is directly overhead in the equator.
Figure 2.7 is using a sphere and is correct. Get a calculator and what is the cosine of 60°? (That is the difference from vertical, i.e., 60°)
I’m not sure where your graph is originating. Figure 2.10 looks similar to yours and is based on a flat earth. That is very misleading and does not follow what Figure 2.7 shows.
Using a flat disk to obtain insolation is not real. Ask yourself, does the North Pole truly receive more insolation than ANY OTHER LATITUDE even the equator? The tropics do have a definition, what is it?
Figure 2.10 shows the poles receiving more insolation in July than the equator when the sun is directly overhead at 0°.
From:
Tropics (nationalgeographic.org)
This definition of the tropics are all over the internet. It just doesn’t go along with the pole receiving more insolation than the tropics.
My original statement was that “Over the year as a whole the pole receives about 40% of the insolation at the equator”, that’s a fact!
You need to read the graph’s axes labels, it says “Average Daily Insolation” which is higher than the Tropic of Cancer at the Summer Solstice because it’s receiving insolation for 24 hrs whereas at the tropic the day is only 13hr 35min long. It has nothing to do with a flat Earth.
I suggest you need to read the articles and not make false assumptions.
As I said, look at Figure 2.7 and tell me that the Pole receives more.
Remember a lot of the “sunlight” is not insolation. It is refracted light as the sunlight passes through the atmosphere.
OK I can see I have to take it slowly with you!
You said:
“The Tropics of Cancer lives at ~24°N. When the sun is at that point, there are ~66° to the pole.
Cos 66 = 0.41
That is about 40% of what is received at the Tropic of Cancer.”
Based on that the polar insolation at noon is 40% of that at the tropic. The daily insolation at the tropic is the integral under the sine as it starts at zero and returns to zero 13hr 35min later, at the pole the daily insolation is 40% of that tropic value integrated over 24hrs since the sun doesn’t set.
Get it now? I’ll let you practice your integration skills.
It’s always a good idea to take it a bit slow with Gorman.
Tell everyone why the sun does not set!
Is it because there is direct insolation from the sun, or is it because of scattered sunlight without much power?
You have also moved to total daily insolation as compared to an average at a point in time.
You might explain why, if the pole gets so much sunlight why do places like Canada don’t get about as much.
See this page:
https://www.coolgeography.co.uk/A-level/AQA/Year%2013/Weather%20and%20climate/Climate%20controls/Insolation%20and%20the%20atmosphere.htm
As you can see above, because of the curve of the Earth a sunbeam of Insolation hitting the Earth at higher latitudes has to spread out over a larger surface area than one reaching the Equator. Thus lowering the amount of Insolation per km2 in more Northerly and Southerly latitudes. In addition, because the insolation hits the atmosphere at a greater angle in more northerly and southerly latitudes it has more atmosphere to pass through (despite the lower atmosphere being thicker at the Equator than it is at the Poles because of available heat energy). The result of this is that at higher latitudes there is greater chance of scattering and absorption which lowers the amount of radiation received.
“Tell everyone why the sun does not set! ”
The sun does not set at the N Pole during the summer solstice because the pole is pointing in the direction of the sun and since the axis of rotation of the Earth passes through the pole the angle doesn’t change. If you stood at the pole on that day the sun would appear to be ~23º above the horizon all day. (See this Fig2.9 from the article I referenced)
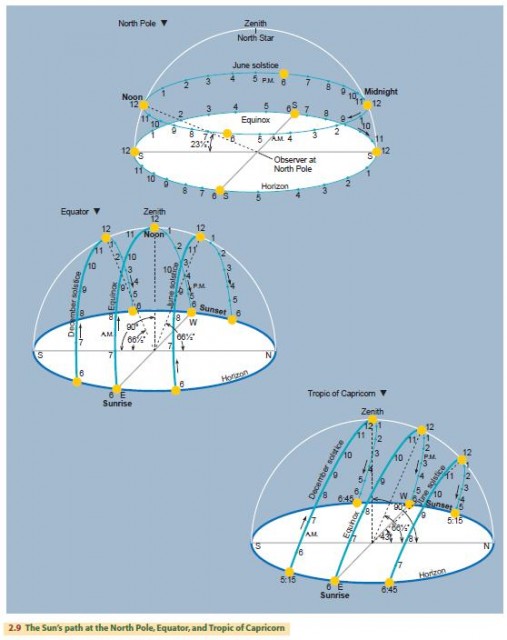
“You have also moved to total daily insolation as compared to an average at a point in time”.
As a result of your disputing that data in the paper I quoted and my needing to explain to you that it was a daily average not the instantaneous noon insolation as you appeared to think. Once you’ve understood that then we can move on to the annual integral which was the subject of my original comment “Over the year as a whole the pole receives about 40% of the insolation at the equator”.
Until you get that straight there’s not much point explaining complex second order effects such as Rayleigh scattering.
You didn’t answer the question about why locations in Canada don’t receive more daily insolation since they would receive even more insolation because of a more normal angle than the Arctic.
Thar was answered : Total hours of daylight are less below the Arctic circle. Or didn’t that sink in?
You are conflating daylight and insolation. Please note I am discussing insolation. Did you read the figure I posted about W/m²? Why don’t you show how it is wrong.
Why do neither you or Phil answer my question about Canada receiving more insolation than, say the U.S.?
Even after Phils explanation of the obvious relationship between number of daylight hrs and total insolation in 24 hours, you still don’t get it? Man are you ever slooow
🤡🤡🤡🤡🤡🤡🤡🤡🤡🤡🤡🤡🤡🤡🤡. Fifteen clowns, good work.
You neither quoted what I said, did not address the information in the figure I referenced about W/m², nor show any references about insolation.
So you admit you are wrong about the Pole and now you’re changing the question.
Most of Canada is south of the Arctic circle so the sun will set there. Take a look at Fig 2.10, it shows the difference.
Look at figure 2.7. It shows Solar Intensity and Sun Angle.
See that last figure where the angle is 30°. It shows that insolation is 1/2 that of the equator at 90°.
Now figure 2.10 shows the sun at an angle of 23° at the North Pole. Cosine of (90 – 23) = 0.39. The cosine of 90° (overhead) = 1.
Now for some numbers.
Seconds in 24 hours = 86400
Seconds in 12 hours = 43200
Watts are Joules / second
Assuming 240 Joules / (sec • m²)
240 • 0.39 • 86400 = 8,294,000 Joules/m²
240 • 1 • 43200= 10,368,000 Joules/m² (@ur momisugly Tropic of Cancer)
And, don’t forget the South Pole gets zero.
Plus, when the sun is at the Tropic of Cancer, there are really 13.5 hours of insolation, not 12.
These numbers are why temperatures drop as you go north from the equator. Since you won’t answer my question about Canada being warmer than the North Pole, now you have a reason.
Well you finally tried to do the calculation, just one error.
“Now figure 2.10 shows the sun at an angle of 23° at the North Pole. Cosine of (90 – 23) = 0.39. The cosine of 90° (overhead) = 1.
Now for some numbers.
Seconds in 24 hours = 86400
Seconds in 12 hours = 43200
Watts are Joules / second
Assuming 240 Joules / (sec • m²)
240 • 0.39 • 86400 = 8,294,000 Joules/m²
240 • 1 • 43200= 10,368,000 Joules/m² (@ur momisugly Tropic of Cancer)”
Your calculation for the N Pole is correct since the sun is at an angle of ~23 all day, however for the tropic you have assumed that the sun is at 90º from sunrise to sunset! As I pointed out to you earlier at sunrise the angle is 0º, increases to 90º at noon and returns to 0º at sunset. You failed to take account of that! So the correct answer for the tropic would be 63% of your answer ~6,600,000 which is about 80% of the pole value, an adjustment for the slightly longer day will make a slight difference which will be consistent with the graph I showed above.
240 is a 24 hour average done as how you originally did. .
You still aren’t explaining why Canada is warmer than the North Pole during the summer if the Np gets more insolation.
Nor have you addressed why Figure 2.7 shows insolation 1/2 the equator.
No, you used 240 in your calculations as the insolation at noon and failed to account for the rising and setting of the sun at the tropic. If you intended to use it as a 24 hr average you should also have used the 24 hr average of the angle, not 90º.
Regarding Canada, it is a landmass south of the arctic circle whereas the N Pole is an ice covered ocean, receiving a few percent more insolation.
No, 240 Joules / sec • m² is a daily average using a flat disk as you first showed. If you didn’t want that used, you shouldn’t have tried to pawn it off as a correct geometry calculation. It really doesn’t even matter what the actual daily average is. The ratios are what is important.
You still haven’t shown how Canada can be warmer than the North Pole during the months when the North Pole receives more insolation, say June thru August. The document you referred to doesn’t say why either. So it is up to you to explain.
You need to show some calculations like I have shown. Just saying they are wrong proves nothing. You want to be an expert show the math!
I was planning on doing that since it became apparent that you had no clue about the process.
At the summer solstice the following happens:
At the N Pole the sun is at ~23º all day (24 hrs) Icos(67)
At the Tropic of Cancer we have the following:
From midnight til 5:15 there is no sunlight (0)
At ~7:39 the sun is 30º above the horizon Icos(60)=0.5I
At ~9:45 the sun is 60º above the horizon Icos(30)=0.87I
At 12:00 the sun is 90º above the horizon Icos(0)=I
Then the process reverses until 18:45 followed by zero until midnight.
So then you need to calculate the average:
For the Pole it’s I*0.39
For the tropic is the integral of those values.
I make that ~I*0.35
So the tropic value is about 90% of the polar value, that’s the ‘important ratio’.
I don’t know where you got the 240 value from, I certainly didn’t bring it up and I never did any ‘flat disk’ calculation.
I get nearer 0.36, but that’s using 13.5 hours of light rather than your 13.
Yes either way supports the result shown in the graph I linked to which Gorman was objecting to.
Arctic sea ice is currently at a level far higher than for most of the last 10,000 years
Were you totally ignorant of that FACT , as well ??
And you are also WRONG.. proving, yet again, your abject ignorance of science.
More open Arctic sea ice allows more energy to escape.
And more to be absorbed.
“If you think there is scientific evidence.. produce it.!”
And of course.. you FAILED yet again.
Moncton is the clueless one. He leaves more errors in wake than Tim Ball
But still far, far, far less errors than Warren Beeton.
You do know that Moncton has no scientific education. Whatsoever. And that he was called bout by the House of Lords for falsely claiming a peerage. And that he has been easily debunked multiple times by those who simply trace his claims to his own sources. Which say something entirely different. In other words, he lies. And the gullible don’t know
You obviously have only read far left propaganda pap.
LORD Monckton is totally entitled to his peerage…
A change in rules, which he disagrees with, does not allow him to sit in the House of Lords parliament.
Pity you are, yet again, basing your comments on abject ignorance.
But we expect nothing else.
Lord Monckton would have several magnitudes more scientific and mathematical understanding than pitiful little you would ever be able to manage.
The problem is that Monckton kept claiming that he was a member of the House of Lords and had to be told to stop doing so.
“The Clerk of the Parliaments openly accepts that Lord Monckton is a peer of the realm, but he does not accept that Lord Monckton is also a member of the House of Lords. He has never been a member of the House of Lords and is not entitled to say that he is. The Clerk of the Parliaments’ Office has previously written to Lord Monckton saying this.”
Nothing like hypocrisy to make a good post, eh? Let’s see you denigrate Mikey Mann’s climate change work because he falsely claimed to be a Nobel Prize winner!
I was just addressing the comments about Monckton’s claim to be a member of the House of Lords, nothing else.
So the House of Lords says that Monckton is not member. And Monckton claims he is a member.
if you claim to be the President of Namibia, and Namibia says you are not, does that make you it’s President?
So Mikey Mann claimed he won the Nobel Prize but he was told he was not a Nobel winner, does that make him a Nobel Prize winner?
So if you don’t believe Dr Mann, why do you believe Monckton?
Because he worked with a professor of electrical engineering to design and build a feedback system that illustrates how incorrect the theory of climate feedback truly is.
You aren’t serious. Monckton has no more idea of what feedbacks are than my Doberman,
You’re a troll that can’t even read!
Monckton has magnitudes more understanding of maths, electronics, science etc etc than you or your more-intelligent-than-you doberman could ever possess.
You have proven yourself to be totally ignorant on basically every aspect of climate.. or anything.
What is it about climate alarmists, and the left in general, and their worship of academic degrees?
They actually seem to think that only someone who they recognize as an authority has a right to speak on any given subject.
Just because one doesn’t have a lot of fancy letters after their name, is not evidence that they have no knowledge on a subject.
That you have to resort to such crass evasions just speaks to how little you know, and how desperate you are to change the subject.
Oh you have a right to speak. And i have a right to dismiss your ramblings and trust actual scientists in the field.
Poor gullible little beetroot !!
Your ignorance continues to shine through
Do you take your children to a janitor for medical care?
Climate “scientists”… most often aren’t.
Ad hominem’s are the last resort of the uneducated.
Insults are the first resort of the climate alarmists.
It’s not like they have any actual knowledge to share.
Are you referring to bnice2000?
Poor beetroot.. you really are clueless.
You were the one with the first ad homs.
Now stop whimpering !!
Are you really SO DUMB that you think you can do feed-back calculations based on an arbitrary zero point.. !!
WOW !!
Your level of maths and science really is basically ZERO isn’t it. !!
LORD Monckton just happened to be TOTALLY CORRECT..
He knows a LOT more about maths, science… basically everything… than you will ever have the capacity to learn.
Your comment about ‘zero point’ is as much gobbledygook as Monckton’s comments. The only difference is that you’re not a Lord (or a phony Lord)
Thanks for admitting your cluelessness about the subject of feedbacks.
Go ask your doberman.. it probably knows more than you do.
LORD Monckton is totally entitled to call himself a LORD under UK heritage laws.
Seems your ignorance is very far-reaching.
And yet the House of Lords says he is not. Yet you ignorantly support him.. Why might that be? Could you possibly be blind to evidence ?
You are an ignorant troll trying to equate being in or not in the house of lords to the knowledge someone might have. Lay off the weed, you are losing your mind!
so You are proud to believe a liar and hypocrite even though he has no education in science?
Troll remark.
“to believe a liar and hypocrite “
No, we DON’T believe you.
We already know you are a gormless , scientifically illiterate moron..
Why would anyone take any credence in anything you say ??
LORD Monckton has several magnitudes more understanding of science, maths, climate…. than you will ever be capable of.
You are destined to remain a hopeless ignorant trollette…
… because that is your aim in life.
Do you have any evidence of that, or is it just what you have been told to believe.
Beetroot’s knowledge of science is so minimal that he will “believe” any crap his AGW cult-leaders tell him.
He doesn’t even know he screwed the pooch by admitting the area at the edge of the flat disk receives zero radiation. That kinda messes up the average don’t ya know.
Still struggling with the concept of the projected area of a sphere, are we?
Still a member of the flat Earth society ??
Cannot even visualise that the Earth is actually a 3D object…
Heck.. even kindy students know that !!.
“At its current concentration atmospheric CO2 at 420 ppmv … its Global warming potential is almost entirely exhausted.”
Rather, its capacity to increase the kinetic energy of atmospheric gases is almost entirely exhausted.
There’s no evidence whatever that our CO₂ emissions have caused any increase in atmospheric sensible heat — at all.
“Rather, its capacity to increase the kinetic energy of atmospheric gases is almost entirely exhausted.”
Agreed. This is important.
I made a very short video using the “vertical integral of energy conversion” values (computed estimates) from the ERA5 reanalysis to make the additional point that the static radiative “warming” effect of incremental non-condensing GHGs vanishes as [internal energy + potential energy] <-> [kinetic energy] proceeds rapidly in both directions. I put a more complete explanation in the description box on Youtube, making reference to the fundamentals that Lorenz described.
. https://youtu.be/hDurP-4gVrY
“There’s no evidence whatever that our CO₂ emissions have caused any increase in atmospheric sensible heat — at all.”
Thank you, Pat.
You might also like this new study… showing no isotopic evidence of fossil fuel CO2.
The Conclusion Humans Drive Atmospheric CO2 Increases Is Undermined By Carbon Isotope Data (notrickszone.com)
Uh oh!
Yep.. this will be fun.. won’t it ! 😉
That’s the same fallacious argument advanced by Angstrom in the 19th century and debunked by the Swedish scientist Arrhenius in 1896, and by a succession of scientists since then. The explanation: https://www.realclimate.org/index.php/archives/2007/06/a-saturated-gassy-argument/
More junk propaganda gibberish from a paid alarmist shill.
Pierrehumbert is one of the most clueless climate hacks in the world.
Basically everything he has ever said is provably wrong.
And of course you Are right! Everyone is just as gullible as you are!
Yes, I am right.
Once you get an education past primary level, you may realise that.
Be a long, long time… !!
“There’s no evidence whatsoever” .Good grief. .But If you dont read science, I can understand why you’re not aware.
You could produce the scientific evidence then. ??
Or FAIL utterly and completely. We are waiting..
But first you will need to figure out what “science” is.. because are apparently clueless in that regard.
Pat is FAR more “aware” of the sorry state of so-called “climate science” than you will ever be.
You are an ignorant troll.
You’ll have to explain that to the scientist that penned the analysis
No-one need to explain that you are an ignorant troll.
It dips from every comment you make.
I read science, Warren. But suppose you supply the evidence. What is it?
Beetroot cannot provide scientific evidence.
It is totally ignorant of what “scientific evidence” even means.
‘Nuff said: https://andthentheresphysics.wordpress.com/2019/09/08/propagation-of-nonsense/
Ken Rice #1
Ken Rice #2
Ken’s attempted refutation was one of the most incompetent of my receipt. He showed no understanding of’ calibration, and propagation of error is clearly foreign to him.
Both are standard practice in the physical sciences.
You’re just arguing from authority Warren. You don’t understand any of it.
These folks just have a problem with magnitude of a measurement and the uncertainty surrounding a magnitude. You can develop a new magnitude with new assumptions but the uncertainty interval remains the same.
Happer’s fallacious argument is similar to the mistake made by Angstrom in the19th century ,long since debunked by Arrhenius and a succession of scientists thereafter. An easy read:
https://www.realclimate.org/index.php/archives/2007/06/a-saturated-gassy-argument/
Junk science from a junk-scientist.
Pierrehumbert is one of the most idiotic and clueless propagandist in the world.
Basically everything he has ever said is provably wrong.
IIRC , he is the one that pulled the 2C meme out of his nether regions… just a made-up fake number.
Apparently not easy enough for bnice2000. Would you like crayons and a coloring book?
Poor beetroot.. still ZERO SCIENCE.
What a pathetic little trollette you are.
Primary level science would be too difficult for your feeble mentality.
“Happer’s fallacious argument…”
Which argument is that, Warren? Lay it out for us.
And then explain where the physics is wrong.
Your ignorant partisanship is leading you into villainy, Warren, gratuitously attacking the competence of a great scientist.
You have no idea of the right or wrong of it. Under that circumstance, ethical integrity requires that you keep silent.
Troll the arguments as you like. But leave the slanderous dismissals out of it.
Happer is a partisan politician who plays fast and loose with the science. His nonsense about saturation was debunked in the link I provided, written by Dr Raymond Pierrehumbert.
So you don’t know. You’re merely not above partisan slander.
Your linked article doesn’t mention Will Happer. You’re just inventing stuff.
Try reading the papers. Happer says the greenhouse effect is saturated. Pierrehumbert explains what thats a fallacious argument.
Where / when did Happer ever say that the greenhouse effect is saturated? Creating and then arguing against a false representation of your opponent’s actual argument is a logical fallacy commonly referred to as a ‘straw man’. Presumably, this is your, not Pierrehumbert’s, preferred method of debate, but I’m willing to stand corrected.
Did you read Harper’s “paper”?
His very first conclusion:
“from the current CO2 level at 420 ppmv CO2 warming potential is >85% saturated”
‘>85% saturated’ is not the same as ‘saturated’. If you can’t grasp that, I can’t help you.
Also, who’s ‘Harper’? And can you provide a link to the 85% quotation.
Read the darn paper that’s the entire point of this thread. It’s the very first conclusion — which makes the point thatc85% saturation is the reason that adding more co2 doesn’t raise temperatures.
What paper? By Whom? The 85% reference comes from the head article written by Ed Hoskins. Where’s the link back to a paper by ‘Harper’? Or is it ‘Happer’?
from Hoskins article, Happer says:
“The important point here is the red line on this chart. It shows what would happen if the concentration of CO2 was doubled. The gap between the black line and the red line shows the extent of the effect of doubling CO2. So, you can see that doubling CO2 now makes virtually no difference”
Then Hoskins concludes “from the current CO2 level at 420 ppmv CO2 warming potential is >85% saturated,“
So, to this point you have:
You missed the entire forest for the trees. Here’s what Happer said (direct quote from Hoskins article):
“The important point here is the red line on this chart. It shows what would happen if the concentration of CO2 was doubled. The gap between the black line and the red line shows the extent of the effect of doubling CO2. So, you can see that doubling CO2 now makes virtually no difference.”
A fraudulent conclusion when the CS mean value from scientific research is ~ 3C.
So, we both agree with Happer’s 3 W/m^2 change when moving from 400 to 800 ppm. How does 3 W/m^2 cause a 3C change in temperature? Hopefully, you’re not pulling this result from a model, because you’ve said on several occasions that the evidence of climate change doesn’t rely on models.
I have the van Wijngaarden and Happer arXiv pre-print
Here’s what they wrote about CO₂ band saturation.
“Fig. 9 as well as Tables 2 and 4 show that at current concentrations, the forcings from all greenhouse gases are saturated. The saturations of the abundant greenhouse gases H₂O and CO₂ are so extreme that the per-molecule forcing is attenuated by four orders of magnitude with respect to the optically thin values.” (my bold)
The extreme attenuation is something neither Spencer Weart nor Ray Pierrehumbert mentioned.
Continuing: “Doubling the CO₂ concentration will cause a temperature decrease of the upper atmosphere of about 10 K as shown in Fig. 11 to restore hypothetical radiative-convective equilibrium. For the case of fixed absolute humidity, the surface warms by 1.4 K which agrees
very well with other work as shown in Table 5. The surface warming increases significantly for the case of water feedback assuming fixed relative humidity. Our result of 2.3 K is within 0.1 K of values obtained by two other groups...” (my bold)
In other words, van Wijngaarden and Happer get the same results as others.
Let’s see: by your standard of judgment, Warren, that fact makes your argument about Happer fraudulent.
You continually make accusations and slanderous declarations without doing the work yourself. In ignorance. The mere word of your partisan sources is enough for you. Where’s the integrity in that?
Saturation doesn’t occur. Pierrehumbert explained why in his article. sorry you don’t get it
Saturation is when all the radiation being emitted is captured. Saturation must occur at some concentration and wavelengths. The only reason it doesn’t happen completely is that the wings expand slightly to capture a little more radiation. This widening is not linear, but reduces as the concentration gets larger, therefore the effects diminish a lot.
Each doubling of CO2 increases global temperatures by the value of CS, and the idea that at our current CO2 concentration of ~420ppm, or even at much higher ppm, the greenhouse effect becomes ‘saturated’, has long been debunked by scientists, including Dr Pierrehumbert.
You don’t even know the correct definition of saturation.
You’re in no position to judge the argument. Pierrehumbert is your priest and in Warren-World it’s god’s lips to his ear. In your case, ignorance is confidence.
Have you yet earned a Professorship at Oxford, or any major University? Published in reputable peer reviewed scientific journals? Figured out how temperature anomalies work?
Finally, has the world recognized your genius in overturning 130 years of climate research with your amazing claim that ‘there is no discernible global warming occurring’?
🤡Another argumentative fallacy of Appeal to Authority. Lift the needle from the record dude you are stuck in a single groove!
I can understand why someone without accomplishments thinks accomplishments don’t matter. Are you any good with a harmonica?
🤡🤡🤡🤡🤡Five clown show. Keep up the great remarks!
Are you qualified to have an opinion worth knowing? If so, by what standard?
I have dozens of peer-reviewed publications, Warren. How many do you have?
“your amazing claim that ‘there is no discernible global warming occurring”
Where did I claim that? Present the quote.
Pat Frank says “I have dozens of peer reviewed publications”.
hmmm. The only discussion of your ‘peer reviewed papers’ I could find is here: https://skepticalscience.com/frank_propagation_uncertainty.html
Here is an excerpt: “Pat Frank had been trying to get something published for many years, and had been rejected by 13 different journals. I won’t link to either of these earlier papers here,, but a few blog posts exist that point out the many serious errors in his analysis – often posted long before those earlier papers were published. If you start at this post from And Then There’s Physics, titled “Propagation of Nonsense”, you can find a chain to several earlier posts that describe the numerous errors in Patrick Frank’s earlier work.
Spoiler alert: Patrick Frank can’t do basic first-year statistics.
Already falsified SkS on this site here and here.
You have advanced from ignorance to lying, Warren. Well done.
“hmmm. The only discussion of your ‘peer reviewed papers’ I could find is here:” (my bold)
Google Scholar on “Patrick Frank chemistry.”
You’re either fatally lazy, or prefer the lie.
‘The only discussion of your ‘peer reviewed papers on Climate’. You have more (on Climate)? After your 13 rejections?
🤡🤡🤡🤡🤡🤡🤡🤡🤡🤡🤡🤡🤡!
Thirteen clown statements!
You’ve dishonestly shifted your ground.
In any case Propagation… has more than 150,000 views and 10,000 downloads.
MDPI does not post statistics of views and downloads, but about LiG Met, Altimetric has this to say: “Altmetric has tracked 25,547,324 research outputs across all sources so far. Compared to these this one has done particularly well and is in the 99th percentile: it’s in the top 5% of all research outputs ever tracked by Altmetric.”
Only you would think those records include no discussion.
This earns 2 more clowns for stupid statements. You can’t even do a proper search of published papers. What a failure!
🤡🤡🤡🤡🤡🤡🤡🤡🤡🤡🤡. Eleven clown statements!
At this rate, you must be shooting for at least 20! Is that a PREDICTION? Yes it is!
How do you, personally, know Pierrehumbert is correct, rather than Happer?
You don’t.
You’re like a Baptist adherent, who just knows the Presbyterian minister is wrong.
You’ve no idea of the case. You just have your preferred cleric.
How do you know Happer is correct?
Because I understand his argument.
Pierrehumbert didn’t discuss the ∆A/A (A = absorbance) following CO₂ doubling, as Happer did.
Also Pierrehumbert’s example of CO₂ in a tube is wrong because it does not correctly represent the attenuating absorbance cross section of declining gas density.
Have you published your results in a peer reviewed scientific journal?
You just can’t wean yourself from argumentative fallacies like Appeal to Authority can you?
Your “critique” contains nothing of substance. Keep up the ignorant posts, you make us laugh!🤡
So the answer is “No”. Why am I not surprised?
Well, a major reason is because you’ve no idea what you’re talking about.
You’ve offered nothing except argument from authority, prejudiced dismissals, professional slanders, and heated bluster. Bottom of the barrel stuff.
A triviality. You brought up the blog as authoritative. It isn’t. Go your way believing it or not.
An explanation of the fallacious arguments made by Angstrom and Harper.
Which contains absolutely NOTHING that counters Happer’s FAR GREATER KNOWLEDGE of everything to do with atmospheric physics.
Rife with baseless opinion anti-science.
Just the sort of thing a gormless AGW-beetroot would fall for.
My goodness. Did you even read either paper?
Note that the geniuses on this forum are now arguing about the geometric formula for the projected surface area of a sphere, no less.
You just can’t win can you. Why don’t you just quit with your stupidity.
No one is arguing about the surface area. The argument is about finding an “average” insolation for each and every m² of the surface. That is just wrong science.
If a point in the tropics when the sun is at 90°, i.e., normal, receives 1000 W/m², then a point in the Arctic at the same longitude and 75° latitude will receive “1000 • cos(75) = ~260 W/m².
(1000 / 5.67×10⁻⁸)¹/⁴ = 364 = 91°C
(260 / 5.67×10⁻⁸)¹/⁴ = 260 = -13°C
Remember, this is an example. But, it does illustrate the difference in temperature between the tropics and the poles. You can mock this as being off topic but I’ll bet you can’t refute it.
Wrong science? No it’s the right science. It’s blindingly obvious that it gives the total sunlight incident on the earth. And so blindingly obvious that a freshman physics student knows how to do it, but you do not.
You have NO SCIENCE.
You are a scientific ILLTERATE. !!
“freshman physics student”
Don’t pretend you ever got that far !!
Funny how you can’t back up your so-called refutation with some actual math.
Maybe your freshman physics class was algebra based without a serious lab to go along with it.
Show some math that backs up your assertion!
Math? You seriously can’t comprehend that the projected surface area of a sphere (4 pi r^2) is pi r^2? Really?
Can you not recognize that a sphere is not flat circle. That means refection comes into play over the part of the sphere that is illuminated.
Read Sections 8 – 11 in Max Planck’s Theory of Heat Radiation. You may not believe me, but you’ll have a hard time refuting a physicist of his stature.
Regardless of how much light is reflected, the amount of light INCIDENT is a purely geometric consideration.
You just keep refuting how smart you are.
Incident has nothing to do with how much is absorbed with consequent heating.
I gave you a reference from Max Planck. Perhaps you should study it and show, with math, how his conclusions are incorrect.
You keep confusing the amount of light incident with the amount of light absorbed. They are distinctly separate ideas.
The amount of light INCIDENT is a geometric calculation = pi r^2. The amount of the incident light REFLECTED or absorbed has to do with the properties of the body
You keep refuting your intelligence.
They are NOT distinctly separate ideas. They are very interrelated. Tell us how much absorption can be expected when an incident ray intersects a surface at an angle of 30°. Show your math!
Funny how you can’t refute Planck!
Please explain how the amount of light INCIDENT on a surface depends on what happens AFTER it hits the surface
Again, you are refuting your claim of intelligence.
Learn about “view factors” when dealing with energy radiation.
Here is a wiki page that gives a brief introduction. Please note the references to trig functions and differential computations. I doubt you will understand.
https://en.m.wikipedia.org/wiki/View_factor
Hold on. You haven’t answered my question:
“Please explain how the amount of light INCIDENT on a surface depends on what happens AFTER it hits the surface!”
So sad you are too ignorant to even understand that I have given you two answers.
You’re either stupid or playing word games. Either way, you’re a useless waste of time. Did you ever graduate from high school?
Ad Hominems – the last resort of a loser in an argument. Congratulations to you, you lose!
You would try the patience of Job
And Job would eschew you.
Gorman:
3 posts up. Quoting you ….
”So sad you are too ignorant to even understand that I have given you two answers.”
That therefore (in your own words ) demonstrates you using “the last resort of a loser” as being the “loser”.
Well done. You are correct and a hypocrite.
Ignorance is not an ad hominem. It is a description of the lack of learning. It is an observation of fact.
Merriam-Webster
ignorance
: the state or fact of being ignorant : lack of knowledge, education, or awareness
These alarmists use the “ad hominem” claim to discredit actual nonsense. “You’ve insulted me because i don’t know shite!” Good job Mr. Gorman!
Thanks!
Useless? You wish! You’re talking to college graduates. The stupidity abounds–with your comments!
Apparently they are either political science majors, sociologists, or massage therapists.
Answer this question dude.
———-
———
Your continued refusal to answer only leads to the conclusion that you are embarrassed to state it. Until you answer, your criticisms of others is meaningless.
“Apparently they are either political science majors, sociologists, or massage therapists.”
Finally this troll realizes that actual science knowledge is important–something it doesn’t know or has a clue!
Thank-you WUWT for reinstating the edit function. It is greatly appreciated!
A friend questioned, commented: “this would only have some relevance if cold bodies or gases have ever warmed hot bodies.
the graph shows, that infrared light is blocked by a gas molecule, but this means only that this molecule heats up, therefore needs more space and rises a little bit. the energy is transferred to potential energy in the rising air parcel – no heat whatsoever returns to the ground.
the measuring process of back radiation pointing to the sky is dependent on a cooled receiver, if it is not only guessing what is made.”
Anyone want to help me on this?
When a greenhouse gas molecule absorbs a photon of infrared frequency radiation, the molecules KINETIC , not potential, energy increases by virtue of increased rapid movement, not elevation change. So the ghg molecules are warmed, then transfer heat to adjacent molecules or re-emit the photon downwards (actually in any direction, but some return to earth.) So both air AND earth are warmed as the ghg molecules absorb infrared energy attempting to leave earth.
Maybe you can explain how “back radiation” raises the temperature of the earth from say 50°F to 51°F.
You might want to read Max Planck’s Theory of Heat Radiation to find out what he calls “compensation” prevents that from occurring.
Your explanation is one that is derived from averages and just simply doesn’t work physically.
You seem to have trouble with so many basic principles of physics, that I’m attaching a link to Professor Pierrehumbert’s ‘Principles of Planetary Climate’ for you to read. You’ll find a discussion of back radiation and the greenhouse effect in the early pages of the book. https://a.co/d/ftASUDz
Another stupid statement. You didn’t read anything in Planck thesis did you?
When you can refute Planck with pertinent information from your favorite author post it here. Otherwise you have no ability to know what you are talking about.
BTW, 🤡🤡🤡🤡🤡🤡🤡🤡🤡🤡🤡🤡. 12 clown statements. You are moving to twenty at an ever increasing rate!
Have you tried shining Dr Pierrehumbert’s shoes?
When a CO2 molecule absorbs an IR photon its vibrational energy is increased from the ground state to the first excited state. The molecule then vibrates at a characteristic frequency, the energy can be lost by two means, another photon can be emitted or by collisions with surrounding molecules. Low in the Earth’s atmosphere collisions with N2 and O2 molecules take place about 10 times per nanosecond, the mean emission time is orders of magnitude longer so most of the energy is transferred to the surrounding molecules by collisions. Thus the kinetic energy of the non-radiating N2 and O2 molecules is increased and the temperature increases.
“and the temperature increases.”
Unless a change in cloud fraction compensates the energy.
What does cloud fraction have to do with the mechanism of energy transfer between excited CO2 molecules and the atmosphere?
Get a clue. Clouds reflect insolation so it doesn’t reach the surface.
Your comment is a Diversion from Phil’s explanation of the mechanism of heat transfer. And its likely you know what you’re doing, because you deny the greenhouse effect even exists.
Show where I’ve said the Greenhouse effect doesn’t exist. You are making stuff up and an honest person would apologize!
You deny that back radiation exists. Thats part and parcel of the GH effect.
Now you are into straight out lying. I have never said that and you should apologize for saying I did.
I have said that radiation from CO2 can not warm the surface. If you believe differently, provide the references that shows back radiation reversing the cooling gradient of the surface.
You do realize the SB equation that has (T2 – T1) would require T1 (CO2) to become larger than T2 (surface), right?
Yes I should have said “Gorman denies that back radiation warms the earth” . Which is equally gobsmacking stupid. You seem to have no concept of how a net reduction in IR attempting to leave earth results in an energy imbalance for earths system, and leads to a net warming by incoming solar. I suppose the first Law is beyond your kin.
Anyone with a smattering of thermodynamics training will recognize your comment as fallacious.
You are claiming that the earth and its atmosphere refutes the 2nd law of thermodynamics. That is, a cold body can heat a warmer body. Good luck with that.
Show a reference with the mathematics that describe how that works. I have already posted a quote from Planck that refutes your assertion.
This statement perfectly describes the sun-earth-atmosphere three body system.
You get another clown for,
🤡🤡🤡🤡🤡🤡🤡🤡🤡🤡🤡🤡🤡🤡🤡🤡🤡🤡🤡🤡🤡
Twenty-one clowns. Keep up the good work!
Well your flawed understanding of the S-B doesn’t matter here because that’s not how radiation by excited CO2 molecules works. When a CO2 molecule absorbs an IR photon its vibrational energy is increased when it re-emits a photon that photon can head in any direction, if it heads towards the surface that energy will be absorbed by the surface, it has nothing to do with the temperature of the CO2 molecule.
SB IS how it works! Emission and absorption are two different process. They do not interact directly with each other.
Assume B1 is the hot body and B2 is the cool body. Further, assume that B1is at temperature that radiates at 100 W/m² and B2 is at a temperature that radiates at 50 W/m².
B1 radiates at 100 regardless of B2 being there or not. Irradiance is solely determined by the temperature the body is at and not by the bodies surrounding it. The same for B2.
Now let’s look at B2. It absorbs 100 from B1. Since it is only radiating 50, it can not compensate the total absorption. Therefore it warms by a net 50.
Then let’s look at B1. It absorbs 50 from B2, but it is radiating 100 so B1 simultaneously compensates the absorption by emitting what it absorbed (50). However, that means it can only cool by an effective 50.
This is what the SB two body equation is designed to determine, the net radiation from hot to cold.
It should be noted that the above and the SB equation is only useful to describe an infinely small period in time, that is a single moment. Heat transfer is a continuous process and requires gradients to be defined. The gradients will include items like mass, specific heat, etc. to describe the time related changes and can be integrated to find results.
This is all covered in Planck’s Theory of Heat Radiation.
The end result is that CO2 can not reverse the heat flow from the surface to the atmosphere. The best it can do is modify the cooling gradient of the surface.
SB describes how black body radiators interact it has nothing to do with the emission of excited molecules.
CO2 absorbs an IR photon emitted from the surface and becomes vibrationally excited, it will then have to loose that excess energy. It will either do that by collisions with surrounding molecules (predominantly N2 and O2) or it will reemit the photon. If emitted towards the surface the photon will be absorbed and the energy transmitted back to the surface. Energy which would otherwise leave the planet for outer space is prevented from doing so by the presence of CO2 thus the planet warms up until a compensating amount of energy leaves for space.
Give me a hint, where do all the radiation numbers come from if not based on temperatures and Stefan’s equation E = σT4? What are are the Planck curves on emission frequencies based on?
Quit cherry picking little entries from CAGW web sites.
See the smooth curves on this graph, they’re the ones ‘based on temperatures’, see that big notch labelled CO2, that shows the loss of radiation due to the process I described.
I’m not the one ‘cherry picking’.
You have no clue. That notch you see is where “back radiation” originates. When the surface reradiates absorbed energy, it does so based on the entire Planck curve which means a large amount of the “back radiation” leaves through other frequencies than those absorbed by CO2. Therefore little radiation is trapped.
And to increase the radiation at those other frequencies the surface temperature increases! It’s known as the greenhouse effect.
And once again, you are implying that “back radiation” is added to what the surface has which would result in a higher temperature of the surface.
This is a direct refutation of the Stefan-Boltznann two body equation.
Again, I will point out that the temperature term is:
(T2⁴ – T1⁴).
The net radiation, or net energy flow, is determined by SUBTRACTING the cold body’s radiation from the warm body’s radiation. THEY ARE NOT ADDED. Addition of the two at the warm body is required to achieve a temperature increase in the warm body.
This is a quote from Planck’s Theory of Heat Radiation.
Read this carefully and see if you can reconcile your need for the warm body to increase its temperature while also cooling.
What you saying is BS not SB, as I’ve said before SB does not apply to the emission from excited molecules!
Stefan-Boltzmann refers to thermal emission by a blackbody (also greybody), it has nothing to do with the emission by vibrationally excited molecules. One mole of excited CO2 contains ~8kJ of excess energy more than the unexcited molecules, the direction that energy is emitted in depends entirely on the internal dynamics of the molecule and has nothing to do with the temperature of the body it will eventually hit. Given randomly emitted photons about half will be emitted downwards towards the surface.
Look at the temperatures shown on the radiance chart you posted. Do you think those were calculated using Stefan’s equation or your “~8kJ of excess energy” per mole?
BTW, Stefan’s equation does allow the use of an emissions/absorption factor “ε” to account for non-black body.
From NASA:
https://tfaws.nasa.gov/TFAWS12/Proceedings/Form%20Factors%20Grey%20Bodies%20and%20Radks%20Course.pdf
Look at this page and see how they calculate temperatures. I assure you they do not use “~8kJ of excess energy”.
https://www.e-education.psu.edu/meteo300/node/647
Why do you refuse to ever post any REFERENCES for your assertions? You are not an expert that has a reputation of being correct. If you continue with unsupported assertions I am just going to give you clowns.
“Look at the temperatures shown on the radiance chart you posted. Do you think those were calculated using Stefan’s equation or your “~8kJ of excess energy” per mole?”
Of course not, they are the predicted thermal radiation emitted by a black body. The ~8kJ of excess energy” per mole is the excess energy carried by excited CO2 following excitation by IR (15 micron).
The ‘notch’ in the curve indicates the amount of energy absorbed by CO2 molecules in the atmosphere (~33W./m^2 according to Will in the headpost). That energy is temporarily stored in the CO2 molecules to the tune of ~8kJ per mole. However those molecules are unstable and have to loose that energy, one way that happens is to re-emit a photon which if it reaches the surface will be absorbed and heat up the surface. How you would apply S-B to an excited CO2 is a mystery, what temperature would you use?
I do provide references, for example the links regarding the insolation at the pole above. This subject is routinely covered in freshman physical chemistry classes, my favorite text was W.J. Moore, ‘Physical Chemistry’.
You do realize that the SB equation allows the use of “ε” as a modifier to adjust for emission/absorption difference from a black body right?
It is sometimes called albedo.
Yes, I referred to grey bodies above, it still has absolutely nothing to do with molecular emission.
It’s not referred to as albedo, wrt Earth that is the fraction of sunlight that is reflected, “ε” is used in the Boltzmann equation to account for an imperfect emitter, they’re not the same thing.
Thatis true true as far as it goes. However albedo also is a factor in how much is available to be absorbed.
Planck shows that there can not be emissions without absorption.
Planck also refers to Kirchoff numerous times where absorption and emission are equal.
“Given randomly emitted photons about half will be emitted downwards towards the surface.”
In the troposphere, CO₂ relaxes collisionally. Effectively no IR photons are emitted
A point I made thus heating the atmosphere, those that do emit do as I said.
No one knows how the climate responds to that kinetic energy.
Assuming the K.E. appears as sensible heat is a recrudescence of the assumption that nothing else changes.
All of AGW lives and breathes on that assumption. And it’s wrong.
Every object in existence emits energy in all directions and this energy flows into all surrounding objects regardless of their relative temperatures. Since the amount of energy released by objects increases with the amount of energy they contain this inherently means that NET energy flows always run from ‘hot’ to ‘cold’. Your belief that this means energy can ONLY flow from ‘hot’ to ‘cold’ is simply nonsense, and rejected as such by all but the outermost looney fringe of modern physics. Energy enters the Earth’s climate from the Sun. Greenhouse gases delay the escape of this energy from the atmosphere just as insulation on a house delays the escape of heat generated by a furnace. This delay in energy escape means that the steady incoming energy from the Sun/furnace is supplemented by retained energy which has not escaped yet due to the greenhouse gases/insulation. Thus, the Earth/house is warmer with the greenhouse gases/insulation than without. Really. Insulation on your home DOES actually exist. It DOES allow your house to be warmed to higher temperature than it could without the insulation. This is reality… not a violation of the second law of thermodynamics. You have experienced it actually happening… so why cling to a misinterpretation of physics which says it CANNOT happen?
Your ability to create strawman arguments is beyond compare.
You have just made a rebuttal that appears to refute Stefan-Boltzmann equation. Good luck with that. NET energy only flows from hot to cold. Please show references that refute that.
By the way, you are also confusing energy, heat, and temperature. Think about this. Does H2O absorbing energy raise its temperature? Has heat been transfered when H2O absorbs energy?
In the future, to prevent straw man arguments, INCLUDE AN EXACT COPY OF WHAT I POST that you have a problem with. Otherwise you will only get a clown response!
“You have just made a rebuttal that appears to refute Stefan-Boltzmann equation.”
That’s because you don’t understand SB, as you’ve repeatedly shown
“when it re-emits a photon that photon can head in any direction,”
Vibrationally excited CO2 in the troposphere relaxes almost exclusively by collision with O2 and N2. It doesn’t relax by emission.
So according to Frank who I replied to when CO2 absorbs IR from the surface and transfers that energy to the atmosphere extra clouds are formed to reduce insolation to ‘compensate’ for the extra energy transferred! You believe that?
Neither Dr. Frank not I have implied any such thing. You are creating a strawman that you can knock down. That isn’t how you win an argument.
Water vapor is predominately created by the sun, not back radiation from CO2.
Your description makes no sense. If CO2 were to collide with an H2O molecule precipation would not occur. Clouds are formed when H2O radiates and the water molecule goes from water vapor to liquid form. Similarly, if a water vapor molecule absorbs radiation from CO2, it is less likely to precipitate.
“Neither Dr. Frank not I have implied any such thing. You are creating a strawman that you can knock down. That isn’t how you win an argument.”
Actually Frank said: “Unless a change in cloud fraction compensates the energy.”
In response to “Thus the kinetic energy of the non-radiating N2 and O2 molecules is increased and the temperature increases.”
Would you point out how that says:
Again, you are building a strawman. Have fun with that!
As I said the CO2 recycles the energy emitted by the surface in the form of IR radiation and heats up the lower atmosphere. Frank suggested that could be ‘compensated’ for by a change in cloud fraction, how? I notice that Frank has not attempted to elucidate his comment in the last couple of days since he made it.
So solar radiation that has already reached the surface is somehow ‘compensated’ for by a change in cloud fraction?
Again you are building strawman arguments.
Clouds change insolation both up and down. It is not unreasonable to project that warmer temps will cause more water vapor and therefore more clouds. You need to quantify you strawman with some numbers if you want an objective answer. Until then all you are doing is saying “My hypothesis is better than yours because I am smarter and therefore know more than you!”. That is an argumentative fallacy that you can never win with.
I gave a detailed scientific explanation of a process, the response I got was “Unless a change in cloud fraction compensates the energy.”
That’s the unquantified argument, not mine.
Your straw man was this:
This comment;
neither says what your straw man says, nor implies it. That is solely your invention.
Actually it says nothing, it’s just hand-waving.
If that is true, then you should have no problem arriving at an argument that proves it wrong!
I did!
Do you really think this:
is contained in this:
Your statement is a strawman! It is a qualification that was not included in the original statement!
“it’s just hand-waving.”
It’s a widely-known fact. Just not by you.
Clouds reflect back about 1100 W/m² of the solar 1360 W/m² that impinge cloud tops.
Total CO₂ forcing since 1900 is ~2W/m². Compensation just requires that cloud response reflect back 1102 W/m²; a fractional increase of 2/1100 = 0.18%.
Average annual increase in forcing from CO₂ emissions is ~0.035 W/m². Annual compensation by cloud response to remove any change in sensible heat is 0.035/1100 = 3.2E-3%.
That’s what you’re waxed about, Phil. You and Warren.
Does cloud response happen that way? No one knows. The physical theory isn’t in hand. The measurements can’t detect such small changes in cloud cover.
Meanwhile, there’s absolutely nothing unusual happening with the climate. The only known effect of our CO₂ emissions has been to green up the whole world. And improve agricultural yields by about 15%.
But somehow you and Warren (and your ilk) are blind to these facts in obvious evidence.
And mindless nutters like John Kerry and the rest want to wreck the lives of everyone over it. The whole AGW thing is mass insanity.
“Frank has not attempted to elucidate his comment in the last couple of days since he made it.”
Because the cost/benefit of commentary here has gone above unity.
Albedo of low clouds reflect back incoming solar radiation. Which is why only ~247 W/m² reaches the surface, of the 1360 W/m² that impinges Earth. This causes cooling. High clouds, however, reflect exiting IR back toward the surface. They cause warming.
Clouds pretty much control radiant energy flux in the troposphere.
You go off on me because I posted things you don’t understand. You then decide I must be wrong. It’s a very old story here, it’s utterly banal, and I’m tired of it.
“So solar radiation that has already reached the surface is somehow ‘compensated’ for by a change in cloud fraction?”
Incoming solar, and outgoing IR, both.
Study up, Phil. Clouds control the climate and radiation physics is not a climate theory.
The problem is Pat that I was explaining how a single vibrationally excited CO2 molecule could transfer it’s energy to the surrounding atmosphere. You had a knee-jerk reaction to the phrase “Thus the kinetic energy of the non-radiating N2 and O2 molecules is increased and the temperature increases” and came up with vague irrelevant comment “Unless a change in cloud fraction compensates the energy.”
Calm down.
Cloud cover is central. That you don’t understand its importance in regulating sensible heat in the troposphere is the crux of your scientific irrationalism.
You wax wroth about CO₂ and then suggest I calm down? Irony alert.
“Actually Frank said: “Unless a change in cloud fraction compensates the energy.”
“In response to “Thus the kinetic energy of the non-radiating N2 and O2 molecules is increased and the temperature increases.””
Yeah, so? I made a conditional statement. Where’s the positive claim you assigned to me?
“So according to Frank…”
I made no such positive claim, Phil.
My point is and has always been that no one knows how cloud cover/cloud fraction responds. That was also Fritz Möller’s point in 1963 and it remains true today.
But that’s hardly relevant to my post describing how energy is transferred to the atmosphere from a vibrationally excited CO2 molecule is it. I was describing the microscopic process and you posted a vague remark about the macroscopic process.
Look at the temperature CO2 radiates at. Somewhere in the vicinity of -53 to -33. Those temps are pretty high in the atmosphere. That means molecules at a higher temperature (lower atmosphere) lose energy via collisions and only radiate when atmospheric density is low enough to allow radiation to predominate.
You also keep talking about electrons. Molecules have vibration of each atom in the molecule, not vibration of excited electrons. Electrons are not excited in the vibration of individual atoms in a molecule like CO2, nor do electrons fall back to a lower orbital when molecule vibrations cause emission.
See this for electron excitation.
https://energywavetheory.com/photons/photon-interactions/
“You also keep talking about electrons. Molecules have vibration of each atom in the molecule, not vibration of excited electrons.”
Not true I never mentioned electrons, I specically referred to ‘vibrationally excited CO2 molecules’.
Also where do you get the idea that there’s a particular range of temperature where CO2 radiates?
Look at the range of temps shown on the radiation chart you posted. The peak in the center is about -33°C and the wings are at something like -53°C.
Your questions are rather ignorant. Why would you think CO2 wouldn’t radiate at the temperature it is at. Do you think H2O doesn’t radiate at a cold temperature when it precipitates? You need to do some real studying instead of cherry picking things. You post a chart and don’t even know what is displays.
“Look at the range of temps shown on the radiation chart you posted. The peak in the center is about -33°C and the wings are at something like -53°C.”
That’s the problem, you don’t understand what you’re looking at. The temperature curves are the black body emission curves, nothing to do with CO2 emission. What the graph shows is that the black body emission that reaches space is missing some of the emission which has been absorbed by CO2. One simplistic interpretation on the curve is that the IR escapes at an altitude where the temperature is below ~220K. (near the tropopause) Look at the similar graph due to Will in the OP, the green curve shows what would be radiated to space in the absence of CO2, the ‘notch’ when 400ppm of CO2 is present shows what has been absorbed by CO2.
“ Why would you think CO2 wouldn’t radiate at the temperature it is at.”
I know it doesn’t because CO2 is at normally at it’s ground state and so has no excess energy to radiate away, when it’s rotational/vibrational state is excited by absorbing an IR photon it is now able to emit a photon. The CO2 molecule is not a black/grey body!
When I post a chart I certainly do understand what it means, unfortunately you did not.
I tire of educating you. The Planck curves show what a black body would radiate if an object was at that temperature. It IS BASED on a given temperature of a body. At a given temperature the MAXIMUM value of a Planck curve IS the temperature of the radiating body. The fact that it only emits at a certain frequency doesn’t change the fact that the Planck curve is maximum at that frequency and temperature combination.
Read this site:
https://profhorn.aos.wisc.edu/wxwise/AckermanKnox/chap2/planck_curve.html
Notice the formula:
λₘₐₓ = 2897 / T
That says the frequency of maximum temperature occurs at a given temperature. In other words the maximum point of Planck curve. That makes it reasonable to read the temperature of a radiating body at the point where the Planck curves is maximum.
This thread is done.
“I tire of educating you.”
You should first educate yourself, your postings in this thread indicate your lack of knowledge of the subject.
“The Planck curves show what a black body would radiate if an object was at that temperature. It IS BASED on a given temperature of a body. At a given temperature the MAXIMUM value of a Planck curve IS the temperature of the radiating body.”
That applies to a black body not to a molecule in a vibrationally excited state!
A CO2 molecule will emit the same wavelength after being excited by IR regardless of the temperature, it is not a black body. A CO2 molecule at the S Pole in winter will emit the same wavelength as one over the Sahara in summer, temperature has nothing to do with it.
Your “and the temperature increases.” is a macroscopic process. Get your ducks in line, Phil.
I said: “Low in the Earth’s atmosphere collisions with N2 and O2 molecules take place about 10 times per nanosecond, the mean emission time is orders of magnitude longer so most of the energy is transferred to the surrounding molecules by collisions. Thus the kinetic energy of the non-radiating N2 and O2 molecules is increased and the temperature increases.”
It’s about the energy transfer between individual molecules of CO2 and N2 and O2 molecules.
“It’s about the energy transfer between individual molecules of CO2 and N2 and O2 molecules”
But it’s not about, “and the temperature increases.”
You’re assuming radiation physics is a theory of the climate. It’s not.
No one knows how the climate responds to the increased K.E. Does the rate of evaporation/condensation increase? Does cloud cover change?
No one knows. You’re asserting as fact only one of several possible outcomes. There may be other outcomes of which we are not aware.
Because there is no falsifiable physical theory of the climate. Certainly not one able to resolve the consequences of such a minuscule perturbation.
You’re making a scientifically unjustifiable conclusory jump.
It’s standard physical reasoning. I fail to see why it is so difficult to grasp. If one has no valid physical theory, one doesn’t know physical causality.
All AGW climatologists seem blind to scientific reason;
““It’s about the energy transfer between individual molecules of CO2 and N2 and O2 molecules”
But it’s not about, “and the temperature increases.”
Of course it is unfortunately you apparently have an obsession about ‘temperature increase’.
In the process I described when an excited CO2 molecule exchanges energy with the neighboring molecules their temperature is necessarily increased (that’s what kinetic energy is). What happens to the climate subsequently involves many processes and was not what I was talking about. You even agreed with me that most of the energy absorbed by CO2 molecules in the troposphere is shared with the atmosphere by collisional deactivation so what’s your problem?
“so what’s your problem?”
Temperature is an extensive property. It’s macroscopic. K.E. is intensive and microscopic.
If increased K.E. increases the rates of evaporation and condensation, there may be no discernible increase in sensible heat.
You’re jumping to the conclusion that increased K.E. leads directly and exclusively to a macroscopic measurable increase in temperature.
However, it need not.
You’re presuming knowledge where there is none. That’s my problem.
That false claim of knowledge by the ignorant powers the whole AGW frenzy. Ignorance is the obvious and fatal flaw in their argument. And yours.
“You’re jumping to the conclusion that increased K.E. leads directly and exclusively to a macroscopic measurable increase in temperature.”
No I’m not, that’s your assumption, I’m describing the process that occurs more or less instantaneously.
“and the temperature increases.” is not an instantaneous process. Temperature is characteristic of a bulk.
Temperature follows equilibration of K.E. across the bulk gas. Your inference directly from molecular K.E. to properties of the bulk atmosphere is physically wrong.
The response channel of the atmosphere is not unitary. There are many possible responses to that K.E., other than temperature change. Likely more than we presently know.
Your claim has the unstated (by you) assumption that nothing else changes. it’s wrong.
By the way, you asked for some quantitation.
“What does cloud fraction...”
Cloud type and fraction control both the incoming and outgoing tropospheric energy flux. It wouldn’t take much change in cloud cover to obviate the effect of the increased atmospheric kinetic energy produced by CO2.
The point is that no one knows how clouds respond, and measurement resolution is too coarse to detect cloud cover at the necessary level of detail.
The process really isn’t controlled by work. Work is definitely performed as a molecule rises against gravity. However, as a molecule loses energy to work, gravity also exerts work to draw it back to earth. Without other processes interfering, the net result is essentially a net wash when it comes to work.
Planck explains the process of the interaction between a hot body and a cold body. He calls it compensation. One can not simply use averages to properly understand what occurs in this situation. One must be familiar with gradients since that is what occurs.
If a hot body is radiating at 300K to a cold body at 250K, energy is interchanged between the two. Since the hot body is radiating a much higher value because it is hotter, when it absorbs the energy from the cold body, the cooling gradient of the hot body is reduced. The hot body just keeps radiating at 300K, but the reservoir of energy is increased due to the reduced gradient.
Please note this doesn’t mean the gradient is reversed, it is just reduced. The only way for the gradient to be reversed is for the cold body to become the hot body. This can’t occur as thermodynamic equilibrium would be bypassed. What it does do is increase the time until equilibrium is reached.
This is why the Stefan-Boltzmann equation for two bodies has T1 = T2 at equilibrium with a NET result of zero radiation being exchanged. Using this equation when T1 ≠ T2 is only applicable for an infinitesimally small point in time. It does not tell you anything about the gradients of the two bodies. That requires integration of time based gradients.