Guest essay by Larry Hamlin
NOAA published its global climate report for year end 2021 highlighting that its global temperature anomaly measurements showed 2021 being the sixth highest of its recorded measurements. NOAA’s global annual measurement for 2021 was 0.84 degrees C.
NOAA chose to emphasize that the annual 2021 temperature anomaly was in the top ten of its recorded years as follows:
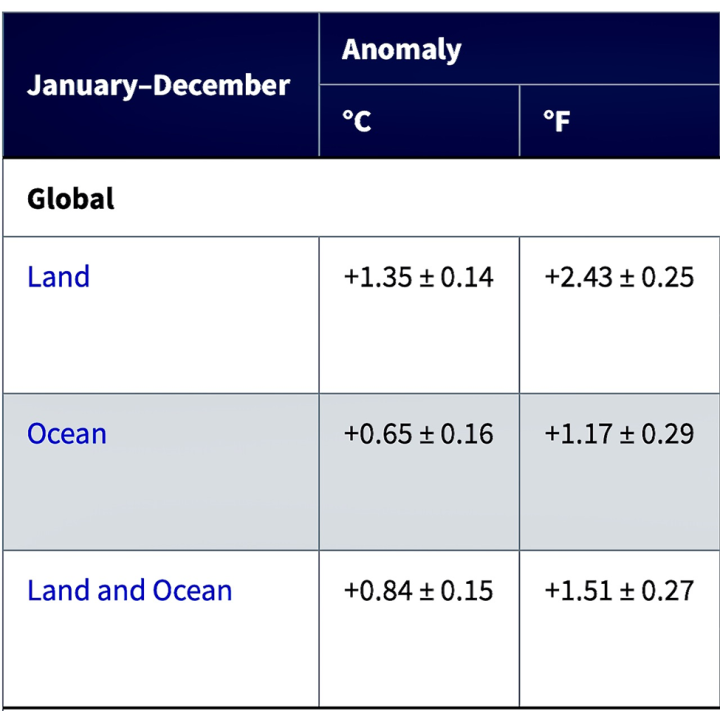
“The year culminated as the sixth warmest year on record for the globe with a temperature that was 0.84°C (1.51°F) above the 20th century average. The years 2013–2021 all rank among the ten warmest years on record.”
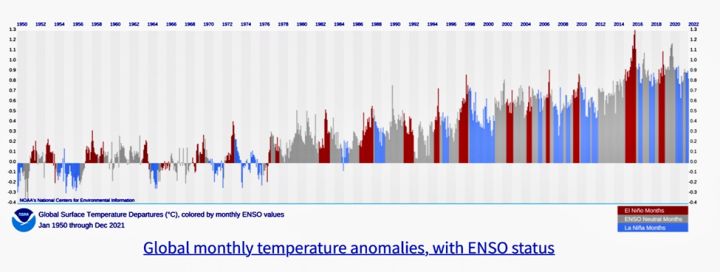
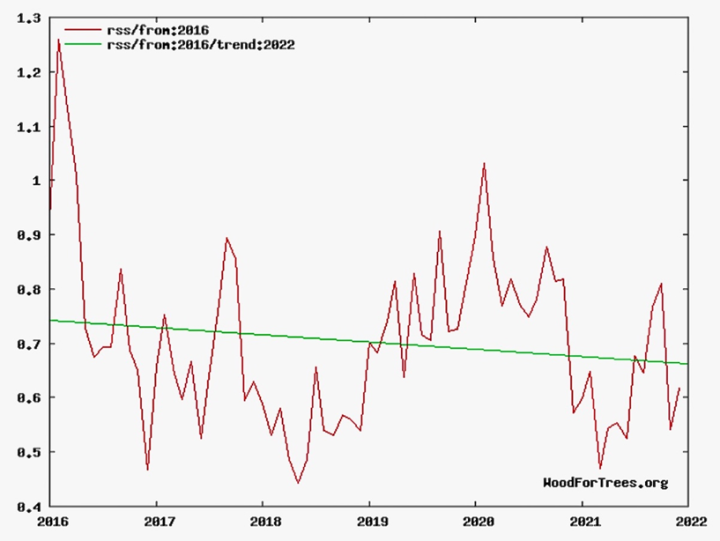
What NOAA failed to highlight was that the year-end 2021 global temperature anomaly measurement marked the continuing decline of its global temperature anomaly measurements that have now fallen for the last 6 years since peak year 2016 as shown in their graph below. These declining measurement outcomes make a complete mockery of recent climate alarmists scientifically unsupported politically contrived “climate emergency” propaganda claims.
The decline in NOAA’s global temperature anomaly measurements over the last 6 years since peak year 2016 is shown in more detail in the truncated NOAA graph below.
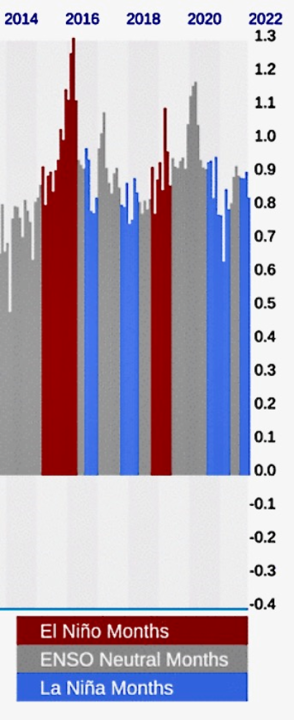
NOAA’s annual highest global temperature anomaly measurement is year-end 2016 which is now shown as 0.99 degrees C (second highest year is 2020 at 0.98 degrees C) compared to its year end 2021 annual anomaly measurement of 0.84 degrees C with a +/-0.15 degrees C confidence level. This year end 2021 global temperature anomaly measurement decline amounts to a 15% global temperature anomaly measurement collapse since peak year 2016.
Furthermore, the NOAA analysis clearly establishes that the monthly and annual global temperature anomaly measurement behaviors are strongly controlled by El Niño and La Nino events (red and blue highlighted portions of the NOAA graph respectively) which are naturally occurring climate phenomena and not driven by man made contributions to atmospheric CO2 levels.
NOAA has exaggerated the importance of both monthly and annual temperature anomaly changes with as small a difference as +0.01 degrees C as a basis for climbing “hottest temperature ever” hype as was done for the July 2021temperature anomaly data even though the confidence level for this measurement is +/-0.19 degrees C as discussed in WUWT articles here and here. Additionally, and more significantly no other global temperature anomaly measurement systems including NASA GISS, UK Met Office, UAH and RSS support NOAA’s “hottest temperature ever” hyped July claims.
NOAA’s July 2021 global temperature anomaly update release originally claimed July’s global temperature anomaly as 0.93 degrees C then changed that in the August temperature anomaly update release to 0.92 degrees C but by the November temperature anomaly update had changed the July temperature anomaly once again back to 0.93 degrees C.
NOAA makes extensive temperature anomaly measurement updates every month where large numbers of prior temperatures are changed again and again. For example, NOAA’s August 2021 temperature anomaly update compared to NOAA’s November 2021 temperature anomaly update shows that in the period between 1954 and 2021 over 250 monthly anomaly temperatures were increased always by +0.01 degrees C with about half of these upward adjustments made in the 1992 to 2021 period.
Thus, more than 1/3rd of the monthly temperature anomaly measurements between 1992 and 2021 were adjusted upward by 0.01 degrees C just between NOAA’s August and November temperature anomaly update releases. These large numbers of constantly on-going upward adjustments result in increasing changes in reported data values with for example the highest annual global temperature anomaly measurement as reported originally for year-end 2016 increasing from 0.94 degrees C to 0.99 degrees C in the year-end 2021 report.
Additionally, these NOAA updated temperature anomaly measurement adjustments between August and November 2021 for years prior to 1954 were also adjusted but in this case always downward by -0.01 degrees C for more than 100 of the prior to 1954 monthly data values.
The justification for NOAA’s never ending upward and downward large number of adjustments that always lower the long past historical data and always increases more recent historical data is extremely perplexing and clearly suggests concerns that these changes are driven by climate alarmist politics (especially by the Biden and other Democratic Party Administrations) versus credible science.
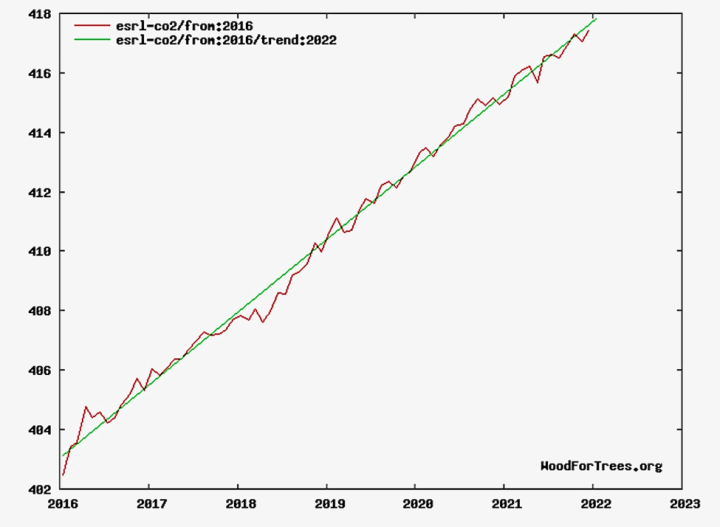
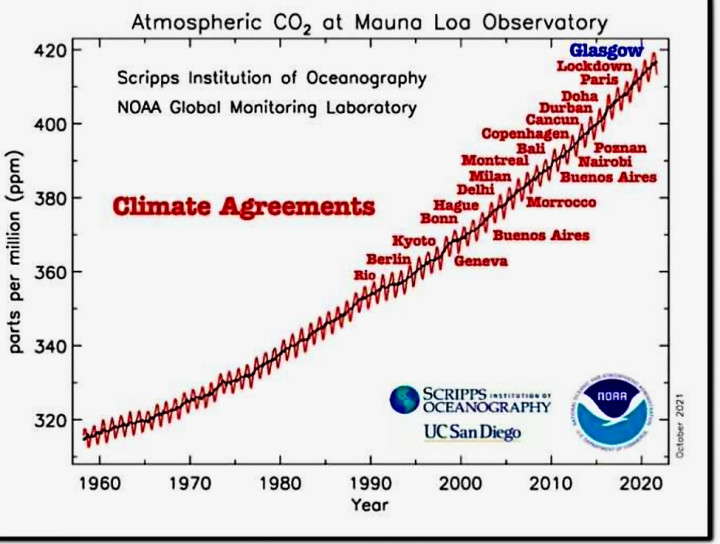
The global yearly annual temperature anomaly decline between year-end 2016 and year end 2021 has occurred despite continuing increases in global atmospheric CO2 levels as shown in the graph below showing CO2 atmospheric concentrations growing from 402 ppm to 417 ppm based on measurements from the Mauna Loa Observatory. Flawed and failed climate “models” would of course depict increasing global temperature anomaly outcomes from this data.
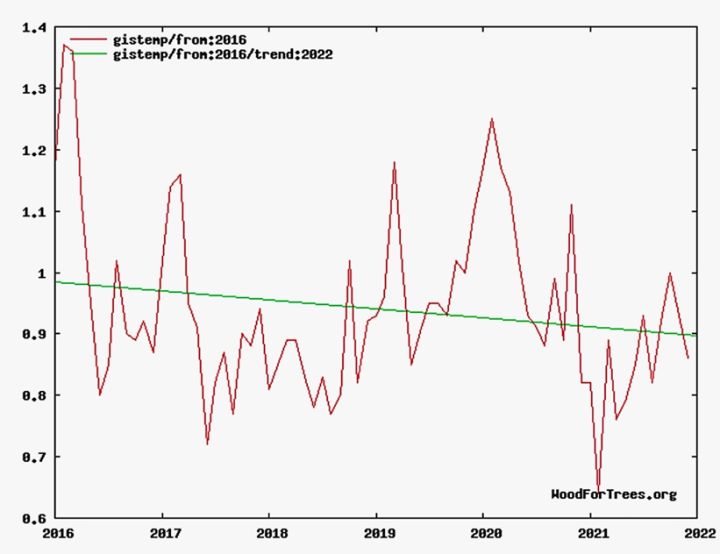
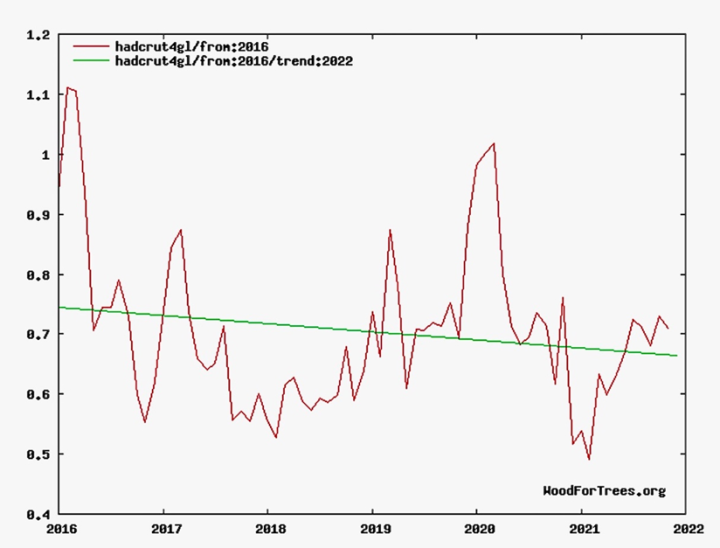
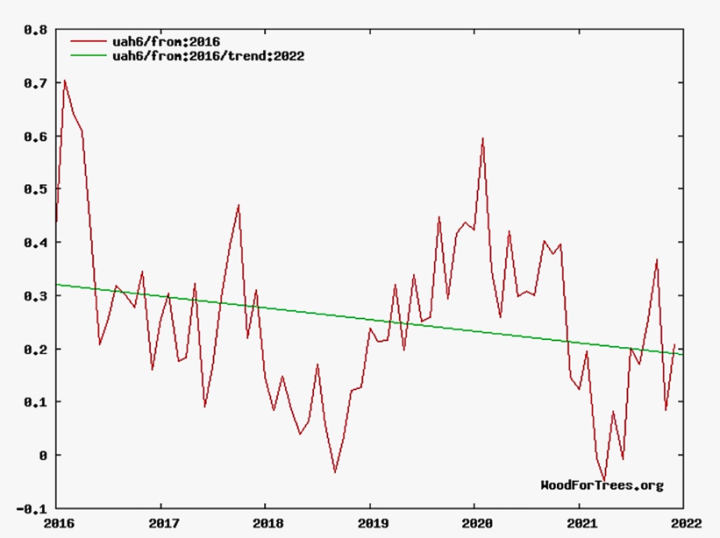
In addition to NOAA’s global temperature anomaly decline since year end 2016 all other global temperature anomaly measurement systems used by climate scientists worldwide all show declining global temperature anomaly measurements during the period from 2016 through 2021 as shown in the graphs below for surface global temperature anomaly measurement systems from NASA GISS and UK Met Office and for satellite global temperature anomaly measurement systems from UAH and RSS respectively.
Despite the usual climate alarmist grossly exaggerated hype by NOAA and NASA in their year 2021 annual reports trying to conceal the clearly obvious downward global temperature anomaly measurement trends while global atmospheric CO2 levels are continuing to climb the annual global temperature anomaly outcomes for year-end 2021 and the last six years do not support and in fact clearly dispute recent climate alarmist claims that we are in a “climate emergency” driven by man-made CO2 missions.
Actual global temperature anomaly measurements by NOAA, NASA, UK Met Office, UAH and RSS all show downward anomaly trends versus the upward climate “computer models” temperature anomaly trends with these speculative “model” trends unsupported by measured data. The failed debacle of the last COP26 climate alarmist confab seems clearly appropriate based upon these latest global temperature anomaly measurement results.
However, all these politically contrived climate alarmist driven COP cabals that commenced in the 1990s have a spectacular track record of failure as noted above.
The climate change propaganda machine is relentless. That said, six years is not a very long time to assess a change in the global climate.
If CO2 be the control knob on climate, as claimed, then six years’ cooling while the supply of plant food in the air steadily increased (despite global economic crash for two of those years), then that length of time can’t be ignored.
Especially coming just a year after a 17-year pause in warming, again under climbing CO2, ended by Super El Nino of 2015-16, which peaked in February 2016.
But the 1988 CACA hypothesis was born falsified, due to 32 years of pronounced global cooling after WWII, during which CO2 steadily grew. Then came the 1977 PDO shift, followed by a slight warming trend for 20 years, ended by Super El Nino of 1997-98.
If you look at the variability of global temperature anomalies, it is easy to see the short term trend means little. It is obvious that short term natural fluctuations are much greater than the expected gradual increase from greenhouse gas buildup. Saying that “CO2 is the control knob” is a statement that none of the climate modelers would agree with in a very short period of time (six years). The climate models predict somewhere between 2 deg C and 5 deg C rise in 100 years. That is only 0.02 to 0.05 deg per year. It should be obvious that natural year to year fluctuations can mask that in the short term.
Being a skeptic and opposing the alarmist climate change juggernaut does not mean you have to take illogical and plainly wrongheaded positions.
What is wrongheaded and illogical? I stated the facts. What kind of control knob only works for 20 years, after a PDO shift, out of 76 years? And even then is interrupted by volcanic eruptions.
What postwar warming has occurred is thanks to Los Ninos and oceanic oscillations not attributable to CO2. Under rising plant food, Earth cooled for 32 years, coincidentally warmed for 20, went sideways for 17 and now has cooled again for six. Arctic sea ice fell from its near-century high in 1979 to its low in 2012, while Antarctic sea ice grew from 1979 to its high in 2014.
How then is it logical to attribute these fluctuations to global warming caused by increasing CO2?
Characterizing it as a “control knob” is just wrong. It is not a thermostat, and any warming from GHG buildup is very small year over year. Nevertheless. the UAH data that we see every month does show a warming trend, does it not?
The 30 year trend shows warming because its still dominated by the warmup from coldest period, 1980-2000.
A ripe juicy cherry that every year turns a little more sour.
Stating that does not change that the last 6 years are trending down, which is the point of this post.
It’s no fun exercising self-control and holding back from making Hooray for our side! empty comments.
If the point of this blog is to serve as an echo chamber with all the fact-checking quality as Rachel Madcow questioning Bernie and AOC, then sure, go ahead and reverberate to the choir.
If there should be some hope that an honest inquirer happens by to read reasoned, solid skeptical arguments and forms a more skeptical view of how they should vote and otherwise opine on things like radical change to avoid a climate emergency, then we should be more conservative about the claims we make. Implausible questionable claims should not be made with strident certainty.
Rich says:” Implausible questionable claims should not be made with strident certainty.”
You mean “like the science is settled”?
Please state what was implausible or questionable.
Making claims about climate based on a six-year trend is the complaint that Tom.1 made and that I supported.
But more generally I had in mind as well the periodic no-holds-barred angry rants we see here that there is no such thing as the natural greenhouse effect, let alone any enhancement by extra CO2, or the idea that CO2 is increasing in the atmosphere due to oceans warming and our emissions get absorbed by the nearest tree.
If CO2 is not a control knob, then why are we spending trillions upon trillions of dollars as if it is a control knob?
You can’t have it both ways. Either CO2 controls the temperature or it doesn’t. Choose one.
If something else causes CO2 to exhibit an outsize effect, then we should concentrate on that phenomena instead.
Are you implying that I say CO2 is a problem or for that matter that there is any problem from any cause as far as climate is concerned?
The only problem we have is dimwitted and greedy bastards trying to get rich solving a non-existent problem.
I’m interested in skeptics having a (much) better marketing plan than we’ve had for the past 40 years.
Persuasion is our only option unless you have troops?
Since skeptics don’t have access to many media outlets, Rich, what is your marketing plan?
My thought is that if skeptics only have a few places to get the message out, and WUWT is the most visited, first time visitors who are open to persuasion shouldn’t be turned off by what they see here. And first time posters should be treated with respect, at least until they prove that they are not persuadable and not respectful.
“don’t have access to many media outlets”??? They’re all over the internet, while real scientists are busy doing their research.
What does affect our environment/climate is all of the poisonous chemicals being sprayed down on ALL of us nearly every single day!! Chemtrails are killing our plants, animals, water, and undoubtedly killing us!!
The “no GHE” idiots are roundly criticized here on WUWT. Get over the fact that WUWT doesn’t censor poster like the CliSciFi sites do.
The “six-year” trend is in response to the “hottest year evah!” meme. Get over that, too.
A slight trend up from 1979, after the PDO shift reversed the multidecadal postwar cooling.
“Control knob” is the Warmunistas’ term, not mine.
I think you made that up, but whoever says CO2 is the control knob is just wrong.
https://www.science.org/doi/10.1126/science.1190653
Have you told the authors they are wrong?
Now Tom.1 has learned something useful about just how whacked out alarmist speculation is (I won’t dignify it as even a hypothesis, let alone theory). He already stated that anyone who says CO2 is a control knob is wrong. Now he likely has a better idea why we think Gavin Schmidt is a charlatan.
Hypothetically you just got a win for the skeptical team. But why ask accusingly as if Tom.1 is going to reject your comment?
I’m being so damn annoying here because I can’t see why we hop all over a guy who as far as I am aware is a relative newbie and is making completely reasonable comments.
People don’t like being attacked, Rich.
Pretty funny Dave. Many of my comments get attacked, unfairly I would say.
I am not a newbie. I’ve been here a very, very long time.
Not sure why I hadn’t noticed your comments before. In any case it doesn’t change my point.
Theoretically a new visitor posts an innocent point that challenges what some others are arguing. If we care more about changing hearts and minds than about rhetorical blood sport, then we ought to engage the argument without immediately disparaging the commenter.
How did I “jump on him”?
He jumped on John Tillman for using the term “Control Knob” in reference to CO2 above.
I merely pointed out where it came from.
PS CO2 has been turned up to “11” in the past.
(Before Man first rubbed two sticks together. We didn’t cause it.)
They claim to have done experiments, however clearly from the abstract they merely did calculations, without experimental verification. A “control knob” implies there are no natural climate negative feedbacks to an increase in CO2 levels. Their calculations obviously removed any possible negative feedbacks, and proved something, despite for example the antarctic ice core data that shows co2 levels clearly lagging temperature trends..
The UN IPCC CliSciFi models say that CO2 is the control knob since their temperature outputs are a linear reflection of atmospheric CO2 concentrations. The whole “Net Zero” fad is based upon CO2 being the control knob.
What is your problem with the people on WUWT, Tom?
All of the climate models show some ticks up and down four or five years into the future, natural variation I suppose. After five years the climate models all become y = mx + b linear projections with no variation. No La Nina’s. No El nino’s. No pauses at all. The value of “m” is based on the three CO2 production estimates the IPCC provides. So the climate models *do* use CO2 as their control knob.
There are warming trends after each prior cold period as well. CO2 concentrations are presumed to not have increased but there are no reliable data to confirm, only proxies that may be reliable. Yes, most of us agree that CO2 will warm the climate slightly, with the benefits outweighing the enormous costs of trying to reduce our CO2 output. However, a warming tend now does not mean that disaster is imminent.
Showing a “warming trend” is not nearly enough to support a prediction of “catastrophic” future warming due to rising CO2.
First Question: Is there accelerated warming compared with the baseline slow warming coming out of the Little Ice Age?
Second Question: If yes to #1, is that acceleration above background warming diminishing in proportion to the rising CO2?
Ie., is there a CO2 saturation effect so that (change in Temperature)/(change in CO2) is on its own a declining number?
Third Question: Are there negative feedbacks that grow to limit any CO2-induced warming (eg, the water cycle effects that Willis E has been proposing?)
Fourth Question: Is the predicted moderate warming even a negative for life on Earth, especially taking into account the clear “greening” from rising CO2?
No, it does not, Tom. The models show that CO2 is the CliSciFi “control knob” because all of the UN IPCC CliSciFi-modeled temperature outputs have a direct linear relationship to atmospheric CO2 concentrations. Additionally, UAH6 shows many months with no warming trend.
With UAH 6 you have a 42-year record, a period of warming during an approximately 70-year cycle of cooling and warming. Over that entire warming period, one gets a trend of only about 0.13 C/decade for the combined land and ocean surfaces. The UN IPCC CliSciFi models say it should be 2 to 3 times that based on actual atmospheric concentrations of CO2.
UAH6 and the other temperature datasets shows that there was recently an approximately 2-decade pause in any significant warming of the globe. A pause anywhere near that length has not been reflected in the outputs any of the CliSciFi models. The UN IPCC CliSciFi modelers said earlier, during the pause, that a pause of 15 to 17 years would invalidate the CliSciFi models. The CliSciFi field ignores those past statements in the UN IPCC AR6. In fact, the UN politicians/bureaucrats tell us in AR6 they are “even more confident” in the models’ outputs.
Tom,
You have made reasonable claims. I’m not sure the voting up or down bs is becoming to a site devoted to the reasonable discussions on scientific knowledge.
The issue TCS and ECS are hotly debated, and I side on the low side of both estimates. However. most reasonable.people knowledge that the greenhouse effect is real. Accordingly, it is not unreasonable to expect a return to a gradual warming trend.
I’m with you, John Tillman… January and February will be colder.
Bundle up! Buy a generator and a good wood stove.
In 2002 we predicted cooling starting circa 2020 due to low solar activity and that is happening now – and I did not count on this volcano, which looks big.
HUNGA TONGA’S PLUME WAS STRATOSPHERIC (98,425 FT); AT LEAST 6 KILLED IN JAPAN SNOWSTORMS; RECORD-BREAKING WINTER STORM SLAMS EAST COAST AND CANADA; + FIGHT…
January 17, 2022 Cap Allon
HUNGA TONGA’S PLUME WAS STRATOSPHERIC (98,425 FT)
According to the Ozone Mapping and Profiler Suite (OMPS) lidar-based satellite, measuring the global distribution of ozone as a remote sensing method, it seems the Jan 15 eruption of Hunga Tonga-Hunga Ha’apai had a maximum column height of approx. 30km (98,425ft)–and so well into the stratosphere.
Video: https://twitter.com/US_Stormwatch/status/1482229220415721475
That‘s the sort of thing that will really mess up your day.
TONGA’S HUNGA TONGA VOLCANO JUST HAD ONE OF THE MOST VIOLENT VOLCANO ERUPTIONS EVER CAPTURED ON SATELLITE.
@US_Stormwatch
Impressive video at https://twitter.com/i/status/1482229220415721475
That is obviously your opinion. However, you don’t provide anything in the way of facts to support it.
So you are saying it’s ok to take illogical and wrongheaded positions.
You seem to have a reading comprehension problem. I never said it was OK “to take illogical and wrongheaded positions.” You accused John of doing so, but without any evidence at that point in the thread to support your accusation.
Show me a reply to John where I used those words.
https://wattsupwiththat.com/2022/01/17/climate-alarmists-conceal-global-temperature-anomaly-measurement-declines-despite-increasing-atmospheric-co2/#comment-3433878
I stand with Tom.1 on that statement. The best way to undermine the skeptical case is to make unsupported claims.
What unsupported claim did I make?
That was Tom’s unsupported claim.
I stated the facts of climate history.
The only extended interval in which warming coincided with rising CO2 was from 1977 to 1998. For the previous 32 years, rising CO2 correlated with falling temperature. For the subsequent 17 years, climbing CO2 correlated with flat temperature. For the past six years, waxing CO2 yet again correlates with cooling.
Postwar Los Ninos also briefly coincide with rising CO2, but so do Las Ninas and Las Nadas, hence no correlation.
I don’t think you made any unsupported claims (or showed any wrong-headed thinking either). I believe his reference is to the head post and drawing conclusions about climate from a six-year trend.
Whatever Tom.1 meant, what I mean is that we should be very careful to only make claims that are strongly supported by data and be willing to listen to other’s objections and try to see if there’s any reasonable doubt so that the skeptical argument is sellable to the open-minded. What I see more and more is a tendency to abandon all hope of persuasion and just jump to condemnation.
What I see more and more is a tendency to abandon all hope of persuasion and just jump to condemnation.
I wonder if that isn’t the real intent of our more stubborn trolls: creating just that sort of attitude.
OK, now you are making sense. You must have sobered up. 🙂
You say that you “stand with Tom.1” However, it was Tom.1 that made the unsupported claim that John’s remarks were “illogical and wrongheaded positions.” Have you and Tom.1 been imbibing excessively? You aren’t making a lot of sense.
I haven’t had a drop in months, Clyde.
It was not my interpretation of Tom.1’s remarks as being directed toward John, but rather in general that talking about a trend based on 6 years as in the head post is unsupported and wrong-headed, and that skeptics taking that kind of position is discrediting to all skeptics.
Tom.1
“The climate models predict somewhere between 2 deg C and 5 deg C rise in 100 years.”
—————-
That is illogical.
Climate models do not predict.
Besides, can you contemplate the difference in reality,
between of 420 ppm being clearly Natural versus the 420ppm being Anthropogenic.
If we say;
a) Natural
Versus
b) Anthropogenic.
then;
The ‘b” is a scenario of bonanza and beauty,
while the ‘a” not so much… in contrary “a”, is scenario that must not be ignored and also taken very seriously… as it happens to be a very serious scenario.
To help you get it.
In consideration of CO2 ppm(s) as a climate indicator, what it indicates when CO2 atmospheric concentration (ppm) reaches Max value, by the natural mean, as per the long term data and long term trends?
Let me spell it for you:
“Cooling, a certain and very considerable turn of/to a climatic cooling trend.”
As noted, it’s not just the past six years of cooling. Average global T was flat for 17 years during the Pause. Earth cooled dramatically for 32 years after WWII, despite steadily rising CO2. The only slight warming cycle was from 1977-98.
The models claim a central figure of 3 degrees C warming not in 100 years, but by the end of this century, when CO2 is supposed to have doubled from AD 1850 level. Since one degree has already happened, that’s two degrees more in about 80 years.
But warming hasn’t been stready, despite rising CO2 since 1945. So it’s not the control knob. Natural variability still rules T.
You are ignoring the fact that the predicted warming from GHG buildup is very small compared to natural fluctuations. It is also the case that we know that pre-industrial age natural temperature fluctuations are quite large relative to what is predicted from the current GHG buildup. It does not mean that the current GHG buildup is not causing some warming. It should be blinking obvious.
It’s not at all obvious that more plant food in the air and even slight warming are deleterious. In fact, so far they’ve been beneficial. Earth has greened, especially it’s near deserts.
The issue is how much warming has indeed ocurred due to an increase in a vital trace gas. Given that negative feedbacks are more common than positive in nature, CO2-caused warming could be less than its 1.1 degree C per doubling baseline, not Charney’s 1.5 to 4.5 degrees C, with positive feedbacks. Some negative feedbacks are known, but there are possibly others.
More CO2 has arguably even cooled Antarctica. And above about 30 C in the moist tropics it might do the same.
“Climate science”, ie GIGO computer gaming, is unsettled, to say the least. Even the real science of climatology is still in its infancy.
John, I agree with everything you wrote. But none of it refutes Tom.1. Even a series of random numbers, with an induced positive trend, will have much variability that can result in extended periods of no increase.
It’s interesting to note that a series of 100 random numbers from 1 to 10 will almost always have a trend (either up or down), since it is somewhat unlikely that the first numbers in the service will have the same average values as the last numbers.
Since the climate of Earth is very complex and random but strongly bounded (the climate never gets really hot or really cold), I think this means that there can be long term trends that have no cause other than random statistical fluctuation.
In other words there is no necessity to have a “climate forcing” be the cause of the Medieval Warm Period, or the Little Ice Age, or the current warming. They could all just be random statistical fluctuations of a system that never gets very hot or very cold, but that is inherently unpredictable in it’s mild variations between max and min.
Earth’s climate does indeed get very hot and very cold. Its average temperature during Snowball Earth episodes is around -50 degrees C. What its hottest GASTA was since the crust cooled is unknown, but possibly 30 degrees C.
In the Phanerozoic, the range has been narrower, ie from less than eight degrees at glacial maxima to over 28 degrees during the Permian. So a range of ~20 degrees rather than 80.
A water planet is homoestatic, but if iced over, can stay that way for a long time. The sun however was weaker during the Proterozoic Snowball events.
“The sun was weaker in the Proterozoic snowball events” – how do we know this? Are changes in the sun the reason for the warming since the little ice age?
Well said.
Thomas, there is nothing random about temperatures on earth, or any other system you may care to suggest. Each swing has a physical reason (if honestly measured). That is the reality of science.
The earth system is very complex, however, with an unknown large number of components affecting temperature, each with it’s own variability constantly adding or subtracting from instantaneous temperatures. This accounts precisely for each zig and zag even if we can’t sort it out (yet).
“WMO still recommends the continuation of the 1961-1990 period for the computation and tracking global climate anomalies relative to a fixed and common reference period.” GISS actually uses this period as its base for the same nefarious purpose.
Now, why would you choose the coldest 2 decades of the “Ice Age Cometh” and then add the cool half of the 2 decade end of 20thC warming period for your baseline. The temperature dropped ~0.5°C in that cold period. This automatically adds about 0.3C to the anomalies NOAA is yammering about.
Moreover, that 0.5 C drop essentially erased the amount of warming measured since 1850! How did rising CO2 cause that? The obvious answer is natural variability is about that magnitude which overwhelms the apparently small effect that CO2 has. IPCC had judged, until recently that human caused warming was about half of the warming since 1950, before which the human contribution was negligible.
Continued cooling, as is feared by the consensus (Gavin Schmidt, modeler for NASA, admitted that models are running away too hot “and we don’t know why”), could well join us up to the old Pause anyway regardless of the fiddling.
Meanwhile, CO2 has increased about 40% since 1950 (with no notable warm T crisis in the offing) and with Asia and Africa going to coal (and even European renewables seem to have peaked over 5yrs ago and their old ‘farms’ are now being decommissioned), CO2 acceleration is going to increase. Surely, one shouldnt expect so many new cold records in EU, N.AM, Australia, Brazil (coffee wiped out), etc.
Gary. Sure there is a cause for everything but in very complex, interrelated systems, it can quickly become impossible to ferret out the chain of causes and, therefore, it becomes impossible to predict the future of the system. Which is pretty much the same thing as saying it is random.
I think it was Feynman who put it this way. Imagine you are standing next to a water fall and a drop of water lands on your nose. Do you think you could build a mathematical model that would predict when the next drop will hit you nose. All the interactions of all the water molecules in the complex riverbed upstream of the waterfall, and the wind that may, or may not, have pushed that drop to your nose, are too complex to model.
So random fluctuations of a global average temperature are so complex as to be essentially random and unpredictable.
Of course, the global average temperature itself isn’t even a measure of atmospheric energy content (what would be enthalpy) and it can change radically in short time periods, with no exterior forcing whatsoever.
For example, in a typical super El Niño year, there has been no significant change in the greenhouse gas content of the atmosphere, no significant change in solar radiation, etc. Yet the average temperature can go up by more than a degree Celsius in less than a year. That happens because a bunch of warm water, that had been constrained in the Pacific warm pool, suddenly sloshed out over the Pacific and conducted heat to the air.
In a very real sense, El Niño warming is actually a process by which the Earth rids itself of accumulated heat. We feel and measure the heat as it passes through the atmosphere on its way to deep space, and we think the Earth has warmed, the Earth/ocean system is actually in the process of shedding accumulated heat, not gaining heat.
It would seem you are trying to say the climate models are useless. I think you’ll find that most Global Warming sceptics will agree with you! That makes all the trillions of dollars we are spending on Global Warming a waste of money.
… your point being that there is then no way to challenge or refute the premise (not theory) the increasing CO2 is a threat to life on earth?
… no way to refute the premise that increasing CO2 will cause a significant increase in temperature across the globe?
The science be settled then.
Don, There is no compelling evidence that CO2 is a treat to life on earth, but the theory can only be refuted by the passage of time. If we could add a whole lot of CO2 quickly, then it would take less time but it would still take time to reach a new equilibrium, if there even is such a thing.
“Threat” not “treat.” CO2 is, without question, a treat to life on Earth. It’s the gas of life. : )
When you argue with someone, do not put words into their mouths.
I haven’t seen Tom.1 say anything about the small amount of warming that has been caused by CO2 being bad for anybody or anything.
He buys into IPCC’s 5 degrees C of possible warming. That’s not a slight amount.
It’s also not deleterious.
5 °C doesn’t seem like all that much warming to me. It warms by much more than that every day in most places on earth.
If all the warming of the past hundred years occurred over 10 minutes in the room people are sitting in as they read this (assuming anyone is!), most people wouldn’t even be aware that it got warmer.
Tom.1 did NOT say or imply that the slight warming is in any way deleterious. All he said was the eminently reasonable comment that natural variability has not disappeared.
All I can say to you Tom.1 is you’re not alone, even if we’re outnumbered.
“You are ignoring the fact that the predicted warming from GHG buildup is very small compared to natural fluctuations.”
What???????? The important point to remember is that according to scientology there are no more natural fluctuations, just one more thing that CO2 did.
At best they will state that natural accounts for 50% of observed rise.
50% is half.
It is not “very small compared to natural fluctuations”.
I see you doing your best to change the story, bravo
It’s bad form to bring religion into the discussion. As an atheist, I don’t think Scientologists beliefs are more outlandish than other religions.
Pat, I think Tom.1 is saying the year-to-year natural fluctuations swamp any potential CO2 warming, whatever that level is. I’ve said enough; I’ll leave it to Tom.1 to defend himself.
There seems to be a logical flaw in this post. You state, correctly, that pre-industrial climate fluctuations are much greater than any warming predicted by climate models. That being so, how can you attribute any warming to CO2?
While the data isn’t sufficient to prove that CO2 is a weak greenhouse gas, it also isn’t sufficient to prove that CO2 is not a greenhouse gas at all.
Mark, you filthy lukewarmist! 😜
If we would just hold the line on there being positively no such thing as the greenhouse effect and CO2 being all natural anyway, for sure Brandon will see the light and return to Trump policies.
It’s useless to convince anyone that based on empirical data, ECS is a harmless 1.7K and so we have 50+ years to build nukes that would be a no-regrets approach. We must get everyone or at least 50% to believe that everything they have been told is completely wrong. It’s the only way. If ECS isn’t a valid concept how can we compromise and say well, assuming you’re right, still the data shows that your so-called ECS would be 1.7. No sir, that would be impure thinkin’ right there.
Applying Occam’s Razor, we should say that, since natural variability accounts for all the observations, there is no need to invoke any effect by CO2.
Of course, there may be some effect, but so far there is no physical evidence for it.
I am not personally attributing any warming to CO2 or any other anthropogenic cause; I’m not denying it either. I have only pointed out the amount of warming that the climate models have predicted, between 2 and 5 deg C of warming in the next 100 years, more or less. This is a very small amount per year, and if they are right (I’m not saying they are), it is a very small amount compared to the natural variability of global temperature.
I think Tom.1 only means that natural fluctuations, even pre-industrial fluctuations, can swamp any mild, long term warming that CO2 might be causing.
Do we have any projections of temperature increases during an interglacial period? Earth has gone through these cycles many times.
Tom.1 says” It does not mean that the current GHG buildup is not causing some warming. It should be blinking obvious.”
Got any proof of this? What evidence you got?
mkelly
Not that you seem like you want to try to understand what was said, but you’re obviously being unfair in your argument here. Tom.1 said that there is insufficient evidence to prove x and that is not sufficient evidence to disprove x. (Which is in fact “blinking obvious”)
It does not mean that he claims that x is true. And it explicitly states that he believes that he doesn’t have any evidence of x being true.
So asking “Got any proof? What evidence you got?” doesn’t make you look like the sharpest blade in the drawer.
Again, if the effect of CO2 is much, much less than that of natural variation, why are we spending trillions to reduce a gas that has little effect.
I think you are understating what the warmists believe and have subsequently convinced politicians to believe also.
It is a opportunity to increase power and for some elites to earn outlandish amounts of money. Ask yourself why most wind and solar farms are not under public utility regulations that require ongoing supplies of electricity. 15 to 20 years from now when those windmills and solar panels need replacing do you think the depreciation allowances will be available for replacement? If not, who will pay again?
If you want to know why countries are spending so much money on a non-problem, you need to ask the politicians in charge of that spending, not Tom.1.
They’ll sit there and rot just like the old wind turbines here in Cali. The only replacement will be new generation nuclear.
Tom, the whole CliSciFi edifice is based on predicted warming from GHG buildup overwhelming natural fluctuations. That is what people are responding to.
You seem to be saying that annual to decadal natural temperature are large compared to the gradual impact of regularly rising CO2 concentrations. There is no doubt about that, but pointing out a six-year decline in temperatures is OK considering it is in response to another “hottest year evah!” propaganda piece.
So, we are going to have to wait a century? Obviously there are factors at work other than CO2. There is a long list of known factors….and probably still some unknown factor(s). It is real convenient that there is no known experiment to prove disapprove the effect of CO2.
I don’t think we should have to wait that long, but 6 years, or even 10 or twenty is not enough. Time will reveal all, but whatever it reveals some will not accept it.
Why then doesn’t 32 years of cooling from 1945 to 1977 under rising CO2 show CACA false? The cooling began earlier in the ’40s.
The CliSciFi practitioners “muddied” the 1945 to 1977 “waters” with assumed aerosol cooling. They simply ignore the early 20th Century warming and won’t talk about it. Since they control the media they get away with it.
We’ve been adding CO2 from land clearing and fossil fuel burning for a very long time now. The experiment is complete. CO2 has, at worst, a negligible effect on global temperature. The mild warming since the end of the little ice age has been beneficial to mankind and to Earth’s biosphere, to which we are inextricably linked.
Guess who won’t accept “it”? The meme was falsified resoundingly in the first decade of the millennium when anomaly forecasts 200-300% too high vs observations: balloon radio sondes (which corroborated satellite data). A decade later Gavin Schmidt, NASA’s modeler, admitted models are running away too hot “and we don’t know why?”
There is a fear out there that a long cooling period starting in 2016 may be developing. From the apparent natural 70yr oscillations seen in the temperature record, one is due and was predicted by a few researchers. That would be all she wrote if it comes to pass.
The 2022 and 2024 U.S. elections might give us some breathing room from the Net Zero rush. Let the UK and EU be the crash test dummies.
The folks at CRU said that if they ever had a pause of 17 years then the models were wrong. We had a pause over 18 years, but they changed their minds. So twenty years is way more than enough time.
Tom, the UN IPCC CliSciFi modelers previously said that 15 to 17 years of no significant warming would be enough to falsify their models.
The lack of significant warming from the late 20th Century through the early 21st Century should be sufficient to justify at least a Lukewarming position.
We do have “experiments”, Each of earth’s six ice ages commenced with Co2 much higher than current levels. The other two human caused experiments- the financial crash energy use reversal, and the Covid lock down energy use reversal- were both shown to have no effect on the long term ACO2 levels
Why do you believe that you need to “disprove the effect of CO2”? Why is it either zero effect or hell on earth?
Seems to me that evidence that any effect as there might be must be too small to have a practical effect is exactly how we make the case that the cure is far worse than the disease.
We don’t need to know exactly what the effect is when the empirical data shows that if the ECS concept is even valid, the value would be 1.7 degrees for a doubling of CO2 concentration.
Why set the bar at proving zero which is going to be No-Sale to most decision-makers, when accepting FOR THE SAKE OF ARGUMENT ONLY, that their hypotheses are valid, but ECS is 1.7, stands a very reasonable chance of being accepted? (Especially when the peasants have their pitchforks up the politicians arses).
I just don’t get it.
Tom. 1
You mean by short term anything under 200 years I guess, because over the last 10,000 years the trend has been all down hill and still is.
The Holocene Climate Optimum ended about 5200 years ago.
Right on. I respectfully decline to put on the blinders now in wide use limiting the view to the years since 1850. Tain’t scientific.
It is surprising that you nonchalantly accept the large annual variations. What causes the annual variations? Is the cause strong enough that it is actually responsible for the long-term trend and what we are observing is variations in that strong forcing? Your mental model suggests that the tail is waging the dog.
Yes, just explain the MWP and the RWP with your man-made CO2 theory.
Good God some of you people really are incapable of reading or reason I guess.
When did Tom.1 say that CO2 is even a major factor? He was the one who pointed out that internal variability didn’t go away and can easily swamp any slight warming that might come from enhanced GHE. That right there says he doesn’t believe in any control knob nonsense.
A reasonable person would recognize that he’s a skeptic who just wants to see a believable case made for skepticism.
Good job folks. Hopefully you scare him off and make sure that only purist cranks post at WUWT.
I think Tom.1 understands that they are not getting it, but they mean well.
Are you saying there are not large annual variations? By large, I just mean with respect to any change that could conceivably be cause by GHG build up. What is nonchalant about it? For one thing, El Ninos cause very large variations over a period of a few years. It is a natural phenomenon which has nothing to with the greenhouse effect.
Have been following the conversation of tom.1 and others. I’m nowhere near as expert as most here but it seems to me that Tom makes sense except that the TEAM and most others take the same approach/ numbers but turn it into “We have a climate crisis” So makes it hard to accept as most, not aware of the nuances, will as we see, agree and panic.
There is a communication problem, which I’m not accustomed to. Therefore, I think the problem is on your end.
I never said that there aren’t large annual variations! I asked you to what you would attribute large variations, since random variations tend to be small.
What is “nonchalant” is that you readily accept large variations without questioning why? You accept changes in CO2 that are so small as to be immeasurable and assign them an anthropogenic source. Yet, don’t blink an eye at larger variations that are more deserving of an explanation.
Clyde. Tom.1 didn’t accept any changes (warming or cooling) due to CO2. He just noted that there are many six-year-plus periods of warming and cooling. Imagine a sine wave that goes up and down across the zero line on a Y-axis with a frequency of six time steps between each peak. Now tip the sine wave so there is a long term rising trend. You can’t point to any of the down periods and claim that the sign wave is not slowly rising. I think that is all Tom.1 is saying.
I’m not talking about seasonal changes, which are periodic. I’m referring to non-periodic inter-annual changes that generally are unexplainable, with the exception of El Ninos and strong volcanic eruptions.
Clyde, your last paragraph is nonsensical. Reread it and try again from a reader’s perspective.
I don’t find it nonsensical. However, since you do, perhaps I have failed in communicating.
Yep, that is the job of the communicator.
I agree with Tom.1. Short term variability, which can last several decades, can result in extended periods of cooling even though there is a longer term warming trend.
But that doesn’t change the fact that the is no compelling evidence to indicate that CO2 is the cause of most, or even a detectable amount, of the long term warming trend.
I like the last chart. It shows that the CO2 accumulation trend increased by 54% in the 30 years since climate agreements began. There is some remote possibility that alarmists are correct, but there can be no doubt that they are very ineffective at reaching their goal of slowing CO2 accumulation.
Tom. 1 isn’t wrong in his argument, but the long term trend is not up it is down and has been for thousands of years.
In and of itself, the fact that we seem to be bucking the long-long term trend is one of the big reasons that alarmists have convinced themselves that our CO2 is wot dunnit.
Personally I hope our CO2 really does help stave off the next glaciation. We’re not ready for that.
“In and of itself, the fact that we seem to be bucking the long-long term trend is one of the big reasons that alarmists have convinced themselves that our CO2 is wot dunnit.”
The long-term trend, and the short-term trend are both down. The only things that show an unprecedented warming trend are the bogus, bastardized Hockey Stick computer-generated charts.
Unmodified Tmax charts from all around the world show it was just as warm in the Early Twentieth Century as it is today, so no warming trend other than the natural one from 1980 to 1998, and in the United States, it was warmer in the 1930’s than it is today, so the U.S. is in a temperature downtrend at the moment.
The warming trend from 1980 to 1998 is just one leg of the temperature cycle. Temperatures cool for a few decades (1940 to 1980) and then warm for a few decades (1980 to 1998) and then repeat the process, and it looks like we are cooling now.
There is no long-term warming trend and there is no unprecedented warming today. Those exist only in the fervered imaginations of the Temperature Data Mannipulators. And I guess it applies to gullible people, too. But they are all wrong, no matter who takes that position.
All you have to do is look at unmodified Tmax charts from around the world. They tell the real story of the Earth’s temperatures, and they say we have nothing to worry about today because there is no unprecedented warming caused by CO2.
I don’t say that you’re wrong, because so many adjustments warming the recent past and cooling the distant past just doesn’t pass the smell test for me.
I’m just approaching the same elephant from a different perspective. Saying, hey, I have a hard time believing that your adjustments are legit, but let’s accept them for the sake of argument. What would it mean if your adjustments are all totally justifiable? The answer is that we would be seeing a beneficial slight warming. Not a climate emergency.
I think it’s easier to sell that proposition than to defend the view that there’s a vast left wing conspiracy to cook the data.
Yes, I do suspect that there is a set of structural incentives that leads to at least exaggerating warming, and that certain well placed miscreants are most likely falsifying the record rather than just getting it wrong. But why don the tinfoil hat for them to brandish the conspiracy theorist accusations? If this is the worst they can concoct, all we need to do is point out that it’s weak tea.
You are correct. The downturn started about 1000 BC according to the Greenland Ice Core studies.
I still think the alarmists need to answer the MWP and RWP issues – both are centuries-long periods of warmer climate as best we know. And both were world-wide; not regional as the alarmists claim. To my mind this is the most obvious rebuttal to the man-made CO2 warming nonsense.
The unmodified, regional temperature records are an even better rebuttal of the CO2 crisis. We don’t have to guess at the data there, and the data shows it was just as warm in the recent past as it is today even though much more CO2 is in the atmosphere today then in the recent past, so CO2 has had little impact on temperatures.
In order to expect a long term warming, and I mean long, you must ignore that we are in an interglacial period that will end as new glaciers form and start to cover the earth as they have before this current interglacial.
Someone had to say it.
Six years is not enough to say anything about anything.
The short term trend meant a lot when they switched from global cooling with 1979 as coldest year on record to global warming by 1983.
You are telling us that the models predict something that we cannot measure. But we must believe them. Yet the AGW experts have been predicting catastropic alterations in the climate, none of which have occurred, on a decades long timescale. They would have us waste inordinate amounts of money and leave the vast majority of people in energy poverty to prevent a catastrophe that will befall people a century from now, maybe, IF the models are correct.
Why are you putting words in his mouth? Nobody has said that we ought to believe models. All he said was that if alarmist models predict 3-5degrees/century then that would be 0.03-0.05 degree per year. He noted that natural variability can swamp that, so 6 years isn’t long enough to rule out natural internal variability.
I think the pause was more likely ended by the 2014 PDO shift. That also likely enhanced the 2016 El Nino. Here’s what the data looks like over the past 25 years.
https://woodfortrees.org/graph/uah6/from:1997/to/plot/uah6/from:1997/to:2015/trend/plot/uah6/from:2015/to/trend
We can see both the original pause and the current pause.
There was also stillborn El Nino in 2014, as build up to Super El Nino of 2015-16.
Thanks for the graph. The slight downslope of both pauses is similar. Warming since the PDO flip of 1977 has been thanks to steps up from Super Los Ninos in 1982-83, 1997-98 and 2015-16.
Super El Nino years 1997 & 1998. Too bad Larry Hamlin didn’t look at the older NOAA reports. Thanks to Nick finding, have updated a few times.
They changed the Global Ave Temp years ago. Try this.
(1) The Climate of 1997 – Annual Global Temperature Index “The global average temperature of 62.45 degrees Fahrenheit for <b>1997” = 16.92°C.</b>
http://www.ncdc.noaa.gov/sotc/global/1997/13
(2) http://www.ncdc.noaa.gov/sotc/global/199813
Global Analysis – Annual 1998 – Does not give any “Annual Temperature” but the 2015 report does state – <i>The annual temperature anomalies for 1997 and 1998 were 0.51°C (0.92°F) and 0.63°C (1.13°F), respectively, above the 20th century average, </i> So 1998 was 0.63°C – 0.51°C = 0.12°C warmer than 1997. <b>1998″ = 16.92°C + 0.12°C = 17.04°C.</b>
(6) average global temperature across land and ocean surface areas for 2015 was 0.90°C (1.62°F) above the 20th century average of 13.9°C (57.0°F) =<b> 0.90°C + 13.9°C = 14.80 °C </b>
http://www.ncdc.noaa.gov/sotc/global/201513
(7) The average global temperature across land and ocean surface areas for 2016 was 0.94°C (1.69°F) above the 20th century average of 13.9°C (57.0°F), </i> =0.94°C + 13.9°C =<b> 14.84 °C </b>
https://www.ncdc.noaa.gov/sotc/global/201613
Now the math and thermometer readers at NOAA reveal – The years 2015–2017 each had a global temperature departure from average that was more than 1.0°C (1.8°F) above the 1880–1900 average. 2018 was just shy of reaching the 1.0°C (1.8°F) mark at 0.97°C (1.75°F). </i> =0.97°C + 13.9°C =<b> 14.87 °C </b>
Now The year (2021) culminated as the sixth warmest year on record for the globe with a temperature that was 0.84°C (1.51°F) above the 20th century average. </i> =0.84°C + 13.9°C =<b> 14.74 °C </b>
So NOAA says the results are 16.92 & 17.04 are less than 14.80 & 14.84 & 14.87 & 14.74. Which numbers do you think NCDC/NOAA thinks is the record high? Failure at 3rd grade math or failure to scrub all the past. (See the ‘Ministry of Truth’ 1984).
According to this chart, which year is the warmest?
As you can see, 1998 and 2016 are tied for the warmest temperature in the satellite era, the margin of error being 0.1C for the UAH satellite. This is the real temperature profile. NOAA and NASA are just playing mind games with their bogus, Hockey Stick temperature profile, desperately trying to create a new “hottest year evah!”. It only happens in their computers, not in the real world.
And keep in mind that the UAH satellitte data correlates with the weather balloon data at about 97 percent, making the UAH satellite the most accurate.
The Climate Change Charlatans at NOAA and NASA are full of dangerous, costly lies.
Lol…we are told that their model is solid 😉
Settled science indeed.
There is an old adage, “Even a stopped clock is right twice a day”. Even though I strongly disagree with the alarmist climate change narrative, it does not mean that everything they say is absolutely wrong. To disagree with things that are obviously not wrong just makes you look stupid, and the alarmists will spread that around to discredit skeptics in general.
Ok., a compromise – the climate change people are right 2 times a day. The rest of the day and night they do say anything they want.
Yep the models are not correct. We have had a tiny amount of warming, the planet is greener and humanity is thriving…what is not to love ?
Alarmist hate it. You can see it in their policies and rhetoric.
“ We have had a tiny amount of warming”
you forgot to add ‘since the end of the LIA’….
An important addition.
We haven’t warmed since the Early Twentieth Century, as we are cooler now than then.
👍👍👍✅✅
Mr. .1: Who disagreed with something “obviously not wrong”? You launched the string and Tillman responded, go back and read it and tell me what Tillman said that was illogical and wrongheaded? He asked you, care to reply? Then you accuse him of saying CO2 is a control knob, is this your first visit to the site?? His reference was obvious even if you’ve never seen a Tillman comment before. Your reply drew criticism (Mr. Davis is worried you may be thin skinned) because it seemed to say that the AGW model-predicted-warming was being masked by nature, as if the model predicted warming confirms CO2 warming. THat’ll get a reply here every time. I don’t think that’s what you meant, but go back and read the comment right before you launch into “illogical…. wrongheaded” insults. Sorry, folks, either MR. .1 responds to Tillman’s comment or he’s out of line. One more try- what did Tillman say that was illogical or wrongheaded? Hope it doesn’t chase you off.
This is my comment, which was actually a reply to my own earlier comment (extending my remarks). It seems to stand on its own without regard to what anyone else said.
Beyond that, I reviewed Tillman’s reply to my very first comment. What he said is not remotely pertinent to what I said,..”six years is not a very long time..”
I’ll pick this up later because I think it’s important. Tillman’s repeated references to the post-war period of over 30 years is a direct response to “six years is not a very long time.” Pertinent. Ah, but hiliting the word “wrongheaded” is an answer??!!
Good comment, Paul. Right on the money.
I would agree, except one heat dome in NW North america proves AGW to the media
I’ll take 6 years over 3 days as an indicator any time.
Yes, me too. It seems the “it’s weather, not climate” people never seem to remember their own admonition. Every forest fire is proof of unprecedented “climate change”, but 6 years of cooling isn’t important … especially following 17 years of nothing.
Send in the Holy Trenders, they’re all needed PDQ.
They look like they are about to go full Sir Cyril Burt, and just pull stats from their nether regions.
Excellent post Larry, thanks
HIDE THE DECLINE!!!
The FDA was ordered by Pfizer to conceal Pfizer vaccine test results for 75 years.
( they havent succeeded so far)
Seems hiding is the standard modus operandi for globalists to push their agenda.
I’m as skeptical as they come, and I see a lot of very similar dips in that graph, always followed by an increase. I don’t see anything different about this one.
I think it’s wrong to focus on “average global” anything as a measure of climate. The NOAA USHCN network is advertised by them as “used to quantify national and regional-scale temperature changes in the contiguous United States (CONUS),” and “with sites selected according to their spatial coverage, record length, data completeness, and historical stability.” It shows, for example, that the June-July-August average temperatures have been flat or decreased in six of the 13 stations in Louisiana over the past 30 years.
Surely it has be significant that so many individual stations show the opposite of the “global average” trend.
“Surely it has be significant that so many individual stations show the opposite of the “global average” trend.”
That’s been my argument forever.
As an analogy: Let’s say you have 20 people and their average height is 5’9. Then you bring in a 6’5″ guy, the average suddenly goes up, even though only one data point was added. The original 20 didn’t suddenly get taller.
That’s why the AGW true believers are so obsessed with “weather extremes”.
Anyone with a scintilla of curiosity would wonder what the last chart, CO2 versus Climate agreements, means other than “Lets COP 27 and have a great time on an expense account!”.
With more of those drinks from the bar with the little parasols, as Dr. Mann would say.
Interesting to see if the vast volcanic eruption last week, in the pacific, causes a deep la nina or a bit of warming….
It might cool parts of the Southern Hemisphere up to half a degree C. Compare with Pinatubo in the NH:
https://pubs.usgs.gov/pinatubo/self/#:~:text=Effects%20on%20climate%20were%20an,the%20Earth%20in%201992%2D93.
Willis Eschenbach published a couple of articles here at WUWT:
Stacking Up Volcanoes
and
Spot The Volcano, 1815 Edition
It’ll be interesting to see if the Tonga eruption’s impact on weather conditions will be lost in the background noise as well.
The climatic effects of VEI 7 Tambora, VEI 6 Krakatoa and Pinatubo were global. VEI 6 Novarupta was at too high a latitude. Also, temperature in 1815 was already depressed by the 1808 mystery eruption. And of course, both were in the Dalton Minimum, last blast of LIA low solar power.
The two VEI 6 eruptions in Iceland in 1783-84 were also in the LIA, but not in one of its coolest cycles, like the Spoerer, Maunder and Dalton Minima.
“It’ll be interesting to see if the Tonga eruption’s impact on weather conditions will be lost in the background noise as well.”
That’s my guess.
Probably won’t have much effect as the caldera is now below the surface of the ocean. This will eliminate most of the emissions that would have gone into the atmosphere.
It was reported that there has been a second eruption from the Tonga volcano. I don’t know any more detail than that.
And Arctic sea ice (admittedly a meaningless gauge) is still in the top 2 for this date in the last 18 years.
It’s right on the average for 2001-10 and well above the 2011-2020 mean.
Arctic sea ice decline ended in 2012. No new, lower record in nine years is significant.
Sh ….. we’re not supposed to notice that. We don’t talk Arctic sea ice just now.
True to form, the Climate Liars will deny that this latest Pause, which is inarguably still young at this point, exists, or even, ever existed. But, as the Pause lengthens, they will go more and more into panic mode, making up “dog ate my global warming” excuses such as the classic “the heat is hiding in the oceans”.
Like clockwork.
If it lengthens
The point is, even if it doesn’t, the trend over the last 10,000 years is temperature dropping not rising and nothing that has happened since the end of the LIA is in anyway unprecedented, just as this dip came after a rise and will at some point probably be replaced by another rise so has the whole Holocene gone but the inevitable trend is down not up and reglaciating is the end game not run away global warming.
Jus looking at the NOAA CO2 graph and wonderin…
It is that the man Hottel (and Leckner) took a minor detour in their work recording emissivities of gases (the ones found inside heat engines of all sorts, boilers, stoves, heat exchangers etc) and took a measurement of the emissivity of CO2 as it existed in the atmosphere at that time viz: 1954 and 340ppm
So why does the NOAA graph tell us that CO2 only reached 340ppm in about 1980 and that in the mid 50’s would have been about 310ppm (just eyeballing the graph)
What gives – is the temperature graph not the only thing that’s being adjusted?
<Giggles> Where does that leave Weepy Bill and his ‘350.org?
I still haven’t figured out why we take ONE CO2 reading from an island in the middle of the largest ocean on Earth and use it for the entire planet.
It’s like taking the temperature in the middle of the Amazon rain forest and using that for the Earth’s global temperature. Why aren’t we sampling CO2 at every place we take temperatures?
There’s also a CO2 gauge in Tasmania.
Scripps Institution of Oceanography uses 11 CO2 monitoring sites in its air-sampling network, from the South Pole to Alert, Nunavut at 83 degrees 30′ N. Six are on Pacific Islands, including NZ, with two on Hawaii. Two lie in CA and Baja, and another on Alaska’s Arctic coast.
There are many CO2 measurement stations around the world which are in basic agreement with each other. Also the OCO satellites.
The problem with measuring CO2 near where people live is that people emit CO2 and this can drastically impact what you are measuring based on the time of day, time of year, which direction the wind is blowing, whether it’s raining or not, etc.
The advantage to measuring CO2 in the middle of the ocean is that as long as you take your measurements when the winds are coming off of the ocean, there are no nearby sources of CO2 to contaminate your readings.
As the OCO satellite showed CO2 is a well mixed gas, it only varies a few parts per million as you go around the planet. So as long as you avoid contamination from nearby sources, a single site will track any global trends.
Secondly, as others have pointed out, we don’t takes CO2 readings from just one source.
Warming and cooling operate on regular cycles, so I don’t think it’s significant when warming is evident, any more than when cooling is evident. What seems rather clear is that the miniscule warming experienced since the warmunists’ favorite reference year of 1850 – the year that the Little Ice Age ended – is really nothing very significant all all .. and most of the industrial emissions that we have to day did not exist until at least the mid-20th century, with the vast expansion in worldwide economic activity following the two world wars and the Great Depression, and the vast expansion of motor vehicles around the world.
In any case, what little warming we’ve seen in the last 172 years is a good thing, not a bad thing. Always has been, always will be.
Just to put things in perspective, total CO2 emissions worldwide in 2020 are approximately 7 times the total worldwide CO2 emissions in 1945 when WW Two ended. And for the next 35 years after 1945, as those CO2 emissions skyrocketed, the planet experienced a cooling phase.
CliSciFi uses aerosols to paper over that problem, Duane. It worked in giving them high ECSs for their late 20th Century model tuning period. With the 21st Century pause, it blew up their models and Gavin The Liar had to admit their models ran hot. The politicians/bureaucrats writing the UN IPCC CliSciFi AR6, however, still have “even higher confidence” in the essentially falsified models. It will be fun watching people pick apart AR6 over the next few years.
“And for the next 35 years after 1945, as those CO2 emissions skyrocketed, the planet experienced a cooling phase.”
That would make one tend to think that CO2 doesn’t have much to do with atmospheric temperatures. CO2 goes up, Temperatures go down. Alarmists say if CO2 concentrations increase then the temperatures increase, but that didn’t happen for decades from 1940 to 1980.
Warming and cooling don’t operate on regular cycles, and that is the real problem. You can pick a portion of the data set and say ‘look! a cycle’ – move out from that an there is no cycle.
Just because the only easy maths we have deals with cycles, doesn’t mean that what is happening.
Climate is sufficiently complex that it will behave an a fully pseudo random chaotic way.
Looking for trends is about as relaible as a run of luck in Las Vegas.
Climate is quasi-cyclic on various time scales, on orders of magnitude from decades to 100 million years.. I wouldn’t call them all regular, although some are.
Milankovitch cycles occur on the order of ten to 100 thousand years. Since the end of the Holocene Climate Optimum, warm period peaks have happened about every millennium, with each less warm than the previous, since the Minoan WP about 3000 years ago. Cooler intervals have followed each WP, as with the LIA after the Medieval WP.
Within these warmer and cooler centennial-scale secular trends lie multidecadal countertrend cycles. The early 20th century warm cycle in the Modern WP was followed by the postwar cool cycle, ended with the PDO shift of 1977. Hence, the global cooling scare of the ’70s. Then came the late 20th century warm cycle.
Weather and climate surely containchaotic elements, but cycles exist. Just look at glaciations in the past 2.6 million years, and the apparent shift in their duration some 1.2 Ma.
Even over far shorter timescales than what you describe, the cycles in warming and cooling actually still are quite regular. The past century we’ve seen regular cycles of approx. 30-40 years each of warming (beginning of 20th century ending in the late 1930s), another 30 years of cooling (1940s to 1970s) then another cycle of warming (1980s to 2010s). We are presently in a relatively flat period, probably headed into a cooling cycle of several decades length.
On still longer timescales, we’ve seen larger scale warming and cooling periods ranging from the first six centuries of the last two millenia being cool, then the next 7-8 centuries being warmer (ending in the 16th century), then the Little Ice Age from the 16th century to the 19th century. The cycles don’t have the same precise lengths, but they are regular in that they keep flip flopping back and forth to the same magnitude with timescales measured in multiple centuries. That is surely “regular”.
I did mention some multidecadal cycles, same as those you cite.
I guess it depends upon what “regular” means.
Yes, they do operate on regular cycles, just as glaciations operate on regular cycles. That does not mean they period of each cycle is precisely the same – almost nothing in nature works in that way. But the cycles are clearly regular, as the periodicity is within the 95% confidence interval of such periodicities.
So NOAA claims uncertainty over the ocean as +/-0.16dgC. Then they add more measurements to the calculation (i.e. the land values) but come up with a lower measurement uncertainty of +/-0.15dgC. Sure.
It is, at least to me, unexpected that the uncertainty for ocean temperatures is larger than for land temperatures. It is counter intuitive to the mental image of a Pacific island having a constant 21 deg C temp’ all year round, versus Atlanta (GA), infamous for its hot, humid Summers, which just got snowed on.
The tropics may have a more or less constant temperature year around, but as you get away from the equator, the yearly variation increases by quite a bit.
The tropics have quite a lot of seasonal and even daily temperature fluctuations. The nearer to the equator you are, the less variation.
The main factor is the exposure to the sea. An island, even one close to land, experiences far less variation. In tropical outback Australia, for example, the variation can be huge.
That was the point I was trying to make that MarkW disagreed with.
This is interesting. Several of our local alarmists recently claimed that anyone who doubted that we could measure the temperature of the oceans to 0.001C was a science denier and mathematically illiterate to boot.
NOAA makes extensive temperature anomaly measurement updates every month where large numbers of prior temperatures are changed again and again. For example, NOAA’s August 2021 temperature anomaly update compared to NOAA’s November 2021 temperature anomaly update shows that in the period between 1954 and 2021 over 250 monthly anomaly temperatures were increased always by +0.01 degrees C with about half of these upward adjustments made in the 1992 to 2021 period
_________________________________________________________________________
NASA not NOAA publishes their Land Ocean Temperature Index monthly, and every month they make hundreds of changes all the way back to January 1880. Here are the number of changes made in 2021:
<pre>
Jan Feb Mar Apr May Jun Jul Aug Sep Oct Nov Dec
330 468 338 256 497 348 267 217 285 291 375 277
</pre>
Here are all those changes for the last ten years:
…GISS Surface Temperature Analysis (GISTEMP v4)The GISS Surface Temperature Analysis ver. 4 (GISTEMP v4) is an estimate of global surface temperature change. Graphs and tables are updated around the middle of every month using current data files from NOAA GHCN v4 (meteorological stations) and ERSST v5 (ocean areas), combined as described in our publications Hansen et al. (2010) and Lenssen et al. (2019). These updated files incorporate reports for the previous month and also late reports and corrections for earlier months…
Either they take NOAA or fiddle it. What’s going on?
What’s going on?
________________________________________________________
Our wonderful news media often quotes NASA. Does is matter if they just copy NOAA or fiddle with it? Who knows? The monthly NASA LOTI files are replaced every month and most aren’t retrievable on the Internet Archives Wayback Machine. I’ve been told that NASA blocks the WayBack Machine, but somehow a few are captured. If you want a complete file you have to religiously save them every month.
Just drop the anomalies and report global mean temperatures in Kelvin for each year. Doing it that way takes away all alarmism. The temperature is steady at 286-287K, all the way.
Now the Warmistas have a new excuse, the Tonga-Hunga-whatever eruption VEI 5, will be used to explain a pause in temperature rise. Ignore the previous data, naturally.
They seem to be ploughing an altogether different furrow to the one you suggest
“It produced an ash cloud spanning hundreds of square kilometres – but scientists say it’s unlikely Hunga-Tonga’s big blow will put any dent in global warming.
No, Hunga-Tonga eruption won’t slow global warming”
https://www.nzherald.co.nz/nz/no-hunga-tonga-eruption-wont-slow-global-warming/MWLPEPNRN4VRRSLRAB6OR6QT7E/
“No, Hunga-Tonga eruption won’t slow global warming”
Correct, because it already slowed and reversed
It’s giving us some awesome sunrises here in Oz, though.
They do have some merits, but the marvellous thing about temperature anomalies is that you can arrange to have them forever going upwards. It just needs some appropriate “adjustments” up in the present, and later down, when nobody is looking.
While an absolute temperature value will quickly transport you in to clearly unbelievable ridiculous numbers as the cumulative sum rises, any funny business can be continuously swept under the carpet by using anomalies as long as nobody takes the trouble to perform the arithmetic checks on the whole record.
Right now, the basic algorithm for anomalies is “get the average temp of a station for each month over the 30-year period X”. Then it’s “subtract the mean XJan from the current year’s mean temp for Jan to get the anomaly.”
What would it look like if you took the baseline for ALL of the stations used in the calculation and got the mean of each month’s as a global baseline, and then subtracted that from each station’s average for a month?
Clearly have to dumb this down to the level “climate scientists” can understand. CO2 good. “Climate scientist”s stupid.
There also seems to be a growing arson trend by leftists, e.g. below, there are many.
https://www.mercurynews.com/2021/11/18/former-santa-clara-university-professor-indicted-on-arson-charges-in-connection-with-dixie-fire/
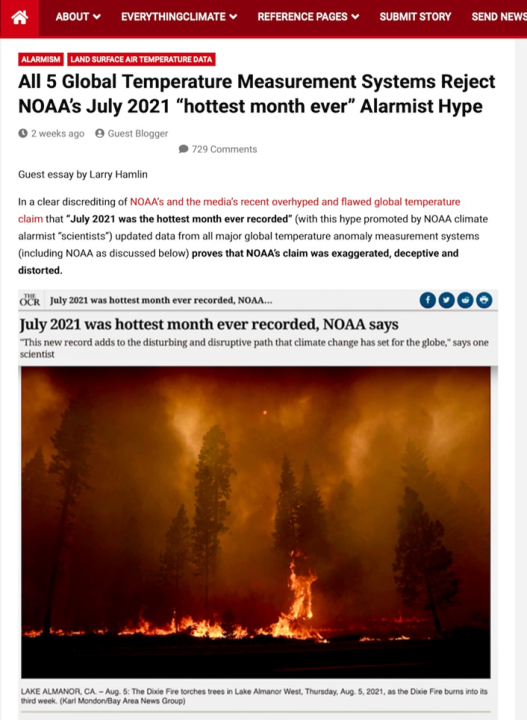
I wonder if NOAA’s use of pictures of wildfires within their propaganda pieces might induce arsonists to act out on their fantasies.
That’s XR’s strategy – turn alarm into hysteria. Some will flip.
If a crisis atmosphere is created over climate change, or anything else, this will agitate some of the violent psychos in our society to take violent action. The crisis atmosphere gives the violent psycho permission, in his mind, to act out his violent tendencies.
CO2 advocates say that incoming radiation from the sun is blocked to a small extent by CO2 and then at night the outgoing radiation is blocked by a larger amount resulting in warming. The claim is CO2 is acting like a one way valve due to the different frequencies of IR during the day and night….more energy is blocked at night than during the day because the frequency range is different? Is that the scenario claimed by the CO2 warmists?
Looks like their model has not just feed-backs, resonances, impedences, but now diodes.
Shades of a Radio Shack kit!
That is not correct. Incoming short wave solar radiation is not absorbed by CO2 in the atmosphere. If’s only the long wave radiation coming from the earth’s surface that is absorbed by CO2.
That is also not correct : here is the correct spectrum from someone qualified, Dr. Happer .
No difference if CO2 doubles from now. It is called saturation.
So on your chart, please identify where the incoming solar radiation lies.
The point is, doubling today’s CO2 from 400ppm to 800ppm can have no observable effect whatsoever. The process is saturated.
Dr. Happer’s latest video is here, not too technical :
CLINTEL lecture William Happer in Amsterdam12,630 views Dec 3, 2021
Absorbed downwelling SW solar radiation is more climatically important than upwelling LW, according to Warmunista models:
Shortwave and longwave radiative contributions to global warming under increasing CO2
https://www.pnas.org/content/111/47/16700
The highest energy UV for instance makes and breaks ozone.
And to think of it , all that O2 is from photosynthesis, the biosphere, since the Great Oxygen Event. It is as if life set up a UV shield so it could move to land….
Weird?
Infrared of some frequencies definitely comes in from the sun…you feel it on your skin. If it was the same frequencies and amount that is radiated outwards at night, the net difference between night and day would be zero. Warmists appear to be saying that less IR is blocked during the day than at night due to frequency differences and thus there is a net positive amount of heat retained. In other words, CO2 reflects away to space a smaller amount of heat during the day than it reflects back to earth during the night. Of course next is the matter of doubling CO2 will not double the reflective effect…it is logarithmic – not linear….and there is the matter of saturation.
Here is a fairly good chart showing the relationship between incoming solar radiation (shortwave) and outgoing IR (longwave). The warmth you feel from the sun is the shortwave radiation being absorbed by your skin and converted to heat. It is not IR. You can see how little overlap there is between the incoming shortwave and outgoing longwave. CO2 absorption is almost all well out of the incoming solar radiation wavelength. It is the longwave being radiated from the earth’s surface (warmed by the incoming shortwave, just like your skin) that CO2 can absorb and reradiate. That right there, is the greenhouse effect. If it were not for CO2 and water vapor and a few other GHG’s, that longwave stuff would go straight to outer space, and the earth would be dramatically colder. I put a red dot on the chart to show where some of the incoming shortwave is absorbed before it reaches the earth’s surface.
I stand behind a double pane window and feel the sun’s heat…no UV goes through a double pane glass. What are you calling short wave?
That is from Dr. Happer’s video linked above. Now look at his other spectrum – doubling CO2 from today’s 400ppm can have no measurable effect. The process is saturated. One can argue day and night about individual photon energies.
The other side of the coin is that 2021 was the coolest year in the last 6 years.
The temperature anomaly table at the beginning of the article clearly demonstrates that NOAA (and NASA) are not justified in reporting anomaly temperatures to two significant figures to the right of the decimal point (0.0X). The graph shows the land temperature anomaly as being “+1.35 +/-0.14” deg C. because of the size of the uncertainty, the “3” in the nominal value is the last significant figure. Thus, reported properly, it should be rounded to +1.4 +/-0.1. The digits in the hundredths position are meaningless. They suggest to the layman that the anomalies are known very precisely. That is misrepresentation. Whether it is incompetence or malfeasance is impossible to know. However, I’d put my money on malfeasance.
“The digits in the hundredths position are meaningless. They suggest to the layman that the anomalies are known very precisely. That is misrepresentation. Whether it is incompetence or malfeasance is impossible to know. However, I’d put my money on malfeasance.”
Me, too.
Absolutely. The behavior of the apologists in WUWT bears this out.
What CO2 does, how and how much is whose fault is debating how many angels can dance on the head of a pin.
There is no greenhouse effect!
The Earth is cooler with the atmosphere not warmer. Stand in front of a blazing campfire. Hold up a large mylar space blanket. Are you warmer now or colder? The fire (sun) warms you & you (surface) warms the surrounding air. That’s what the atmosphere does and a greenhouse it’s not.
Per the K-T atmospheric energy balance graphic as well as numerous clones the GHGs must do their thang with “extra” energy upwelling from a surface radiating LWIR as a black body. These graphical representations contain egregious math and physics errors. See https://youtu.be/0Jijw7-YG-U
As demonstrated by experiment the terrestrial surface cannot independently upwell LWIR as a black body. For the experimental write up see:
https://principia-scientific.org/debunking-the-greenhouse-gas-theory-with-a-boiling-water-pot/
There is no greenhouse effect.
The so-called GHGs do not actually do anything.
Mankind’s CO2 does not drive global warming or climate change.
How/why am I wrong?
Stay on topic and bring science!
Uh, during a summer day the temp reaches 90F and the sun heats my concrete driveway. At night, I can feel the IR from the concrete radiating back towards space. The warmists say that earth IR is different in frequencies that are affected by CO2 than the IR provided by the sun during the day and thus CO2 is able to block more of the night time IR…..hence net warming of the atmosphere ….a net plus in heat. In the USA, that is when the increased temps are recorded…it does not cool as much during night hours as in the past…day temps are not much changed.
You have combined some truths with some questionable claims. For example, saying “GHGs do not actually do anything” is a bit too much. They absorb and emit IR radiation.
Without GHGs in the atmosphere, there would be no radiation to space. It is this cooling of the atmosphere that permits the flow of energy from the surface that energizes the molecules within the atmosphere.
I think what you meant to say is that downwelling IR (often referred to as the greenhouse effect) is basically irrelevant. That is true. The only way to understand the flow of energy through the atmosphere is to look at the average flux. Turns out when this is done we see an upward flow. Adding more CO2 will simple provide more molecules assisting in the upward flow. As long as no more energy is involved, there will be no warming.
”Without GHGs in the atmosphere, there would be no radiation to space.”
Is that true? Eg., if we parked a planet with an atmosphere of pure argon near the sun it would continue to heat up and explode?
No, I was referring to the atmosphere. Your hypothetical planet would radiate energy from the surface.
“However, all these politically contrived climate alarmist driven COP cabals that commenced in the 1990s have a spectacular track record of failure as noted above.”
Depends on how you define failure. Billions of person miles flown, endless good meals and drinks, COp could very well be considered one of the most successful processes on earth
In the long term, the stock market only goes up, but for days, weeks, months, or even years, it can do little or nothing or go down. It is analogous to how global warming would happen.
You mean to say that global warming index keepers routinely kick poor performing temperature profiles off their index and add new better performing ones on a routine basis just as stock market index keepers do?
Because if that is your analogy, you need a better one.
Tom. 1
the Long term in the climate system though is the opposite, it is down not up and has been since optimum.
We haven’t come close to experiencing the long term when comes to climate. You were right above that the current pause/drop in global temperature has little meaning. In order to understand short term climate changes one needs to know ALL the factors involved. The alarmists are great for ignoring everything but GHGs. Skeptics aren’t all that good either.
A good example is the recent findings where the CERES mission has discovered a significant cloud thinning. This has allowed a significant amount of solar energy to reach the surface. Obviously, the alarmists and entire field of climate science are in denial.
https://www.mdpi.com/2073-4433/12/10/1297/htm
This data explain the first pause, the ending of that pause and the current pause. It also explains the warming in the late 20th century. No need for any greenhouse warming at all. That doesn’t mean there is no greenhouse effect, but it appears CO2 increases can not be very significant.
Richard, “Skeptics aren’t all that good either.” No matter how stupid and illogical a “skeptic” is, they are still good enough to get the big picture right. This is something that cannot be said about even the smartest Alarmists.
Just *being* skeptical is good. 🙂
Lol
Actually the stock market crashes dramatically, rather like the Ice Age ending. The Little Ice Age took from 1700 to now to slowly warm up. Different time scales though….
And then there is the lower 48 Climate Reference Network showing no change since the network was first placed in service in 2005.