Guest essay by Larry Hamlin
In a prior article I had already concluded that none of the 5 major global temperature anomaly measurement systems (UAH, RSS, GISS, HadCRUT5 and NOAA) agreed that July 2021 was the “hottest month ever” as falsely hyped by AP climate alarmist writer Seth Borenstein and as erroneously promoted by climate alarmist “scientists” at NOAA.

This result was particularly significant and embarrassing for NOAA since its global temperature anomaly for July 2021 was reduced in value as a part of its August temperature update posting from their prior “hottest month ever” claim which meant that the July 2021 anomaly was tied with the year 2019 anomaly and clearly not the “hottest month ever” that was so overhyped and scientifically misrepresented by NOAA and the climate alarmist media.
Some comments on the WUWT article noted that the HadCRUT5 measurement system had not yet updated its official data record for July 2021. At the time of prior article HadCRUT5 was two months behind the other 4 global monthly temperature anomaly systems which had already reported monthly anomaly data updates for both July and August 2021.
The HadCRUT5 monthly global temperature anomaly data records for years 2020 and 2021 are shown below.
Each of the HadCRUT5 years 2020 and 2021 data start with January then February, March etc. The 2021 bold type values reflect the latest HadCRUT5 data for July and August 2021 just released today (9/30/2021).
2020 1.069, 1.113, 1.094, 1.063, 0.908, 0.825, 0.816, 0.801, 0.867, 0.811, 1.013, 0.693 Average 0.923
2021 0.701, 0.565, 0.726, 0.760, 0.706, 0.712, 0.793, 0.796
UK Met Office HadCRUT5 updated data for the months of July and August 2021 as expected confirm that the HadCRUT5 highest monthly July anomaly occurred in 2019 at 0.857 C confirming and establishing that NOAA’s prior flawed claim that July 2021 was the “hottest month ever” was nothing but climate alarmist propaganda that is unsupported by all 5 monthly global temperature anomaly system measurements including NOAA.
I eagerly await the climate alarmist media’s articles retracting the “hottest month ever” propaganda debacle.
Rather than admit they made a mistake, it’s more likely that the data will be ‘cleaned up’ and poof! as if by magic, they will be right…..
> I eagerly await the climate alarmist media’s articles retracting the “hottest month ever” propaganda debacle.
Yeah. I don’t think I’m going to hold my breath waiting for them to admit they’re wrong…
Please do not hold your breath waiting for those retractions. If they appear, you might need a magnifying glass to find/read them.
Modern press.
BTW … NOAA did the same thing with exaggerated temperature claims when they said September 2020 was the hottest ever — and then altered the data without retraction … https://www.noaa.gov/news/earth-just-had-its-hottest-september-on-record
You’re right. They should have retracted. 2020 is in a four-way tie with 2015, 2016 and 2019 for ‘the warmest September on record’. Another way of looking at it is that the 4 warmest Septembers globally (with 2021 yet to report) all occurred in the last few years. Cold comfort (pardon pun).
If your error bars are reasonable, like +/-1 degree….it’s been a tie for a couple of centuries or so.
It’s not so much if any or all of these are hottest on record, it’s the HYPE!!!!
The reality is that nothing has changed, that’s the scientifically meaningful take-away. If NOAA’s public face was honest they would note that we’re on the warm side of the last 30 years but the trend line is much ado about nothing. Instead they present this as if it’s a runaway train
If you look at the actual temperatures as recorded at the time – rather than the ones which have been modified by climactivists who have Reduced the recorded temperatures of the early 20th Century on multiple occasions (each time lower than their previous reduction) – you will find that recent years’ “Record Temperatures” are nothing out of the ordinary and struggle to reach, let alone surpass temperatures recorded 80 and more years ago.
No wonder they don’t like talking about anything more than 30-40 years ago.
Even Ted Cruz knew that back in 2015 when he used graphs produced to Tony Heller showing how NOAA systematically altered USHCN data to fraudulently exaggerate a warming trend … https://www.climatechangenews.com/2021/09/30/ted-cruz-blocking-us-ambassadors-climate-diplomacy-suffers/
If CO2 truly did dictate global temperatures, every year would be a record. It is obvious the temperature trend has flattened. I had hoped the mild upward temperature trend from the Little Ice Age would continue. Long-term records show there has been no impact of that minor warming on adverse weather events. Cold kills.
I am pleased that you provide a distinction between “the warmest ever”, & the “warmest on record”, two very different & distinct descriptions!!! We know the Earth’s climate has been much warmer in the geological past than today, not withstanding the Medieval Warm Period!!!
Maybe NOAA has a new data editor on staff (Bill Nye) …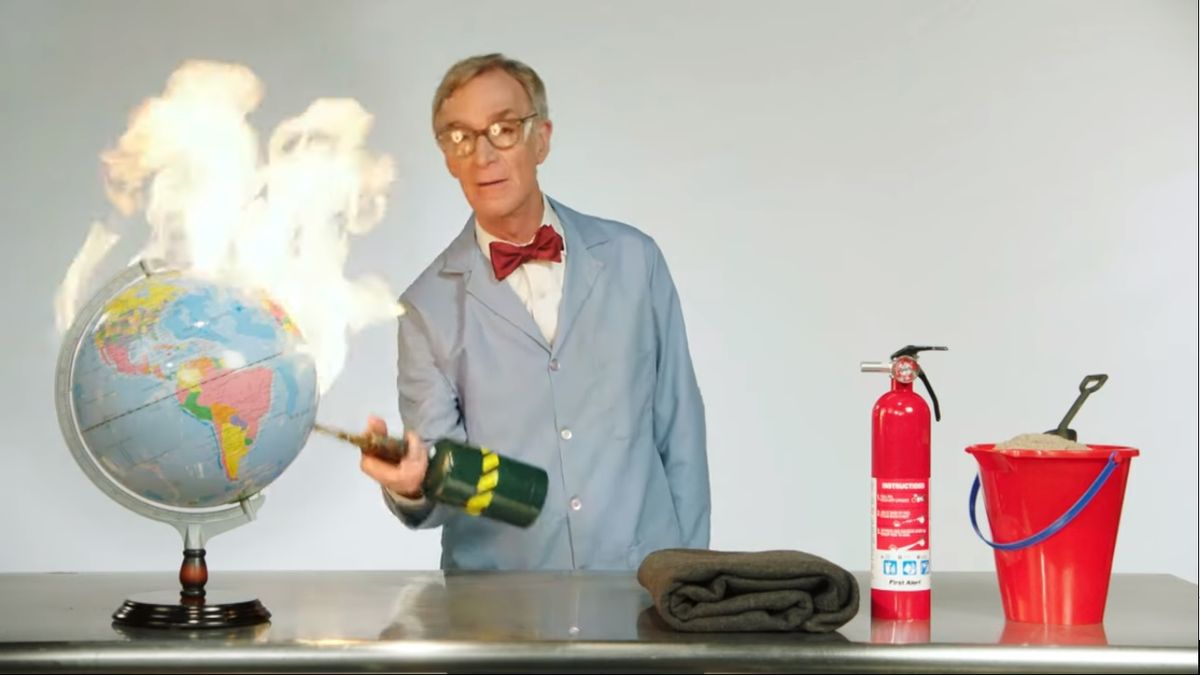
The Con Man Guy for Hire
How many stations does HadCRUT use in Antarctica? South Pole, plus research sites on the coasts? Its interior was unusually cold in July. Antarctic sea ice that month was the third or fourth highest in the dedicated satellite record. August was third highest, after 2013 and 2014.
We really should separate climate, weather, and the irregular but recurring anomalies.
n.n,
You suppose to know or consider, that you made a huge or grievous mistake when considering the value or a value of merit of WUWT… it will hunt you,
not ever like any one of else before there ever …
It is off… off the stability of acceptances…
☠
Its this sort of stuff, that I would read in the comments of stories from the Australian Broadcasting Corporation, that started me on the path to scepticism. They tended to be heavy handed with moderation but harassment like this was acceptable. It set of every warning alarm. Time to think for yourself.
Imagine Dragons – Believer…
I am glad you could understand Whiten enough to reply. Methinks the wacky tobacky has muddled its speech center.
I’m not sure that I did.
Descriptive statistics, like mean temperatures, cannot be separated from weather data. In fact, forms of systems that are cyclical in short and long term spans are not necessarily best described by the mean of the data.
In dry climates, there can be a 6C difference between the ground and 6ft up. Frost damage in a vineyard is usually the lowest area but I’ve had the slightly higher ground be damaged while that in the hollow remain undamaged. Little things make such a large difference.
You can get more than a degree difference averaging 24 hours of 10 min readings than the average of min and max temperatures. Both are not averages of an intensive property because its not the same body of atmosphere over the site for the readings. If you were merely averaging a good record, you could assume that many readings still provide an indicator of climate change, but they reconstruct something to average. That it’s similar to satellite measurements just fills with doubt to the sincerity of the attempt.
NCDC’s revision did indeed tie July 2021 with July 2019. Together they place 8 of the last 10 Julys inside the top 10 warmest on record globally.
And for those who claim that NCDC deliberatly manipulate figures towards warming – how come they reduced the latest value this time? Why would they do that?
There are more people watching their misdeeds and independent review of their claims. They can no longer lie without being called to the carpet. Unfortunately they wont fix their BS claims unless they are forced into it. The error bars also are multiple times greater than the claimed warming, and in Science that is suppose to be disclosed and eliminates such fraudulent claims in the first place. NOAA needs to report the data and STFU about the rest.
ToeFungalNail, NOAA reduced their number for July because they got caught in a lie. Their own data covering every month (not just July) showed that their July-only data had been fudged. The fact that they didn’t issue a statement saying that Seth Borenstein and his ilk had reported on false data and that the error in their data doesn’t support any claim that they confidently know that recent month has been hotter than another recent month should clue you in on NOAA’s agenda.
Exactly what data are you talking about? What is the before and after?
Once July 2021 is in the past it must be cooled in order to claim new records.
Warm the present, cool the past.
So the results are in, and for the surface datasets the warmest July was
NOAA 2019/2021 tied.
NASA 2019/2021 tied.
HADCRUT 2019 – (2021 came in a whole six hundredths of a degree cooler).
Alert the media immediately..
Mr. Phillips: Alert them so they can retract the latest “hottest evah” headlines? At the rate we’re going, we’ll soon be making jokes like, “NOAA pretends it’s the hottest ever, and we pretend that heat makes us shiver and turn blue.” Russian humor, adjusted.
I liike that rephrasing!
Reporting data with two digits after the decimal that have realistic uncertainty limits on the order of ±1°C is deceptive and dishonest.
Actually, Hamlin is showing 3 digits to the right of the decimal point! What is their claimed uncertainty? The implied 0.0005 degrees C?
it is really meaningless!
Plot that against the anomaly baseline temperature. You couldn’t separate the lines!
And, unethical! Not including a variance from the real temperature data is also scamming everyone. The variance of the real data is hidden by anomalies. If Kansas was at 95° F and Argentinia was at 30° F what do you think the variance of a mean is? The variance is supposed to tell you how well the mean represents the data. It can’t t be doing that very well!
The variances are easy to calculate. For example, the variance of the global mean temperature via UAH on a monthly basis over the period of record is 0.06C. The spatial variance on the 2.5 degree lat/lon gridded data for 2020 was 1.08C with January being 0.84C, July being 1.01C, the max being 1.70C in March, and the min being 0.57C in June.
Variance of the *MEAN* is not the same thing as the variance of the data population itself.
When the uncertainty of the underlying data is more than +/- 0.6C then how does the uncertainty of the value for the mean become less? Variances add when you combine independent, random data populations. Variance and uncertainty are quite similar so if you add variances then why don’t you add uncertainties?
How precisely you calculate the mean is *not* the same thing as the uncertainty associated with the value you have calculated.
If the mean value for two independent, random values works out to be a repeating decimal, i.e. infinitely precise, does that mean there is no uncertainty transferred from the two data points to the mean?
Every figure you quoted involve anomalies. What did I say?
Perhaps you could be so knowledgeable as to quote the variance of the “real data”, i.e., recorded and measured temperatures.
That is the population of real data, not a calculated metric such as anomaly.
You and other warmists have hitched your wagon to a horse that has no meaning in the real world. Anomalies define no specific location on the globe. The globe has a mix of temperatures, not a mix of anomalies. If you live where a massive number of people live, in temperate zones, a few degrees of warming will be appreciated. It will basically move us closer to the equator by a few hundred miles. It is common knowledge that areas close to the equator will not experience much of “global warming”, so they really don’t care.
If you want to do something worthwhile, take the anomalies and determine the local and regional areas that will experience the warming changes you predict and then find the same for cooling areas. Then tell us here what you find.
Otherwise, you are prognosticating the same thing as many warmists, everywhere is going to warm identically! How many studies must we see where changes that are occurring assume this? If you’re really into the CO2/warming theory, you should also be interested in destroying this myth!
ERA5 has hourly grids with absolute temperatures in units of K.
You are confusing accuracy and precision. You can have precise estimates of temperature changes between years from thousands of measurements even if the absolute accuracy is no better than 1 or 2 deg C.
“You can have precise estimates of temperature changes between years from thousands of measurements even if the absolute accuracy is no better than 1 or 2 deg C.”
Huh? How do you compare annual means if you don’t know how accurate they are? It doesn’t matter how precisely you calculate last year’s mean and this years mean. If the accuracy of those means is in question then so are any comparisons made using those means.
Do you consider a repeating decimal to be infinitely precise? If last year’s mean and this year’s mean both turn out to be repeating decimals does that mean you can calculate their difference to any decimal place you wish? Does that comparison out to ten decimal places actually mean anything useful?
No. You can have mathematically precise calculations but because these are multiplying data error ranges together (reading/measurement or instrument error) from the initial measurements then they will always be fundamentally flawed. What you are trying to do is separate the data from the derived numbers which is frankly a dishonest and entirely manipulative thing to do. The derived calculations are the data and to imply that they are separate entities and subject to different standards simply will not wash.
You only have one data set. Even if it was just a simple mean of the data, you don’t report a precision much better than &plusmin; a quarter of the resolution of the measurements, in every other area of science. Then there is the error introduced because its not a simple mean. Not really hard to estimate how much uncertainty for that particular reconstruction. Randomly separate the data and do the analysis on the two sets, a number of times. I’m guessing that the SD will one picoKelvin which would make it less trustworthy.
And this doesn’t even begin to address the folly of comparing snapshots in time of a time varying function! It’s all flawed from the very beginning – uncertainty issues and non-stationary data.
Are temperature changes in the Arctic equivalent to temperature changes at the Equator? If temperature changes faster in the Arctic, can you equate those faster changes to the slower changes at the Equator? If your analysis of precision depends on changes, not the accuracy of the equipment, would not the changes have to be consistent?
I really don’t know. Are there any competent statisticians out there?
Can you post a link to a publication supporting your claim that the uncertainty on the monthly NOAA, NASA, and Hadley dataset is ±1C?
Also, assuming the uncertainty really is ±1C what is the probability that any 2 of the 3 datasets would differ by no more than 0.05C for monthly values?
I’d also wonder why you never see changes in a single data set of around 1°C month to month.
The uncertainty is determined by the measurement device, period. That uncertainty carries through any and all calculations you may perform on that measurement. Here is a quote from Washington Univ at St. Louis.(bold by me)
http://www.chemistry.wustl.edu/~coursedev/Online%20tutorials/SigFigs.htm
This simple rule is not followed by climate science. Averaging, converting into anomalies, or finding the “error of the sample mean” does not change the admonition to “use them properly throughout your scientific career”. When you say you can add digits of precision through calculations such as using statistical means you are ignoring what the measurements actually represent.
I have other references from organizations such as a laboratory at John Hopkins that reiterates the same thing. Don’t try to fool an engineer whose training was to be careful of measurements and what you could assure people of. There is no way I would use an instrument that reads only to integer values and through taking measurements of different things with different but similar devices and say I can calculate out to the 1/100th or 1/1000th decimals digits what the true measurement actually is. Likewise I would not attempt to snow someone by quoting a mean without also quoting the variance of the original measurements.
Can you post a link to a publication supporting Carlo Monte’s claim that the uncertainty on the monthly NOAA, NASA, and Hadley dataset is ±1C?
Also, assuming the uncertainty really is ±1C what is the probability that any 2 of the 3 datasets would differ by no more than 0.05C for monthly values?
Google the Federal Meteorological Handbook No. 1. Go to Page C2. Look at Table C5.
Table C-5. Temperature and Dew Point Sensor Accuracy and Resolution (Co )
For -50C to +50C the standard is +/- 0.6C.
“what is the probability that any 2 of the 3 datasets would differ by no more than 0.05C for monthly values?”
Uncertainty is not a probability distribution. There is no “chance” associated with uncertainty, only an uncertainty interval. With a stated +/- 0.6C uncertainty exactly how do you identify a 0.05C difference?
I didn’t ask about the uncertainty of individual temperatures. I asked about the uncertainty of monthly global mean temperatures. I’ll ask the question again…Can you post a link to a publication supporting Carlo Monte’s claim that the uncertainty on the monthly NOAA, NASA, and Hadley dataset is ±1C?
Uncertainty definitely can be a probability distribution (see the GUM). And in the context of global mean temperature estimates it is always given as a standard uncertainty at either 1σ or more commonly 2σ. I’ll ask the question again with a clarification this time…assuming the uncertainty really is ±1C (that is 2σ) what is the probability that any 2 of the 3 datasets would differ by no more than 0.05C for monthly values?
“I asked about the uncertainty of monthly global mean temperatures.”
The uncertainty associated with monthly global mean temperatures is propagated from the individual temperatures to the mean itself.
You are confusing how precisely you can calculate the mean, which is based on the number of samples, with how accurate that mean is.
I’ll reiterate something you’ve always refused to address: If you have a monthly mean that is an endlessly repeating decimal then it is supposedly infinitely precise as well. Does that imply there is no doubt associated with that mean as to whether it is a true value of something?
“ I’ll ask the question again…Can you post a link to a publication supporting Carlo Monte’s claim that the uncertainty on the monthly NOAA, NASA, and Hadley dataset is ±1C?”
I’ll repeat again, if the uncertainty of the base components of the data set is +/- u then the uncertainty of any calculation using those components simply can’t be less that the uncertainty of the base components. How precisely you calculate the mean, i.e. how much you narrow the standard deviation of the mean, has nothing to do with the accuracy of that mean. The accuracy of that mean is limited by the accuracy of the individual components making up that mean.
When you combine individual, random variables you add their variances, meaning the variances *always* increase. You can argue about the method of adding those variances but you can’t ignore the fact that they add.
Uncertainty from individual, random measurements do the same, those uncertainty intervals closely resemble variances. It doesn’t matter how precisely you calculate the mean associated with those combined independent, random variables, their variances always increase. Since there is no probability distribution defined by uncertainty the true value can lie anywhere in the uncertainty interval (i.e. variance) of the combined individual, random populations.
Therefore trying to identify differences that are smaller than the uncertainty interval is a fool’s errand. You simply do not know.
If the uncertainty interval for the individual components of the monthly mean is +/- 0.6C then the uncertainty interval for the mean itself *must* be larger than +/- 0.6C. While +/- 1C doesn’t follow from standard propagation of uncertainty, it isn’t an unreasonable assumption to start from.
CAN YOU PROVIDE A LINK TO A PUBLICATION SUPPORTING THE FACT THAT VARIANCES OF COMBINED RANDOM, INDEPENDENT VARIABLES DO NOT ADD?
“Uncertainty definitely can be a probability distribution (see the GUM).”
This is only true for individual, random measurements of the SAME THING! Those measurements form a probability distribution around a true value. For individual, random measurements of DIFFERENT THINGS, there is no formation of a probability distribution. There is no true value for a conglomeration of individual, random measurements of different things. There is simply no guarantee that the mean of individual, random measurements of different things even exists in reality, therefore it does *not* represent a true value for true values *must* exist in reality.
“And in the context of global mean temperature estimates it is always given as a standard uncertainty at either 1σ or more commonly 2σ.”
That is for the standard deviation of the mean, i.e. how precisely you can calculate the mean. It is *not* the uncertainty associated with the mean itself. For that would imply that variances of individual, random components DO NOT ADD when they are combined.
Repeat to yourself 1000 times: “Uncertainty is not error. Uncertainty is not a probability distribution. Variances add.”
(P.S. If variances add then how can σ decrease?)
Ok, I see you’re still rejecting the collective wisdom of statistics texts (including your own reference), statistics experts, monte carlo simulations, experimental evidence, etc. So let me just cut to the chase here and test your hypothesis that the uncertainty on monthly global mean temperatures is ±1C (2σ).
Assuming the uncertainty of NOAA, NASA, and Hadley datasets of monthly global mean temperature anomalies is ±1C (2σ) and by comparing values from 1979 to 2020 from different datasets using a simple abs(Tx-Ty) test we find the following.
The probability that 2 figures would agree by less than 0.05C is expected to be 5.8%. The actual occurrence rate is 66% based on 1536 tests.
The probability that 2 figures would disagree by more than 1.0C is expected to be 15.7%. The actual occurrence rate is 0% based on 1536 tests. In fact, the maximum disagreement was only 0.21C.
The differences of the 1536 test cases formed a normal distribution with a standard deviation of 0.053. And by applying the RSS rule this means the 1σ uncertainty on the individual values is ±0.037. Therefore the implied 2σ uncertainty using dataset differences is ±0.074 which is significantly less than ±1.0C.
Once again you are trying to use monte carlo tests inappropriately. This was pointed out to you at least twice before.
————————————————
“Monte Carlo simulation is a technique used to study how a model responds to randomly generated inputs. It typically involves a three-step process:
(bolding mine, tpg)
————————————————-
First, the computer models are inadequate to simulate future climate. Thus no amount of randomly generated inputs can result in a useful outputs.
Second, the randomly generated inputs have to be bounded based on physical reality. E.g. if one of the inputs to the model is ad valorem taxes you can’t just generate any old random number for the current and future tax rates. The random number has to be bounded based on all kinds of boundary conditions including politics. Climate simulations are no different. It’s not obvious that you have adequately bounded all possible input values.
Thirdly, the data sets have been manipulated. That makes any result quesitionable.
Fourthly, If you are using anomalies instead of absolute temperatures your variance is being artificially limited.
I didn’t use a monte carlo simulation. I compared each of the monthly values from NOAA GlobalTemp, NASA GISTEMP, and Hadley’s HadCRUT datasets from the period 1979 to present. There were 1536 combinations. I tested them all. If you want I can add ERA and BEST into the analysis and we can see if that changes the result.
In other words you are comparing monthly values, each of which have a wide uncertainty interval . Once again, you are assuming there is no uncertainty with these values and you can then compare them directly as if they are “true values”.
You simply cannot determine differences in the hundredths or thousandths digit from independent, random variables which have an uncertainty interval of at least +/- 0.6C. When you combine independent, random variables their variances add – and this is directly applicable to uncertainty as well. The values you are comparing have such a wide uncertainty interval that they are not even capable of being compared.
Consider this problem with using temperature the way you and the climate scientists do. When you plot distance versus time you get a value named velocity with dimensions like feet/sec. Well, daytime temps and nighttime temps are also time functions just like velocity. Both daytime and nighttime temps are, to a first estimate, V_t = (Tmax) sin(t). So V_t has dimensions similar to temp/sec. Now, when you pick a temperature off the temperature function you are actually getting a value with the dimension of temp/time. When you then use that value to calculate a mean you carry the temp/time dimension right along with it.
Exactly how do you get rid of that (time) part of the dimension?
You and the climate scientists get rid of by just ignoring it, pretending it doesn’t exist.
The easiest way to get rid of it is to integrate the temperature curve. When you do a dimensional analysis on the integral the “dt” cancels the “t” in the function and you wind up with temp as the dimension for the value. And what is this integral? It is how degree-days are determined. It is one method for taking a non-stationary function and making it into a stationary one which you can actually do a linear regression against.
Why do you and the climate scientists insist on doing linear trends on a non-stationary function when it would be so easy to do it on a stationary one?
Yes. I am comparing monthly values. If there were no uncertainty the values would match exactly. They don’t match exactly so clearly there is uncertainty. If the uncertainty were truly ±1C (2σ) then we would expect the agreement to be < 0.05 about 5.8% and > 1.0 about 15.7% of the time. The actual number of occurrences didn’t come out to anything remotely close to those values. Instead I saw a normal distribution that implies a ±0.074 (2σ) uncertainty consistent with published uncertainty analysis provided by these datasets. You can “nuh-uh” this result all you want that still doesn’t make the ±1C (2σ) hypothesis any less false.
You are confusing uncertainty with natural variation. Monthly values change because of weather, sunspot cycles, ENSO, AMO, etc.
Uncertainty is not a probability distribution. The whole idea of uncertainty is that you simply don’t know what the true value is.
Since there is no probability distribution it is impossible to calculate where in the uncertainty interval the true value might lie. It can lie *anywhere* in the interval, from the bottom end to the top end.
That is why trying to define a trend line that lies within the uncertainty interval is useless. It might be going up or it might be going down. Using the stated value for the trend line is only fooling yourself that you know something that you really don’t. I think it was Feynman that said something about not fooling yourself.
“Instead I saw a normal distribution”. You perhaps saw a normal distribution formed by the stated values. But it doesn’t follow that the uncertainty interval defines a normal distribution. It goes back to not fooling yourself. You have to understand that the stated values are *NOT* the true values. You are assuming that they are. Like all of the AGW zealots, you are assuming that the precision with which the mean is calculated is also the uncertainty of that population which is propagated from the individual components in that population.
That might be true for multiple measurements of the same thing but it is *not* true for multiple measurements of different things which result in multiple independent, random populations of size 1. When you combine independent, random variables their variances add. And the uncertainty interval is a form of variance. So the uncertainty grows. The most you can hope for is that they add by root-sum-square instead of direct addition.
Now come back and tell me like Bellman has that variances don’t add when you combine multiple independent, random variables.
“You are confusing uncertainty with natural variation. Monthly values change because of weather, sunspot cycles, ENSO, AMO, etc.”
No. That’s not even remotely correct. I am assessing how well monthly global mean temperature estimates from different datasets agree with each other within the same month. Each month and each combination of two datasets is treated as an independent test. I am not assessing the change in the global mean temperature from month-to-month here. That is something completely different.
GISS reports that SST are “calibrated” with satellite data. Not the same as that used by RSS and UAH but this calibration doesn’t seem to fix a drift of half a degree over 40 years, yet month to month variation is much smaller. Sorry, but your argument makes me less inclined to put down all the bad science as mere incompetence.
GISS uses ERSST. No where have I ever seen that ERSST or any insitu SST dataset is calibrated using satellite data. I don’t even know how that would be possible. You’ll definitely need to provide a cite for that extraordinary claim. Are you sure you aren’t thinking of the other way around; satellite based datasets are calibrated via insitu datasets?
It just gets old…warmest evah
What’s next Russia colluuuusion?
No doubt there are Russian operatives working in NOAA.
The Russian scientists are insulted – they actually had to pass a math course. Unless you meant there are Russian government propagandists at work. But how could you tell them from our pathetic “climate scientists”?
The issue is not that the climate changes. This period is expected to be significantly warmer than the 70s when it was written in the NOAA magazine (October 1974)
“Many climatologists have associated this drought and other recent weather anomalies with a global cooling trend and changes in atmospheric circulation which, if prolonged, pose serious threats to major food-producing regions of the world. Annual average temperatures over the Northern Hemisphere increased rather dramatically from about 1890 through 1940, but have been falling ever since. The total change has averaged about one-half degree Centigrade, “
, and slightly warmer than the 1930s-40s as the world warmed naturally as part of a 1000 year cycle.
The fudging everyone refers to is making that mid century cooling look like a pause in warming, and the present a lot more warmer than 1940. Its not about fiddling a good record either. Its about choices in reconstructing a global record from a real record that is not fit for taking differences of 0.5 C seriously – at the same site, let alone a global average.
https://woodfortrees.org/graph/hadsst2nh/mean:12/plot/hadsst2sh/mean:12/plot/hadsst3nh/mean:12/plot/hadsst3sh/mean:12
You can see here the closeness of the purple and red in the 1930s, while the blue and green line up. Clearly a stuff up with the swap in hemispheres, but regardless, they do changes to the reconstruction that makes large changes with a period that overlaps the base period and it does nothing to the the periods either side. That is dubious, along with a few other issues that might not convince you of fraud but should make you doubt that they are good scientists.
But it is not warming the way the models “dictate.” Radiosondes, satellites and ARGO put the nail in CAGW’s coffin. Past surface measurements are inadequate for scientific purposes. That was the entire justification for satellites and ARGO. And the weather is not getting any worse; see the UN IPCC CliSciFi reports.
NOAA and Nasa have now earned the same level of respect as the FBI and DOJ. None what so ever.
NASA lost all credibility (excepting JPL) when they started failing at building rockets. They lost all their real engineers and replaced them with diverse bureaucrats.
I never noticed NOAA had any credibility, but if they did it was gone the second they embraced AGW without any good evidence.
They do have anti-satellite weapons in the political arsenal. All it takes is a phone call from ……Oakland (Sierra Club).
Just one more reason not to trust what comes out of NOAA. They have a climate change agenda.
Only NOAA?
It would take far less space to list the agencies that DON’T have an agw agenda.
Since you bring that up, it seems the UK MET has just declared last month the “hottest month evah!”.
A NOAA Clone.
Bernie Sanders, (yes the communist Bernie Sanders), has made a big deal about the NOAA number in his various communiques about the 3.5 trillion give-away to save the planet from runaway glow-bull over heating. I’ve already sent both my state senators information that this is just B.S., but we need to make sure that the only sensible Democrats in the Senate, (WV and AZ), also get the word in sufficient numbers that they continue to see through all they hype.
http://www.manchin.senate.gov/contact-joe
http://www.sinema.senate.gov/contact-krysten
And thank you for your support
Glad that’s cleared up. Now, does this mean NOAA’s data set is considered less reliable than all the others?
Yawn
Is that a yes or a no?
When data gets consistently adjusted…you tell me.
80s Global warming was rebranded into Climate Change and now Climate Extinction…the tiny warming is hard to feel. But maybe Nick Stokes can tell…after all that poor fellow told us he fought climate change by lowering his thermostat in the winter and adding a blanket.
Reliability has a lot to do with repeatability. If you can’t repeat results because the experimental data has been “adjusted” then it is not reliable. NOAA’s data is not reliable.
NOAA should never have “adjusted” sea temperatures to make old “bucket” measurements match newer “float” measurements. They should have just provided two different data sets. Then let the researchers reach independent conclusions based on the differences between the data sets. Then the data would have remained *reliable*.
Maybe I should have said accurate rather than reliable. The point I was implying was that if it’s claimed the other 5 data sets “reject” the NOAA data because they differ in their rankings by a few hundred degrees, then that must mean these other data sets are considered a better measure of July’s temperature than NOAA’s. But I suspect that the net time there’s a different result, say HadCRUT shows a month as being a record and NOAA’s shows it as being 2nd or 3rd, it will be claimed that NOAA’s data refutes HadCRUT’s.
And of course, at some point some one is going to notice that NOAA’s is the one that is generally showing the least amount of warming of the surface data sets.
As I’ve told you before, I don’t trust *any* of the data records any longer. They are all either calculated results (e.g. satellite measurements) which depend solely on subjective calculation algorithms or they are fudged direct measurements where the fudging is totally subjective as well. It simply doesn’t matter how well-meaning the ones making the adjustments are, they are still subjective measurements and are, therefore unreliable for the purpose they are being used for.
Nor do I trust any so-called Global Average Temperatures derived from any of these data sets. A GAT is meaningless as you and I have gone around and around over. It’s made up of uncertain calculated mid-range values from the get-go and no amount of precisely calculating successively derived mean values from hundreds or thousands of uncertain data values can reduce the uncertainty in the final result. That makes using the GAT to try and determine differences in the hundredths digit a joke, a total folly.
Weather balloon data and the UAH satellite data correlate. Do you find something wrong with the Weather Balloon data?
UAH = +0.14 C/decade
RSS = +0.21 C/decade
RP-850 = +0.22 C/decade
RP-700 = +0.18 C/decade
RP-500 = +0.23 C/decade
You can download RATPAC here.
Your point?
The RATPAC 850mb-500mb mean warming rate is +0.21 C/decade. RSS is a near perfect match. UAH not so much.
Tom Abbott
Only place I’ve seen that claim is in John Christy’s years-old chart purporting to compare observations to computer models of the troposphere. Christy never links to his data sources for the weather balloons and, as far as I know, his chart has never been reproduced in a peer reviewed article – it only ever gets dragged out on blogs.
You mean to tell me that with all your search skills, you can’t find the database that does not support your narrative?
Perhaps you should contact John Christy or Roy Spencer and ask them about their data. They have a website where you can ask any question you want to ask.
I bet if you go over there and challenge their data, they will have a reply for you.
You don’t deny that they claim the UAH satellte data and the Weather Balloon data correlate, do you? They do make that claim.
I’ve never seen anyone challenge that claim, except you. I would think if it were challengeable, it would have already been challenged in the past, considering how sensitive alarmist are about the UAH satellite data.
Feel free to debunk it if you can.
Neither set of data is useful in determining a Global Average Temperature.
The uncertainty associated with each of these data sets *still* adds up when you combine individual, random measurements of different things. The variance adds when you combine independent, random variables. The variance must be considered along with the mean, it tells you how well the mean represents the data population.
It simply doesn’t matter if their trends correlate. Trends from snapshots in time of a time varying function don’t mean much. None of the data sets, when averaged, can tell you anything about what is happening with minimum and maximum temperatures – again, a prerequisite for determining climate.
It’s why I’ve always considered the whole climate prediction field to be a farce. It’s why professionals designing HVAC systems rely on degree-day values (an integral of the temperature profile) and not on some kind of hokey “average” temperature. Degree-day values *do* tell you something about the actual climate. The heating and cooling degree-day values *do* tell you a lot more about what is happening to minimum and maximum values for the temperature profile.
And yet all these different subjective algorithms tell more or less the same story. Either all the different data sets are approximating some truth, or they are all making the same mistakes accidentally or deliberately. And my usual question at this point is if all of the sets are being fudged to produce similar results, why doesn’t someone who disagrees produce their own estimate showing something completely different?
There’s a similar problem with your claims that the uncertainty in a monthly average is multiple degrees. If that was the case, why are there never swings of multiple degrees month to month, or even over the whole data set?
“or they are all making the same mistakes accidentally or deliberately.”
That’s what I believe it is.
“And my usual question at this point is if all of the sets are being fudged to produce similar results, why doesn’t someone who disagrees produce their own estimate showing something completely different?”
The UAH satellite data shows something completely different. That’s my point.
“There’s a similar problem with your claims that the uncertainty in a monthly average is multiple degrees.”
No, I said the discrepancy is about 0.4C. The UAH satellite chart shows 1998 and 2016 are separated by about 0.1C (the margin of error of the measuring instrument), whereas, the other data sets show 1998 and 2016 separated by about 0.4C.
This 0.4C difference gives the Data Manipulators room to create their “hottest year evah!” meme.
The Data Manipulators couldn’t claim any year between 1998 and 2015 as the “hottest year evah” if they use the UAH data set.
See for yourself:
I added this to the bottom of my comment above but the timer says I can’t add it, so I’ll do it here:
As you can see from the link below, the Data Manipulators have claimed 10 years in the 21st century as being the “hottest year evah!”, but none of them are warmer than 1998, if you go by the UAH satellite chart. They could not make those claims using the UAH satellite chart. That’s the difference.
https://en.wikipedia.org/wiki/Instrumental_temperature_record
This is why I don;t like using records in place of actually looking at the trends. They are somewhat arbitrary, and in a case like UAH where you have one exceptionally warm year, there may not be a new record set for decades despite a continuing warming trend.
Yo your point about “[NOAA] have claimed 10 years in the 21st century as being the “hottest year evah!”” you are wrong. The record for warmest year on record was set in 2005, 2010, 2015 and 2016. Four not ten years where the hottest year on record.
What your chart shows is that in NOAA’s data set the 10 warmest years have all been in the 21st century. UAH isn’t that different with 9 out of the 10 hottest years being in the 2st century. It’s just that 1998 was so much hotter in the UAH data set.
“The UAH satellite data shows something completely different. That’s my point.”
I wouldn’t say UAH was “completely different” to the other data sets, just slightly less warming and bigger swings during El Niños.
The trend for UAH since 1979 is 0.135 ± 0.050°C / decade. Trend for NOAA since 1979 is 0.166 ± 0.037°C / decade.
Other data sets show more warming, but I wouldn’t say UAH is completely different to other sets.
“No, I said the discrepancy is about 0.4C.”
I was talking to Tim Gorman about his claim that the uncertainty of the monthly means increases with sample size, to the point where the uncertainty is more than 5°C.
“why doesn’t someone who disagrees produce their own estimate showing something completely different?”
Do *you* own an independent satellite useful for measuring radiance around the earth? Do *you* own a thousand temperature measuring stations placed around the globe useful for measuring temperature?
When the base data sets are fudged then *all* results from those base data sets invoke that same fudged data.
“If that was the case, why are there never swings of multiple degrees month to month, or even over the whole data set?”
Huh? You think there aren’t swings of multiple degrees between July and November? When you are plotting ANNUAL average temps, or even worse annual anomalies, why would you expect there to be much variance?
“Do *you* own an independent satellite useful for measuring radiance around the earth? Do *you* own a thousand temperature measuring stations placed around the globe useful for measuring temperature? ”
I’m not the one claiming all the data sets are wrong. I’m happy to trust those who produce the global data sets, until someone proves they are wrong. If you are claiming they are all wrong, let alone fraudulent, then the onus is on you to provide the evidence.
“Huh? You think there aren’t swings of multiple degrees between July and November?”
Not in the anomalies. But if you don’t like anomalies, compare the same calendar month. How often is July of one year a degree or more warmer than the previous July?
“When you are plotting ANNUAL average temps, or even worse annual anomalies, why would you expect there to be much variance?”
I was talking about monthly means, not annual. But by you logic the uncertainties in an annual average should be greater than for a monthly average, so I’m not sure why you’d expect there to be less variance.
““why doesn’t someone who disagrees produce their own estimate showing something completely different?””
“’m not the one claiming all the data sets are wrong.”
I didn’t say the data sets are wrong, I said they are USELESS for the purpose they are being used for. And, when it comes right down to it, manipulated data *is* wrong – by definition. It simply doesn’t matter how pure the motives are of the manipulators, manipulation makes the data wrong. It no longer represents reality.
It’s like we learned in electronics lab, if you change measurement devices you start your data set all over again. You don’t just manipulate one data set to match another, unless you can physically show a calibration error as the cause. Similarly you don’t manipulate bucket temps to match Argo temps (or vice versa), that *is* unethical in the extreme. You should start your data set all over again. You can then compare the data sets side by side and come to conclusions – but you simply don’t try to manipulate the data to make it “look” the same.
“Not in the anomalies”
The anomalies have the *exact* same uncertainty as the underlying data itself. It doesn’t matter if q = x + y or q = x – y. The uncertainties in x and y add in both cases.
“How often is July of one year a degree or more warmer than the previous July?”
How do you know whether one is warmer or cooler than the other when the uncertainty of the monthly value is more than the difference you are trying to discern?
“I was talking about monthly means, not annual. But by you logic the uncertainties in an annual average should be greater than for a monthly average, so I’m not sure why you’d expect there to be less variance.”
The variance of the mean is based on the sample size. That is *NOT* the same thing as the variance of the data itself. Calculating the variance of the data, i.e. the uncertainty, follows the rule that when you combine random, independent data the variances add. In other words the accuracy the mean gets worse even as the preciseness of the calculation of the mean increases. The wider the variance of the data gets, the worse the mean characterizes the data itself.
You can fight against this truth all you want but it won’t change reality one iota. It’s why the GAT is so useless in trying to identify differences in the hundredths digit for temperature. It doesn’t matter how precisely you calculate the mean if the uncertainty associated with that precise number has a wider interval than the difference you are trying to discern.
“I didn’t say the data sets are wrong, I said they are USELESS for the purpose they are being used for. … It no longer represents reality.”
And if no-one can produce a data set that matches reality to your standards, what then? Does it mean temperatures are not rising, or does it mean they are rising twice as fast?
Much of your comment falls into the best being the enemy of the good. Like a lot science, you cannot measure past climates in a laboratory, you have to deal with the information available and try to make the best estimate you can. None of the data sets are correct, but they might all be useful, and until someone can come up with a better set showing a different estimate, it’s unreasonable to throw out all the data.
“The anomalies have the *exact* same uncertainty as the underlying data itself.”
You claimed that the uncertainties were evident in absolute temperatures, comparing January and August temperatures. I pointed out there was no evidence in the anomalies. If the anomalies have exactly the same uncertainty as the underlying data then that uncertainty should be visible in the monthly anomaly data.
“And if no-one can produce a data set that matches reality to your standards, what then? Does it mean temperatures are not rising, or does it mean they are rising twice as fast?”
I’ve given you a link to a dataset that goes back 20 years in some cases – it’s a degree-day database. Growing degree-day databases go back further than that!
Who knows what the temperatures are doing? You can’t tell from averaged mid-range temperatures. You had to finally admit that yourself in another thread!
“Much of your comment falls into the best being the enemy of the good”
No, my comment falls into the useless versus the useful. The GAT is useless. Degree-day values are useful. It really is quite that simple.
” I pointed out there was no evidence in the anomalies. If the anomalies have exactly the same uncertainty as the underlying data then that uncertainty should be visible in the monthly anomaly data.”
Why would it be visible? Averaging daily mid-range values and then converting them into anomalies using another hokey average just hides the variance of the data. In doing so the uncertainty is hidden as well. Your dependence on the preciseness of the mean as being the accuracy of the mean is a prime example!
“I’ve given you a link to a dataset that goes back 20 years in some cases – it’s a degree-day database. Growing degree-day databases go back further than that!”
And what is the global estimate for your degree-day database? Does it show more or less warming than the other data sets?
“Who knows what the temperatures are doing? You can’t tell from averaged mid-range temperatures. You had to finally admit that yourself in another thread!”
Citation required. I don’t remember saying that mean daily temperatures cannot tell you what temperature is doing. But our conversations have been so extensive who knows what combination of words I might have used at some point.
“No, my comment falls into the useless versus the useful. The GAT is useless. Degree-day values are useful. It really is quite that simple.”
It really isn’t that simple. Degree days have uses, global averages have uses, neither are perfect.
“Averaging daily mid-range values and then converting them into anomalies using another hokey average just hides the variance of the data. In doing so the uncertainty is hidden as well.”
How do you hide uncertainty? The mean values are calculated from the variable data. If that mean is as uncertain as the data then it should be visible in the mean.
“Your dependence on the preciseness of the mean as being the accuracy of the mean is a prime example!”
No, I keep saying that precision is only part of the accuracy and that there might be systematic errors. There might be sytematic errors in your degree days as well, or in any measurement. But I think there’s something seriously wrong if those systematic errors change the anomaly by or more degrees.
“And what is the global estimate for your degree-day database? Does it show more or less warming than the other data sets?”
This is proprietary data. Pay for the service and select your own sampling locations. The last time I did this I focused on NON-uhi locations from rural China, to rural Siberia, to rural Africa, to rural South America, to rural US. In almost every single case heating degree-day values were going down (i.e. warmer nighttime temps) and cooling degree-day values were going down as well (cooler daytime temps).
Pay your money and do the same.
“It really isn’t that simple. Degree days have uses, global averages have uses, neither are perfect.”
Global averages have no use whatsoever. The GAT simply cannot tell you what is happening with the temperature profile. And anomaly use makes it even worse. Point Barrow, AK can have the same daily anomaly as Mexico City yet the climate in each location is quite different. You can’t even tell whether maximum or minimum temp profiles are causing the changes.
Degree-days *are* quite useful. That’s why engineers use them to size HVAC systems. They give values that are very useful in determining climate.
“Citation required. I don’t remember saying that mean daily temperatures cannot tell you what temperature is doing. But our conversations have been so extensive who knows what combination of words I might have used at some point.”
Really? You don’t remember our discussion about using 0.63 x Tmax to determine average daily temps? You don’t remember telling me that you can’t give me Tmax values and Tmin values based on the mid-range temp? Sounds to me like selective memory loss.
“How do you hide uncertainty? The mean values are calculated from the variable data. If that mean is as uncertain as the data then it should be visible in the mean.”
By trying to push the agenda that how precise the calculation of the mean is also determines the inaccuracy of the mean based on the uncertainty of the underlying data forming that mean.
You keep confusing precision and accuracy. If your mean turns out to be a repeating decimal does that imply the mean is infinitely precise? Does it imply that the accuracy of that mean does not depend on the uncertainty of the component data making up the mean?
If the standard deviation of a population resembles how uncertain the mean of that population is, and if variances add when combining individual, random populations then how does the standard deviation of the population not increase?
Your “uncertainty of the mean” is a measure of how precisely you have calculated the mean. More data points means more preciseness. That is *not* the standard deviation of the population which indicates how accurate the mean truly is. Again, if variances add when combining individual, random populations then the standard deviation also rises. It does *not* decrease by N or sqrt(N).
“No, I keep saying that precision is only part of the accuracy and that there might be systematic errors. “
Nope. Precision has nothing to do with accuracy. And uncertainty is *not* error.
And you have NEVER answered me about what the uncertainty is for an integral of Acos(x). It’s easy to figure out. Deriving that uncertainty might give you some insight as to the uncertainty of degree-days. I say might because I don’t believe you will ever work it out and you’ll never accept the result if you do.
“This is proprietary data. Pay for the service and select your own sampling locations.”
In other words you don’t have a global reconstruction based on degree days, and expect me to pay for the privilege of working one out for you. And none of this will provide answer to my original point, which is if all current global data sets are as inaccurate as you claim, why has no one produced a more accurate one – one showing the current ones are out by several degrees.
“Global averages have no use whatsoever. ”
Endlessly asserting this doesn’t make it any truer. On another thread Jim Gorman is asking me to analyze these global average temperature sets using Fourier analysis or whatever. Should I just tell him it’s a waste of time as all the data is useless?
“Point Barrow, AK can have the same daily anomaly as Mexico City yet the climate in each location is quite different.”
Yes, that’s the benefit of using anomalies. It avoids the complications arising from different climates and focus on a more consistent value. The anomaly tells you how much warmer or cooler each place is compared with the base period.
“n other words you don’t have a global reconstruction based on degree days, and expect me to pay for the privilege of working one out for you.”
Did you not read my message? How many samples do you need to create a global reconstruction?
“And none of this will provide answer to my original point, which is if all current global data sets are as inaccurate as you claim, why has no one produced a more accurate one – one showing the current ones are out by several degrees.”
Because no one has the wherewithal to create a satellite of their own or create an independent measuring station network. I already pointed this out to you.
“Endlessly asserting this doesn’t make it any truer. On another thread Jim Gorman is asking me to analyze these global average temperature sets using Fourier analysis or whatever. Should I just tell him it’s a waste of time as all the data is useless?”
Part of the reason it is useless is that it is a snapshot of a periodic, non-stationary function. Basic statistical analysis simply doesn’t work. That’s in addition to the uncertainty associated with the data itself.
“Yes, that’s the benefit of using anomalies. It avoids the complications arising from different climates and focus on a more consistent value. “
ROFL!! In other words the actual climate is not needed in order to analyze the actual climate. Jeesh, did you actually read this after you wrote it?
“Because no one has the wherewithal to create a satellite of their own or create an independent measuring station network. I already pointed this out to you.”
The objective isn’t to start a new system of measurements. That’s not going to tell you what happened in the past. The objective is to demonstrate that all the exiting data sets are wrong / have been manipulated, by demonstrating what the correct values were in the past.
“ROFL!! In other words the actual climate is not needed in order to analyze the actual climate.”
The objective is to study climate change. If temperatures are now different to what they were in the past that indicates change. If two different regions have both changed in the same way, that’s more interesting than knowing what the difference between the two climates.
As always you want to ignore any data that does not tell you everything. Knowing that on average temperatures are different to what they were in the past tells you something, and something we are interested in. It doesn’t tell you everything, but having a global mean anomaly does not stop you looking at other data in more detail.
“The objective isn’t to start a new system of measurements. That’s not going to tell you what happened in the past”
As I’ve pointed out at least twice, trying to combine data sets created from different measurement methods by “adjusting” the values in one data set is unethical and a fraud unless a constant physical calibration offset can be identified.
That means you *need* a new, independent data set which can be compared to whatever other data sets you have available. But the existing data sets are too corrupted to ever be serve a useful purpose — e.g. Mann’s “LOST* data.
“The objective is to demonstrate that all the exiting data sets are wrong / have been manipulated, by demonstrating what the correct values were in the past.”
All the data sets *have* been manipulated. Where have you been? Even the Argo data has been manipulated so as the “match” old bucket measurements. And you do not know what the correct values in the past were. Those measurements had uncertainty intervals associated with their stated values. In other words the true values can’t be determined from their combination into a combined data set – just like you can’t do it today.
“The objective is to study climate change. If temperatures are now different to what they were in the past that indicates change.”
What change does it indicate? Does it indicate a change in weather patterns in different regions – which may not be a climate change at all! Or does it actually say something about climate? The sparseness of the data in the past was way more than it is today and today isn’t very good either. True climate change is indicated by enthalpy, not by temperature yet the climate scientists today still ignore enthalpy just like they ignore the non-stationarity of the temperature record.
“If two different regions have both changed in the same way, that’s more interesting than knowing what the difference between the two climates.”
Again, IF YOU DON’T KNOW WHAT HAPPENED WITH TMAX AND TMIN HOW DO YOU KNOW IF THEY CHANGED IN THE SAME WAY? If Tmin changed from 10F to 15F what actually changed in the climate at that location? What was frozen in the past is still frozen today! And if Tmax stagnated the “average” would still have gone up but how do you know that? And what does that mean for the climate at that location?
“As always you want to ignore any data that does not tell you everything.”
No, I want to ignore data that doesn’t tell me *anything*.
“Knowing that on average temperatures are different to what they were in the past tells you something, and something we are interested in.”
If it doesn’t tell you *what* changed then it is useless data. How do you decide what needs to be done if climate change actually happened? What if your recommended change actually makes the Tmin average go down thus shortening growing seasons (i.e. less food) and kills more people from hypothermia? That’s what we face today from the idiotic focus on the GAT which actually tells you NOTHING.
Part 2
“Really? You don’t remember our discussion about using 0.63 x Tmax to determine average daily temps?”
How could I forget. Have you managed to figure out why 0.63 x TMAX is not the same as the daily average yet, or do I have to show you again.
As far as TMEAN is concerned, yes I said that you cannot tell what TMAX or TMIN are just from that, but that doesn’t mean you cannot tell a lot about what the temperatures are doing by comparing just the TMEAN.
Climate is determined by the WHOLE temperature profile, not just a mid-range value. If you do not know Tmax and Tmin then you simply do not know what the temperatures are doing. When different Tmax and Tmin temperatures can result in the same mid-range value then how do you know what the temperature is doing?
BTW, why do you speak of the uncertainty associated with the integral of the temperature profile while still refusing to actually analyze what the uncertainty is?
“BTW, why do you speak of the uncertainty associated with the integral of the temperature profile while still refusing to actually analyze what the uncertainty is?”
Because I’ve know idea what you are talking about.
First you ask about the uncertainty of an integral of a cos function, which obviously has no uncertainty. Now you want me to analysis the integral of a temperature profile. Do you mean the uncertainty of a simplified temperature function, the uncertainty of random samples of an actual day measured with uncertain instruments, or what?
Do you still think the mean daytime temperature is found by multiplying the max temperature by 0.63?
“Because I’ve know idea what you are talking about.”
I’m quite sure that is true! What is the uncertainty interval for the integral of the daytime/nighttime temperature curve? That’s not a hard question. Taylor tells you exactly how to calculate it.
“First you ask about the uncertainty of an integral of a cos function, which obviously has no uncertainty.”
I didn’t ask about the uncertainty of a cos function, I asked you about the uncertainty of a degree-day value which is the integral of a cosine function.
“Do you still think the mean daytime temperature is found by multiplying the max temperature by 0.63?”
Evaluate the integral yourself and see what you get. It’s not hard.
“I didn’t ask about the uncertainty of a cos function, I asked you about the uncertainty of a degree-day value which is the integral of a cosine function.”
Your exact words:
“And you have NEVER answered me about what the uncertainty is for an integral of Acos(x).”
If you want to know the uncertainty of a degree-day estimate, you need to say what method is being used.
One method is to estimate it from max and min values, maybe using a formula assuming the day follows a sine wave.
Another is to take lots of measurements throughout the day and work out the average from them, possibly using some interpolation to handle the transition periods.
In the first case the uncertainty will depend on how good the measurements of max and min are, but also on how good the assumption of the daily cycle is.
In the second it will mainly depend on the uncertainty of individual measurements. If they are taken every minute and if the errors are independent, an if the uncertainty of the thermometer is 0.5°C, you could say the measurement uncertainty is 0.5 / sqrt(24*60) ~= 0.01. (You could reduce that further on the grounds that parts of the day will be definitely zero). But as I said to Monte in that does depend on minute by minute reading having independent errors.
In both cases though this is talking about the uncertainty of the measurements – i.e. how certain are we that the degree-day temperature at that particular station is correct for that station. If you want to look at a larger area there’s also the uncertainty from the sampling of different station. For that you need to look at how many stations you are using to represent the area, along with the usual issues of the distribution of the stations..
““And you have NEVER answered me about what the uncertainty is for an integral of Acos(x).””
Do you see the bolded characters above?
The uncertainty of a cos function and the uncertainty of the integral of a cosine function ARE TWO DIFFERENT THINGS!
Well the uncertainties are still both zero. What do you think the uncertainty is in the integral of a cos function?
The only thing I’m not certain of now, is if you mean arccos, or A * cos. Either way I see no uncertainty in the integral.
ROFL!!! Since when does Acos(x) mean arccos? If I had meant arccos I would have said arccos.
A is a measurement like Tmax. Thus there *is* uncertainty. But, yes, the uncertainty of the cos function is zero. So the uncertainty is just that of A.
But that uncertainty is smaller than the total uncertainty from combining a series of independent, random measurements. Therefore the degree-day value (i.e. the integral of the time dependent temperature profile) will have less uncertainty than a mid-range value whose uncertainty is the sum of the uncertainty of the two independent, random values of different things.
Of course, this is dependent on the temperature profile being a sine wave. The more distorted it is the bigger the problem becomes. If it is distorted enough then you have to numerically integrate the curve using a different method. This increases the uncertainty in the final value of the uncertainty.
This lowering of the uncertainty is one reason I advocate for the use of degree-days for monitoring climate. The heating/cooling degree day values will tell you what is increasing and decreasing with less overall uncertainty.
But I doubt we will ever see the AGW crowd convert to using degree-days. It would highlight their inability to actually tell us what is going on locally, regionally, and globally. They are going to stick with trying to use linear regression on a non-stationary function with large uncertainty and pretend that the uncertainty doesn’t actually exist. That way they can continue their scare tactics and keep the money flowing.
acos is often used an abbreviation for arccos in computing, calculators and the like. Of course, I could guess what you wanted, but you have such an odd way of demanding answers to cryptic questions it’s necessary to get all the I’s dotted.
“A is a measurement like Tmax.“.
Case in hand. You never specified that A was an uncertain measure. I would assume it was just a constant.
“But, yes, the uncertainty of the cos function is zero. So the uncertainty is just that of A.”
What you also haven’t specified is what integral you are asking for, definite or indefinite, and assuming definite over what range. If you want it between 0 and pi, or 0 and 2pi, the integral is zero, whatever A is, so the uncertainty is still zero. I’m guessing that you really want it between -pi/2 and +pi/2, in which case the integral is 2A, so the uncertainty will be 2u(A). If you want the average then divide that by pi, to get 0.64u(A).
“But that uncertainty is smaller than the total uncertainty from combining a series of independent, random measurements.”
You keep using the word combine without specifying how you are combining them.
“Therefore the degree-day value (i.e. the integral of the time dependent temperature profile) will have less uncertainty than a mid-range value whose uncertainty is the sum of the uncertainty of the two independent, random values of different things.”
Firstly, as I keep trying to tell you, you cannot estimate the degree-day for a day using just the maximum value. You need to know the minimum as well in order to determine the amplitude of the wave – hence you still need two uncertain measurements, just as for calculating the mean.
Second, you still don’t seem to have any idea about how degree-days are calculated. You can approximate the value by using just the max and min values, but that’s not what is meant by the integral method. What’s meant by integrating is taking the average of multiple readings throughout the day.
See https://www.degreedays.net/calculation
How does this affect the uncertainty?
“acos is often used an abbreviation for arccos in computing, calculators and the like. “
But *not* Acos.
“Case in hand. You never specified that A was an uncertain measure. I would assume it was just a constant”
Really? This is the argumentative fallacy known as Nitpicking. Arguing about irrelevancies. What did you *think* we were discussing if not uncertainties?
“What you also haven’t specified is what integral you are asking for, definite or indefinite, and assuming definite over what range.”
More BS. 1. We’ve discussed degree-days and how they are calculated several times before. I also gave you an actual integral to evaluate:
What do you think 0 and are?
are?
When doing degree-days you choose the set point first, that determines the range over which the integral is evaluated, you don’t determine the range first and then derive the set point from that!
You are just throwing stuff against the wall to see if anything sticks.
Again you keep giving me abstract equations to solve then want to claim the answer relates to the real world and ignore all the reasons why it doesn’t. The uncertainties in a sine wave based on a single measuremnt are not the same as the uncertainties in calculating how many degree days there were in a day.
“Again you keep giving me abstract equations to solve then want to claim the answer relates to the real world and ignore all the reasons why it doesn’t. The uncertainties in a sine wave based on a single measuremnt are not the same as the uncertainties in calculating how many degree days there were in a day.”
No kidding? The uncertainty in ONE measurement is *NOT* the same as the uncertainty in multiple measurements?
Who would have ever guessed? What do you think I’ve been trying to explain to you?
I’ve never disagreed that the uncertainty of one measurement is different than that of many. What I’m saying here is that you cannot calculate a cooling or heating degree day using just one measurement.
Of course you can. All you need is the max/min temp and the base temp to get the cooling/heating degree-day value.
E.g.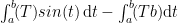
Where Tb is the temp set point and T is either max or min depending on if you want cooling/heating degree-day.
“ If you want the average then divide that by pi, to get 0.64u(A).”
Which is the whole point! The uncertainty of the integral is less than that of a mid-range value which is 2u, assuming the same uncertainty for each measurement.
It’s why degree-days have less uncertainty than mid-range values. Which leads one to question why the AGW climate scientists refuse to convert to using degree-days instead of mid-range values.
I have no doubt that it is greed and politics and not true science.
“Which is the whole point! The uncertainty of the integral is less than that of a mid-range value which is 2u, assuming the same uncertainty for each measurement.”
But only because in your integral of a cos, it is known that the cos function is centered at zero. Therefore if I know the maximum of the wave, A, I also know the minimum -A. You keep wanting to use the Fallacy of False Analogy to argue that this means you can integrate a daily temperature record using only the maximum value. But even assuming the daily cycle is a cos function it is not Tmax * cos(t), you cannot assume Tmin = -Tmax, or that Tmean = 0. So your analogy is worthless. You can only get the cos function of a day by knowing both the min and the max.
“But only because in your integral of a cos, it is known that the cos function is centered at zero.”
Oh, malarky! I just showed you in another message that you can do the integral of the sine and get the degree-day value. *YOU* are the one that introduced the cos, not me.
The degree-day integral is centered around the peak, be that peak at 0 radians or at pi/2 radians. You get the same value for the degree-day value no matter which one you integrate.
“I just showed you in another message that you can do the integral of the sine and get the degree-day value.”
You showed me how you could get the wrong value. In fact an obviously wrong, as in impossible value.
The point I was going to make was that no matter what value you get it could be wrong because you need to know either the minimum or the mean temperature to know what the amplitude of the wave is.
“*YOU* are the one that introduced the cos, not me. ”
Not sure I did, you where the one who demanded I tell you the uncertainty of the integral of Acos(t).
“The point I was going to make was that no matter what value you get it could be wrong because you need to know either the minimum or the mean temperature to know what the amplitude of the wave is.”
Stop whining. I forgot to subtract the area under the base line from the total.
I’ve attached a picture that might help you visualize what is going on. I doubt you will look at or even understand it if you do but anyone that understands integrals will figure it out quickly.
This evaluates to: (-75)(-.2) – (-75)(.2) – (65)(1.77) + (65)(1.36) =
15+15-115+88 = 3
So you get 3 cooling degree-days.
You don’t need the minimum temp and you don’t need the average temp and you don’t need the mid-range temp.
Get a calculus textbook.
Your picture is what I assumed you were trying to do, and illustrates the problem. Without the min temperature you do not know the shape of the sine wave. You are still assuming the daily temperature goes to 0°F, and presumably the minimum is -75°F. This is a problem both in your calculation of the area under the curve, and in your choice of transition points. Aside from which, you are treating the sine wave as a straight line to estimate these transition points.
What does you graph look like if the minimum temperature was 55°F or 65°F?
OH, and you are still not dividing by 2pi. You’re calculating cooling degree radians, not cooling degree days.
You DO know the shape of the sine wave. What makes you think you don’t?
If the maximum value is 75 and it is a sine wave then 75sin(t) describes the entire sine wave. The values are above the zero line from 0 to pi and below the zero line for pi to 2pi.
And, as I pointed out IT DOESN’T MATTER!
When you calculate the area under the sine wave and the area under the baseline the height for both go to the same reference line. It doesn’t matter if that reference line is 0F, -50F, or -100F.
When you subtract the areas you get the *EXACT* same value for the area between the sine curve and the baseline!
This is basic geometry. It’s not really even calculus. If I overlay two rectangles on top of each other where one is shorter than the other I can find the difference in the areas by subtracting the areas of the two rectangles. It doesn’t matter if Rect1 is 1′ wide and 30′ long and Rect2 is 1′ wide and 29′ long or if R1 is 1′ wide and 1000′ long and R2 is 1′ wide and 999′ feet long.
The difference between them will still be 1′ x 1′ for both cases!
Did you not take geometry in high school?
You know the shape of a sine wave, what you don;t know if that shape has any resemblance to the temperature profile of the day. Say the function for the day wasn’t 75sin(t), but 15sin(t) + 60, would your integral give you the same result? What if it was 5sin(t) + 70?
And lets see how you could apply the integral to calculating heating degree days, for the same base line 65°F, where the minimum temperature was 50°F.
“what you don;t know if that shape has any resemblance to the temperature profile of the day.”
Of course I do. I attached a graph of a weeks temperature profile to another message. You agreed those profiles looked very much like sine waves!
At any one point on the earth, the angle of the sun with respect to that point is a sine wave, thus the amount of sunshine on that point follows a sine wave as well. Since the daytime temperature is mostly driven by the sun, why wouldn’t the daytime temperature also follow a sine wave?
“Say the function for the day wasn’t 75sin(t), but 15sin(t) + 60, would your integral give you the same result?”
Of course it wouldn’t. But the degree-day values would be different because of different temperatures. You *do* realize that the 60 could just represent a baseline temp for calculating degree-day? Which is what I showed in my final integral.
If it isn’t a baseline temp then your temperature will go from 60 when sin(t) equals zero (i.e. when the temperature crosses the baseline value) to 75 at peak, and then back down to 60 again.
What makes you think that isn’t still a sine wave? 60 just becomes an offset.
I don’t need your minimum temp at all. Why don’t you understand that? I’ve sent you at least three copies of my picture why minimum temps don’t matter when you are calculating differences in areas.
Integrate 15sin(t) + 60 when it is above 65 degrees. What is so hard about that?
Attached is a copy of what I worked up. 1.76 deg-day.
Please remember multiplying by (1/2pi) day/radian is *NOT* calculating an average. It is a conversion factor converting radians to day. You don’t wind up with ‘degree’ for a dimension which would indicate an average, you wind up deg-day instead of deg-radian.
I’m sorry, it won’t let me upload my png or a jpg.
So here goes with latex
Translate 15sin(t) + 60 >= 65 to:
15sin(t) = 5.
60 is just an offset and we ca remove it.
==>
(15)(-.3) – (-15)(.96) – [ (5)(1.87) – (5)(.3)] =
18.9 deg-rad – 7.85 deg-rad = 11.05 deg-rad
2pi rad/day ==> (1/2p) day/rad
(deg-rad)(day/rad) ==> deg-dary (not an average)
(11.05 deg-rad) / (1/2pi day/rad) = 1.76 deg-day
No need for a minimum temp. No need for an average. Wish you could see the graph.
There’s some progress here, but you are still missing a few points.
First, I am not saying the temperature profile is not a sine wave. For the sake of argument, I am assuming these are all perfect sine waves. What I’m trying to get you to understand is that you cannot deduce the scale of the sine wave, and hence the CDD if you only know the maximum temperature.
So here you admit that you will get a different CDD for the temperature profile, 75sin(t), than for 15sin(t) + 60. Yet you still insist that you only need the maximum temperature to work out the CDD. I’m not sure if you are not seeing the point, but both these profiles have the same maximum temperature, so QED, you cannot work it out knowing just the maximum.
You are still not getting the actual value correct, mainly because you seem to be way off on the limits of your integral. I make it 2.54 CDD for the sine wave centered on 60, compared with 1.10 CDD for your one centered on 0. Again I’ve checked this both by doing the integral, using the arcsine equation I showed you to calculate the limits.(0.33, 2.80), and by taking the average of 1000 measurements.
I’m still not sure why you think this is so important, because the whole point of the websites you pay money to, is to derive the CDD and HDDs from taking multiple readings throughout the day, so you don’t have to worry about approximating the temperatures as a sine wave. And you keep dodging the real issue, that if the CDD is calculated by taking multiple readings, by your assertions this should make the figure less certain. And this is true whether you regard it as taking an average or a sum. If each reading has an uncertainty of 0.5°C, then by your logic 24 independent readings will increase the uncertainty to around 2.5°C for the day, and summing up days to get a monthly value will increase the uncertainty by even more.
“What I’m trying to get you to understand is that you cannot deduce the scale of the sine wave, and hence the CDD if you only know the maximum temperature.”
Of course I can. The shape of a sine wave is determined solely by the Asin(t) function. Over the same time period, e.g. 0 – pi, it is A that determines how peaked the sine wave is. The peakedness can be described by taking the derivative of Asin(t).
d(Asin(t))/dt = Acos(t). At t = 0, cos(t) = 1 and the slope of the sine wave is A.
slope of 75sin(t) at 0 radians is 75.
slope of 15sin(t) at 0 radians is only 15.
It is the peakedness that determines the area under the curve above a set point.
If the function was 0sin(t) + 75 you would have a derivative of 0 and the function would describe a rectangle above the set point, e.g. the area below the curve would be (0) + 75 * pi or 75pi.
“So here you admit that you will get a different CDD for the temperature profile, 75sin(t), than for 15sin(t) + 60.”
Of course you will! See above. They both have different peakedness, therefore they each spend a different amount of time above the set point!
“Yet you still insist that you only need the maximum temperature to work out the CDD”
I don’t need the minimum. The 60deg figure is an offset. The minimum value for this, if a perfect sine wave, would be -(15sin(t) + 60) = -75. What is so hard about this? I simply don’t need the minimum value of the sine wave. The temp at sunrise is merely an offset and, as the graphs show, I can eliminate the offset quite easily and still calculate the area of the sine wave above the set point. If the 60deg is *not* a sunrise offset and is a true minimum then the daytime curve will never make it even to zero let alone +65!
“You are still not getting the actual value correct, mainly because you seem to be way off on the limits of your integral.”
To tell where the integration begins all you have to do is evaluate where 15sin(t) + 60 = 65.
15sin(t) + 60 = 65 ==> 15sin(t) = 5 ==> sin(t) = .0.3. arcsine(.3) = 0.3 radians. Add pi/2 to get the far end of the integration 0.3 + pi/2 = 1.87.
If you are evaluating 75sin(t) = 65 then you get sin(t) = 65/75 = .87 ==> arcsin(.87) = 1.06 radians. Add pi/2 and you get 2.64 radians.
Again, the two functions differ because of the peakedness of the sine wave.
“ that if the CDD is calculated by taking multiple readings, by your assertions this should make the figure less certain. “
I already said this. But the integration is *LESS* uncertain.
The uncertainty will only be for the period of the integration, not for the entire day. 1.85 radians in one case and 1.58 radians in the other. At about .25hours/radian you get about 7 hours of readings in one case and 6 hours in the other. If you use RSS you’ll have about +/- 1.3degree-day uncertainty in one case and about +/- 1.2deg-day uncertainty in the other. That’s why it’s better to do the integration of you can.
You keep contradicting yourself.
Me: “you cannot deduce the scale of the sine wave, and hence the CDD if you only know the maximum temperature”
You: “Of course I can. The shape of a sine wave is determined solely by the Asin(t) function.”
Later
Me: “So here you admit that you will get a different CDD for the temperature profile, 75sin(t), than for 15sin(t) + 60.”
You: “Of course you will! See above. They both have different peakedness, therefore they each spend a different amount of time above the set point!”
That’s the whole point. Different temperature profiles spend different amounts of time above the base line, hence have different CDD’s even when they have the same maximum temperature. Hence you cannot estimate the CDD from just the maximum temperature.
“I don’t need the minimum.”
You don’t need the minimum, you do need more than the maximum. If you don’t have the minimum you could use the mean derived from the minimum and maximum, or you could use the times of day the temperature went above base line, but you cannot do it with just the maximum.
“To tell where the integration begins all you have to do is evaluate where 15sin(t) + 60 = 65.”
But you can only do this because you know the formula for the temperature profile, which you don’t know if you only have the maximum. It could be 15sin(t) + 60, it could be 5sin(t) + 70, it could be 75sin(t) + 0.
“15sin(t) + 60 = 65 ==> 15sin(t) = 5 ==> sin(t) = .0.3. arcsine(.3) = 0.3 radians.”
Yes, that’s how to do it, as I mentioned five days ago, it’s better to work out the correct transition point rather than treat the sine wave as a straight line.
“Add pi/2 to get the far end of the integration 0.3 + pi/2 = 1.87.”
And there’s your problem. You do not add pi/2 to get the end point. The sine wave is symmetrical about a peak at pi/2. To get the end point subtract the start point from pi. The integral should be from 0.34 to 2.54. I’ve attached a graph showing the two scenarios, you can see from that why your end points are wrong.
“Again, the two functions differ because of the peakedness of the sine wave.”
Which, again, is what I’ve been trying to tell you for the past week.
“That’s the whole point. Different temperature profiles spend different amounts of time above the base line, hence have different CDD’s even when they have the same maximum temperature. Hence you cannot estimate the CDD from just the maximum temperature.
What are you talking about? I’ve done so!
The problem with your graph IS THEY HAVE DIFFERENT INTERVALS! They are *NOT* spread from 0 to pi. One has an interval from about 1.1radians to 2.1 and the other from about .3 to 2.8. If you use the same intervals for both then they will both be exactly congruent.
You don’t find that kind of difference from sunrise to sunset on a daily basis.
Splitting the day into 12 hr segments, 0 to pi, is admittedly an simplifying assumption but if you can get actual sunrise/sunset times from all kinds of almanacs.
“You don’t need the minimum, you do need more than the maximum. If you don’t have the minimum you could use the mean derived from the minimum and maximum, or you could use the times of day the temperature went above base line, but you cannot do it with just the maximum.”
I’ve just shown you that I don’t need any such thing. I need the maximum temp and the set point. I can calculate the difference in area, i.e. the cooling degree-day value, from just those two points. The only other possible factor would be the length of day.
“But you can only do this because you know the formula for the temperature profile, which you don’t know if you only have the maximum.”
How can you say this? If it is a sine function then the profile is fixed, assuming a sine wave. I’ve just showed you how to do it!
“It could be 15sin(t) + 60, it could be 5sin(t) + 70, it could be 75sin(t) + 0.”
So what?
In each case the constant is nothing more than an offset. 5sin(t) + 70 = 75. gives you an offset of 70. Transition that away and you are left with the sine function 5sin(t) = 5.
it *could* be 0sin(t) + 75 = 75. You would still get a temp profile, it would just be a constant 75. If the set point is 65 then the difference in area would be 10pi!
in the case of 75sin(t) + 0 there is an offset of 0.
Each would have a different profile above 65 giving a different calculation for cooling degree-day value.
Again, so what?
“The sine wave is symmetrical about a peak at pi/2. To get the end point subtract the start point from pi. The integral should be from 0.34 to 2.54.”
ok, do your integral and see what you get. I think this is what I did with the 75sin(t) example. Pardon me if the calculator in my head got the actual number wrong.
“Which, again, is what I’ve been trying to tell you for the past week.
f”
No, you haven’t. You’ve been telling me, including in *this* message, that I couldn’t do it. I’ve shown you how you can. Now you are trying to claim that it was all *your idea that you can? ROFL!!
“The problem with your graph IS THEY HAVE DIFFERENT INTERVALS! They are *NOT* spread from 0 to pi.”
I should have made it clearer, but the graph is only showing the portion of the sine wave above the base value of 65. Hence they both go to 10, the value in degrees above 65.
Of course they have different intervals, that’s the whole point. You get different intervals because they have different mid points, and therefore give you different CDD values.
All I’ve done is assume the daily temperature profile is a perfect sine wave going from maximum to minimum and back over a day. Now you’ve introduced the complication of of different sunrise and sunset times, which is just going to make your estimate more complicated.
I assume the way you look at it is the upper portion of the sine wave starts at sunrise and finishes at sunset, whereas the lower portion is a different sine wave going to the minimum during the night. But now you don;t need to know the mean temperature, but the temperature at sunrise and sunset along with the duration.
“I’ve just shown you that I don’t need any such thing. I need the maximum temp and the set point.”
What do you mean by the “set point”? Is it the offset?. Whatever, it shows you do need more than just the maximum temperature.
You keep showing me different temperature profiles all requiring you to know the offset yet seem to think that is something you know without knowing the mean or minimum.
“Again, so what?”
The so what is that if each of your temperature profiles gives a different CDD despite having the same maximum temperature. Therefore you cannot as you keep claiming calculate a CDD knowing just the maximum temperature. I don;t know how much simpler I can make this argument.
“ok, do your integral and see what you get”
I already did, here. I make it 2.54 CDD for the sine wave centered on 60, compared with 1.10 CDD for your one centered on 0.
“No, you haven’t. You’ve been telling me, including in *this* message, that I couldn’t do it. I’ve shown you how you can.”
You cannot do it and guarantee your answer is correct.
“Now you are trying to claim that it was all *your idea that you can? ROFL!!”
No. I’m saying you can calculate a hypothetical CDD for a day with a temperature profile that has a perfect sine wave, but only if you know both the maximum temperature and either the mean, the minimum, or some other value that indicates the offset. You cannot do this knowing just the maximum.
“But the integration is *LESS* uncertain.”
To be clear here, you are saying that you think calculating a CDD using just the maximum temperature and assuming the day follows a sine wave, will give you a more accurate estimate, than making hourly or half hourly readings throughout the day, is that what you are saying?
“That’s why it’s better to do the integration of you can.”
Which raises two questions.
“To be clear here, you are saying that you think calculating a CDD using just the maximum temperature and assuming the day follows a sine wave, will give you a more accurate estimate, than making hourly or half hourly readings throughout the day, is that what you are saying?”
Yes, it’s true. You’ve already learned how to calculate the uncertainty of a sine wave. Why do you keep questioning that?
What do you think multiple measurements do other than describe a curve? Feed those into a wavelet analysis and it will tell you what the frequency components are. If it’s close to a pure sine wave you’ll know.
“When would it ever not be possible to use the sine wave estimate? You only need the maximum and minimum values, which you are more likely to have than hourly, or more, readings.”
Again, you don’t need minimum values for CDD calculation. Because of clouds, fronts, etc, the daytime profile may not be close to a sine wave. The numerical integration will work in that case, even if it has more uncertainty.
“If this is a better method, why do paid for estimates like degreedays.net, not use this method, and insist that their method is better?”
Why indeed. You apparently can’t grasp the concept. How many people sizing HVAC system would? Time is money for an engineer. Better to buy the product than waste time gathering all the data and doing it yourself.
“You’ve already learned how to calculate the uncertainty of a sine wave.”
The uncertainty of a sine wave is not the same as the uncertainty of a CDD calculation. Unless you know what actually happened during the day your estimate is just that. The uncertainty is how far your calculation is likely to be from the actual CDD value.
“What do you think multiple measurements do other than describe a curve?”
I don;t need them to do anything but describe a curve. It’s the estimate of the actual curve you should be interested in.
“Because of clouds, fronts, etc, the daytime profile may not be close to a sine wave. The numerical integration will work in that case, even if it has more uncertainty.”
How do you know any of that has happened if you don’t have the measurements. I’m really puzzled why you’d think that an estimate based on a highly simplified model will be more accurate than actually measuring the temperatures throughout the day. Would you think the global mean temperatures would be better if they were derived from a model using just one temperature reading?
“Why indeed. You apparently can’t grasp the concept. How many people sizing HVAC system would? Time is money for an engineer. Better to buy the product than waste time gathering all the data and doing it yourself.”
You do have a knack for answering a different question to the one I asked. This wasn’t about why people would pay money to get the CDD and HDDs done for them. It was why professional companies like degreedays.net not use your sine method to calculate them? Why do they prefer to measure the actual temperature? They say it’s because it’s the most accurate method.
Here’s my graph of what the CDD area will look like assuming min = -75°F.
The range above 65°F is 1.05 – 2.09 radians, and I make the CDD about 1.1.
Sorry, here’s the graph.
So why would the area in red change if you change the minimum temp?
Change it to -1000F and you will *still* get the same area in red.
It will change because the interception of the sine curve and the base line will change.
Assume the daily temperature profile is defined by
a*sin(t) + m,
where a is the amplitude of the wave, i.e TMax – TMean, and m is TMean.
Then this will intersect with the base line, b, when
a*sin(t) – m = b,
which implies t = arcsin((b – m) / a)
For your original function, a = 75, b = 65 and m = 0, so the first transition point is
arcsin(65 / 75) ~= 1.05.
For you integral, cos(1.05) ~= 0.50.
But if max is 75 and min is -1000 (obviously not possible), then a = 537.5, m = -462.5, and b is still 65. Hence the first transition is
arcsin((65 + 462.5) / 537.5) ~= 1.38, and for your integral you’ll be using
cos(1.38) ~= 0.19.
Here’s a graph showing the difference. Just showing the part above the base line. Red is for a min of -75°F, Blue for minimum of -1000°F.
I’m sure you can do the integrals yourself, but I make the CDD for the -75 to 75 scenario, 1.1 degree-days, whereas for the -1000 to +75 scenario 0.4 degree-days.
I got these both by doing the integrals, and by double checked by taking an average of 1000 time intervals.
“You keep wanting to use the Fallacy of False Analogy to argue that this means you can integrate a daily temperature record using only the maximum value”
No, the problem is that you simply don’t understand the concept of degree-day, just like you don’t understand the concept of integrals.
“You can only get the cos function of a day by knowing both the min and the max.”
I keep trying to convince you that degree-days are used to determine heating and cooling infrastructure sizing. Yet you are unwilling to listen, just like you are unwilling to listen to the fact that combining independent, random variables doesn’t follow the same rules as combining dependent, random variables.
You can argue both till you are blue in the face but all you are doing trying to rationalize your belief to yourself. As Feynman said, you need to stop fooling yourself.
All you do is ignore what I say and throw up non sequiturs.
I say that calculating the area under a sine wave centered on zero is not the same as calculating a cooling degree day when the temperature profile is not centered on zero. Your response is to tell me how cooling degree days are used. I know how they are used and it’s completely irrelevant to the question of how you calculate them..
“You keep using the word combine without specifying how you are combining them.”
I told you how they are combined. I gave you the textbook quotes you requested – YESTERDAY. Have you forgotten so quickly? Selective memory loss perhaps?
———————————-
Consider now a sequence of random variables X1, …, Xn together with some constants a_1, …., a_n and b, and define a new random variable Y to be the linear combination
Y = a_1X1 + … + a_nXn + b
Linear combinations of random variables like this are important in many situations and it is useful to obtain some general results for them.
The expectation of the linear combination is
E(Y) = a_1E(X1) + … + a_nE(Xn) + b
which is just the linear combination of the expectations of the random variables Xi. Furthermore if the random variables X1, …, Xn are independent of one another, then
Var(Y) = a_1^2Var(X1) + … + a_n^2Var(Xn).
Again, notice that the “shift” amount b does not influence the variance of Y and that the coefficients a_i are squared in this expression.
————————————————————-
Show me where the textbook is wrong and show me how combining independent, random measurement values of different things is not a linear combination.
“Firstly, as I keep trying to tell you, you cannot estimate the degree-day for a day using just the maximum value. You need to know the minimum as well in order to determine the amplitude of the wave – hence you still need two uncertain measurements, just as for calculating the mean.”
You are blowing it out your backside. You never bothered to look up the explanation of how the degree-day values are calculated at the web site I gave you!
COOLING degree-day values integrate the temperature curve ABOVE the set point. For sizing air conditioning systems that set point is typically around 65F but it can be anything you want it to be. Tmax is the point of maximum contribution to the integral.
HEATING degree-day values integrate the temperature curve BELOW the set point. Again, for sizing heating systems that set point is typically around 65F but it can be anything you want it to be. Tmin is the point of maximum contribution to the heating degree-day integral
These set points are for occupied buildings. Unoccupied buildings have to have their systems designed for the contents of the building, e.g. a cold storage warehouse or a greenhouse.
Therefore the degree-day values, heating and cooling, will tell you what is happening with the climate at a location. Mid-range values won’t because different Tmax and Tmin values can result in the same mid-range value. Therefore you have no idea of what the climate is at a location when only looking at the mid-range value.
If the temperature profile above and below the set points approximates a sine wave, and most of the time they do, then the uncertainty of integral becomes just the uncertainty of Tmax and Tmin, not the added uncertainty of multiple measurements. I.e. the uncertainty of the integral is u and of the mid-range value is 2u.
Thus the total uncertainty (variance) when combining degree-day values is 1/2 that of combining mid-range values.
Ultimately it doesn’t matter much in reality. If you take 100 degree-day values with an uncertainty of +/- 0.6C and 100 mid-range values with an uncertainty of +/- 1.2C you wind up with a total uncertainty of 6C for the combination of degree-day values and a total uncertainty of 12C for the mid-range values. The uncertainty intervals for both wind up so wide that it is impossible to use them for anything. The trend line for the degree-day values could have either a positive slope or a negative slope and the same thing would apply for the mid-range values. You simply wouldn’t be able to tell!
“You are blowing it out your backside.”
Lets put this to the test. Assume the temperature over the day is a perfect sine wave. Let the base value be 65°F, and lets say the maximum temperature is 75°F. Without knowing what the minimum temperature tell me the CDD for the day.
“Lets put this to the test. Assume the temperature over the day is a perfect sine wave. Let the base value be 65°F, and lets say the maximum temperature is 75°F. Without knowing what the minimum temperature tell me the CDD for the day.”
You *still* don’t understand the concept of degree-day. You either calculate the degree-day value ABOVE a set point (i.e cooling degree-day) or the value BELOW a set point (i.e. heating degree-day).
You can track cooling degree-days or you can track heating degree-days but there is no such thing as a day degree-day!
If you want to calculate the cooling degree-day value then you need to know the baseline and the maximum temp. If you want to calculate the heating degree-day value then you need the baseline and the minimum temp.
But, again, there is no such thing as a day degree-day!
Base value 65F. Tmax = 75F. Got it. You must want to calculate the cooling degree-day value.
First you must define the interval over which the integral will be evaluated.
65F/75F = .87
(.87) 90deg = 78deg, 90deg – 78deg = 12 deg. 90deg + 12deg = 102deg
interval goes from 78deg to 102deg.
this is from 1.36 radians to 1.77 rad
So the integral is:
this becomes
which becomes
(-75)(-0.2) – (-75)(0.2) = 15 + 15 = 30
The cooling degree-day value for this would be 30 cooling degree-day.
.
Since you don’t provide a heating degree-day baseline value or a minimum temp you can’t calculate the heating degree-day value.
The following is taken from a study of natural gas consumption in Turkey
———————————————–
Where
UA is the overall heat coefficient for the building
H = fuel heating value
————————————————-
This is how you use degree-days, as either heating or cooling.
(sorry about the equation formatting. Don’t have my latex quite right)
“You can track cooling degree-days or you can track heating degree-days but there is no such thing as a day degree-day”
I specifically asked what the CDD, i.e. Cooling degree-day value was. I’ve no idea why you think I asked for day degree-day.
“The cooling degree-day value for this would be 30 cooling degree-day.”
What. The maximum is 75°F, the base is 65°F. The temperature is never more than 10°F above the base line, yet you think there are 30 cooling degree-days. This would be equivalent to the entire day being 95°F. It’s simply not possible for there to be more than 10°F.
“I specifically asked what the CDD, i.e. Cooling degree-day value was. I’ve no idea why you think I asked for day degree-day.”
And I showed you how to calculate it.
“What. The maximum is 75°F, the base is 65°F. The temperature is never more than 10°F above the base line, yet you think there are 30 cooling degree-days. This would be equivalent to the entire day being 95°F. It’s simply not possible for there to be more than 10°F.”
You are showing your ignorance of what a degree-day is. It is the area under a curve. I gave you the area under the curve based on the parameters you provided.
If you can find an error in my calculation then show exactly where it is. Otherwise you are just whining because you got an answer you weren’t expecting.
Did you ever get any training in dimensional analysis? I think I’ve covered this with you before. When you find the area under a sample rectangle for the curve of temp vs time you wind up multiplying temp by time, i.e. degree-day (temp * time). What did you think degree-day meant?
If you don’t think my calculation is right then test it yourself. Take a piece of graph paper and trace out a sine wave = 75sin(t) Then use the rectangle procedure to estimate the area.
I *will* tell you that I did make mistake calculating the area. And you already pointed it out in an earlier message. Can you figure out what the error is? I’ll recalculate it tomorrow and reply.
I don’t suppose it ever occurs to you that maybe you are the one who doesn’t understand what a degree-day is.
A degree day, as far as I’m aware is a unit of measurement, representing one degree for a day. In the case of cooling degree days we are measuring how many degree days were above the base value. If it is one degree above the base line for an entire day, that is one degree day. If it is 10 degrees above the baseline for the entire day, that is 10 degree days above the baseline for half the day, and below the baseline for the rest of the day, that is 5 degree days.
Saying it is the are under the curve is meaningless unless you specify what area of the curve represents. If the area under the curve is 12 and the width of the curve is 24, you have to divide the 12 by 24 to get 0.5 degree days. You cannot just say the area under the curve without scaling it to degree days.
If your calculations say that a day that is never more than 0 degrees above the base line has 30 degree days, then that is wrong, and impossibly wrong, just as if you have a curve that has a maximum height of 10 and a width of 1 cannot have an area under it of 30.
I have no need to go through your calculations to know they are wrong because your answer is wrong. I also know it couldn’t possibly be right, because I have only given you some of the information you need. Whatever value you give, I can specify a minimum value that will give a different answer.
I understand dimensional analysis and integration.
The integral of (temp)dt is a degree-time dimension. That is the area under a curve. It’s the height of the curve multiplied by the width of the measurement interval – an area.
“A degree day, as far as I’m aware is a unit of measurement, representing one degree for a day. In the case of cooling degree days we are measuring how many degree days were above the base value. If it is one degree above the base line for an entire day, that is one degree day. If it is 10 degrees above the baseline for the entire day, that is 10 degree days above the baseline for half the day, and below the baseline for the rest of the day, that is 5 degree days.”
What do you think you are calculating? You are calculating AREAS!
1 DEGREE * 1 DAY = 1 degree-day
10 DEGREE * 1 DAY = 10 degree-days.
Height in degrees multiplied by the time interval. An AREA!
In essence you have described a rectangle pulse instead of a sine wave pulse
For a rectangle pulse the integral would be
“I have no need to go through your calculations to know they are wrong because your answer is wrong.”
No, my answer is right when you subtract out the area under the base.
“because I have only given you some of the information you need”
Sorry, you gave me all the info I need.
Please note that in the attached jpg it doesn’t matter what the bottom value is. Both areas involved in the integral use the same bottom value. It could 0K and it wouldn’t matter. The area under the Peak temp would calculated against 0K as would the Base temp. When you subtract the two you get the area between the temp curve and the baseline.
“No, my answer is right when you subtract out the area under the base.”
The operation was a success apart form the patient dying. You claimed the CDD was three times more than it could possibly be, attack me for pointing it out, then say it was only slight issue.
“What do you think you are calculating? You are calculating AREAS!”
But an area is useless unless it it measured in the correct units. You want a measure in degree days, the x axis has to be width 1. If you measure in radians you need to divide the area by 2pi.
And I’ve already pointed out other issues with what you are doing, but the main one again is you cannot know what the sine is like unless you know it’s amplitude, and you don;t know that unless you know either the mean or the minimum. This is Fahrenheit we are using for some reason. 0°F is -17.8°C. How many places in America where the temperature reaches below that for half a day, yet you need to turn the air con on for an hour and a half in the afternoon?
“ You claimed the CDD was three times more than it could possibly be, attack me for pointing it out, then say it was only slight issue.”
I *told* you I forgot to subtract the area under the base! The process works. It is correct. You still haven’t refuted it.
“But an area is useless unless it it measured in the correct units.”
degree-day *is* the proper unit. It is the area between the temp curve and the base value. And it is calculated for a day. That does *NOT* mean that the interval used in the integral has to be a whole day!
“You want a measure in degree days, the x axis has to be width 1. If you measure in radians you need to divide the area by 2pi.”
MALARKY! The units on the x-axis can be anything as long as they extend for the day. And if the temperature is above the selected baseline for only a portion of a day then the area under that portion of the day is the only part of the day that is of interest! It *still* tells you the CDD for the day because that is only part of the day that can contribute to the CDD!
Why do you continue to push that you have to divide by 2pi? That is calculating an average with the unit value of degree, not degree-day!
Again, do your dimensional analysis! Do they not teach that anymore? I learned it in freshman physics and elec. eng!
“And I’ve already pointed out other issues with what you are doing, but the main one again is you cannot know what the sine is like unless you know it’s amplitude, and you don;t know that unless you know either the mean or the minimum.”
You gave me the amplitude when you gave me the maximum value. And then you set a baseline. That is all you need for a CDD calculation.
You do *NOT* need to know the minimum temp. It can be *anything* if you are just calculating CDD!
“I *told* you I forgot to subtract the area under the base!”
Only after you first told me:
“You are showing your ignorance of what a degree-day is. It is the area under a curve.”
If you understood what a degree-day was it should have been obvious from the start that the degree-days for a day when ma temperature was only 10 degrees above the base line could not possibly have been 30.
“degree-day *is* the proper unit.”
Exactly, and my point is what you are measuring are not degree days. The important point of a degree day is that the time unit is a day. That means the time axis of a day goes from 0 to 1, not from 0 to 2pi.
“The units on the x-axis can be anything as long as they extend for the day”
It matters if you call that day 2pi.
“Why do you continue to push that you have to divide by 2pi? That is calculating an average with the unit value of degree, not degree-day!”
You’re measuring over 1 day. The value will be the same if you measure it in degrees or degrees-days.
Here’;s a simple example of how this works. Consider a day that is 1 degree above the base value all day. You have 1 cooling degree day. Hopefully we can agree on that. Now work it out using an integral, but treat the day as going from 0 to 2pi.
Check my workings as you’re the expert at calculus, but I make that 2π – 0 = 2π. So would you say in this example there were 6.3 cooling degree-days?
Checking your math I think just about every part of it is wrong.
You are integrating 75sin(t). That implies the day’s temperature cycle is going from +75°F to -75°F.
You are then finding the interval between the two values you think correspond to the sine wave crossing the base line but this will give you the area all the way to 0°F not the area between the base line and the temperature.
Then, of, course you have forgotten to divide by 2*pi. Which would give you a CDD of about 5.
And I’m not even getting into how you determined the transition periods. You cannot possibly know where they are without knowing the min temperature. For all you know thin value might be 66°F, and there are no transition points.
“You are integrating 75sin(t). That implies the day’s temperature cycle is going from +75°F to -75°F.”
It doesn’t imply that at all.
“You are then finding the interval between the two values you think correspond to the sine wave crossing the base line but this will give you the area all the way to 0°F not the area between the base line and the temperature.”
And the area under the baseline is calculated to the same point. When you subtract the two you get the area above the baseline and below the temperature profile.
2*pi would be used if you are calculating the *average* of the temp profile for a full 1/2 cycle. You aren’t calculating an average, you are calculating a degree-day value. Nor are you integrating a full cycle but only the part of the temp curve that is above the baseline.
“And I’m not even getting into how you determined the transition periods.”
I’m sure you didn’t understand it. But it isn’t hard. You simply determine were the baseline crosses the temp profile.
If the curve is 75sin(t) then where does the curve equal the baseline value of 65?
65/75 = .87
So the crossover point is .87 up the sin curve. (.87)90deg = 78deg
90- 78 = 12. For symmetry the other point would be 90+12 = 102.
In radians 78deg = 1.37 rad and 102deg = 1.77rad.
You could also say that the sin(.87) is 67deg. 90-67 = 23deg. So the opposite point would be 90+23 = 113deg.
I’ll have to think about which method is best. In one method the interval is 78deg to 102deg (1.36rad to 1.77rad) and the other is 67deg to 113deg (1.17rad to 1.97rad). I’m guessing the second method is more correct.
75sin(t) = 65, sin(t) = 65/75 = .87.
therefore t = arcsin(.87) = 67deg.
So the integral would become
the integral of sin(t) = -cos(t)
(-75)cos(1.97) – (-75)cos(1.17) – [(65)(1.97) – (65)(1.17)] =
(-75)(-.39) – (-75)(.39) – (65)(1.97) + (65)(1.17) =
29 + 29 – 128 + 76 = 6 degree-days
My jpg is still correct as far as where the areas lie, the integration limits are just off.
“And the area under the baseline is calculated to the same point. When you subtract the two you get the area above the baseline and below the temperature profile.”
I think the words you are looking for is, “sorry, yes, you were right, it was a simple oversight.”.
“So the crossover point is .87 up the sin curve. (.87)90deg = 78deg”
I don;t suppose it’s ever occurred to you to get out a calculator and see what 75*sin(78) is. Hint, it’s not 65.
“I’ll have to think about which method is best. In one method the interval is 78deg to 102deg (1.36rad to 1.77rad) and the other is 67deg to 113deg (1.17rad to 1.97rad). I’m guessing the second method is more correct.”
It’s closer, it’s still not correct.
I’ve already told you the correct approximate answer, but again all this is irrelevant unless the temperature profile follows a sine wave that hits 0°F half way through.
“29 + 29 – 128 + 76 = 6 degree-days”
You’ve calculated 6 degree-radians.
“I think the words you are looking for is, “sorry, yes, you were right, it was a simple oversight.”.”
I TOLD you I made a mistake and that I would correct it the next day! “
“I don;t suppose it’s ever occurred to you to get out a calculator and see what 75*sin(78) is. Hint, it’s not 65.”
That’s why I converted to using radians. Can’t you read?
BTW, 0.87 * 90 = 78 on every calculator I own.
“I’ve already told you the correct approximate answer, but again all this is irrelevant unless the temperature profile follows a sine wave that hits 0°F half way through.”
As I’ve shown you time after time, minimum temp is irrelevant.
“You’ve calculated 6 degree-radians.”
You can measure time in any way you want. 2pi radians equal one day. And for CDD you don’t need to integrate over the whole 2pi interval, only that portion where the temp curve is higher than the baseline.
““I don;t suppose it’s ever occurred to you to get out a calculator and see what 75*sin(78) is. Hint, it’s not 65.”
That’s why I converted to using radians. Can’t you read?”
In degrees 75*sin(78) = 73.4
In radians 75*sin(1.37) = 73.5
“As I’ve shown you time after time, minimum temp is irrelevant.”
You haven’t “shown” that at all. All you’ve done is calculate the integral using a sine wave centered on zero and claimed that will be the correct value for the CDD.
If you want to show me this is correct, answer my question about what happens if the minimum is 65, or show you get the same result if you convert to centigrade, or show me how this would work if you are calculating the HDD of a day where the minimum is 55°F.
“Furthermore if the random variables X1, …, Xn are independent of one another, then
Var(Y) = a_1^2Var(X1) + … + a_n^2Var(Xn)”
You’re quoting this in defense of your claim that “But that uncertainty [of one measurement] is smaller than the total uncertainty from combining a series of independent, random measurements.”
I assume when you talk about combining a series of independent measurements you mean you mean combining to make an average.
So how does the above equation work in that case?
All the X’s are from the same population so the same random variable with variance = Var(X), and in order to make a mean Y, we can add all the Xs together multiplying by all the a_i’s, where each is equal to 1/n.
So
Var(Y) = a_1^2Var(X1) + … + a_n^2Var(Xn)
is
simplifies to
which means
Which is once again the formula for the standard error of the mean. Is that the point you want me to take from this text book?
“All the X’s are from the same population”
Each X, at least in our case, represents an independent and random population. You form a new population by combining them all together. In which case the variance of each independent and random population adds to the total variance.
Since the variance in our single, random, independent measurements is represented by the uncertainty interval for that measurement, the uncertainties add just like the variances would.
The variance gets bigger and bigger each time you add a new independent, random population of 1.
“The variance gets bigger and bigger each time you add a new independent, random population of 1”
This is why I keep asking for you to be specific about what you mean by adding. The equation you gave is about summing different variables. It’s just the standard way uncertainties propagate when you add independent measurements. The standard deviation of the sum is equal to the square root of the sum of the squared uncertainties.
But when you talk about adding new populations together it seems like you are saying the variance in the population of the union of all these random populations increases, which is not necessarily true.
“But when you talk about adding new populations together it seems like you are saying the variance in the population of the union of all these random populations increases, which is not necessarily true.”
Of course it’s true. Why do you think I took the time to type in that quote from the textbook and giving you all the links stating such as well?
So if I have a population following a normal distribution with mean 0 and sd 10, and I group them with a population with a mean of 0 and sd of 10, the sd of the union will be sqrt(200) ~= 14?
But if I combine two populations one with a mean of 0 and sd of 10, with another population with mean of 2000 and sd 10, the combined sd will also be 14?
“So if I have a population following a normal distribution with mean 0 and sd 10, and I group them with a population with a mean of 0 and sd of 10, the sd of the union will be sqrt(200) ~= 14?”
First, when you have independent, random measurements of different things there is *NO* normal distribution for each element and no sd. You have an uncertainty interval for each measurement which has no probability distribution.
Second, if the populations are independent and random then you get
sd1^2 + sd2^2 as the combined variance. So yes, the variance becomes 200 and the sd is the sqrt(200) = 14.
“But if I combine two populations one with a mean of 0 and sd of 10, with another population with mean of 2000 and sd 10, the combined sd will also be 14?
Yes. Why is this so surprising for independent, random variables?
Mean_total = Mean1 + Mean2 = 2000
Var_t = Var1 + Var2
sd_t = sqrt(Var_t)
Think about it. Why does the mean matter? I suspect you haven’t normalized one of the populations. How do you get a mean of 0? That tells me that either all values in the population are zero or you have negative and positive values, i.e. a population surrounding 0. For the mean of 2000 with an sd of 10 you probably have a population that has most elements close to the 2000 mean. Thus you wind up with a double-hump (which are widely separated) distribution when you combine them. Statistical analysis of such a distribution indicates that you either have two different population that really shouldn’t be combined or that you have some kind of a sinusoid variable where the two populations are measurements taken at different points on the sinusoid. (that’s also part of the problem of doing trend lines on temperatures which are driven by cyclical forces)
“ all the a_i’s, where each is equal to 1/n”
Who says they are all equal to 1/n? That is an assumption *YOU* are making. The a_i’s are also independent of each other in the general case. a_1 doesn’t determine a_2 and vice versa. There is nothing in the general case that makes them equal. Just like in independent, random measurements there is nothing that makes the uncertainties equal for each measurement. That’s just done in the writing to make the concept simpler and easier to follow.
In fact, for individual, random measurements of different things we can assume that the constants are 1. Uncertainty is *not* a constant factor applied to each measurement by multiplication. And we have no reason to assume that each measurement is multiplied by anything other than 1.
The constants do not represent the number of elements in each individual, random population. And even if they did the population size for each individual, random measurement of different things have a population size of 1, again implying that a_1 to a_n is equal to 1.
“Which is once again the formula for the standard error of the mean. Is that the point you want me to take from this text book?”
Why do you think each individual constant is equal and is equal to 1/n? The book just said they are constants – period.
If they were all equal and equal to 1/n why wouldn’t the author have just written aX_1 + aX_2 + …. + aX_n? Or even X_1/n + X_2/n + …. + X_n/n?
You are doing the same thing the climate scientists do in their models, picking parameter constants to make the model output come out to be what they want it to be!
“Why do you think each individual constant is equal and is equal to 1/n?”
Because I’m using that equation to show what happens when you apply it to calculating the mean.
The euation is just showing what happens when you add random variables together weighted by different constants. I’m just applying it to our old friend the uncertainty of the mean.
The stated values are not the uncertainties, i.e. the X’s! The uncertainties are the VARIANCES, i.e. the uncertainty, of the stated values.
You do *not* find the average of the variances when you find the average of the stated values!
I don’t think you read the textbook quote I provided you at all.
if: Y = a_1X1 + … + a_nXn
then
VAR(Y) = a_1^2Var(X1) + … a_n^2Var(Xn)
I’ve highlighted the term VAR for you. You do *not* average the VAR to determine the mean of a data population!
Which is exactly the equation I used. Adding the variances together scaled by 1/n and your equation leads to the equation for the standard error of the mean.
“Which is exactly the equation I used.”
NO! It isn’t. You don’t average variances. The sum of the variances *is* the sum of the variances. You don’t average variances to get some kind of other metric.
You average the VALUES, Xn, not the VAR(Xn). The variance of the population *is* the variance of the population, not the average of the variance.
The mean inherits the total variance of the population which also describes how accurate the mean is. I gave you the reference confirming this, even for multiple measurements of the same thing. The wider the variance the less accurate the mean is. The mean may be more precise the more elements you have but that doesn’t mean it is more accurate!
You are right on the edge of understanding the difference between the uncertainty of the mean and the standard error of the mean. Take the leap!
“Second, you still don’t seem to have any idea about how degree-days are calculated. You can approximate the value by using just the max and min values, but that’s not what is meant by the integral method. What’s meant by integrating is taking the average of multiple readings throughout the day.”
You don’t average multiple readings throughout the day! Although they use the word “average” in their description, that is *NOT* what they actually do.
Some of the integration is done numerically. You divide the overall time period into segments, typically how often the measuring stations provides a measurement.
You then draw a horizontal line across the temperature curve at the set point. If you are doing cooling degree-days then you determine the points on the temperature curve that are above that set point. You then can form “rectangles” with a bottom as the set point line and the top as a tilted line between the temp point at the start of the segment and the end of the segment and the vertical sides as the segment beginning and end.
The height of the rectangle is assumed to be the mid-point between the start and end temp. If you draw that out on a graph you hope basically get two triangles at the top of the rectangle if you draw a horizontal line at the mid-point value. If you are working on the positive slope of the curve then you will have a triangle below the horizontal line from the mid-point to the start temp. You will have a triangle above the horizontal line at the mid-point from the mid-point to the end temp. The hope is that the two triangles will cancel and the actual area of the rectangle is the mid-point value (i.e. the height) times the width of the segment. Basic geometry. You then add up the areas of all the rectangles to get the total area. The more often you get temp data the narrower the rectangle will be. In the limit the segment size will be ‘dt’. Thus you get the sum of the areas by doing an integral
where ‘s’ is the time at the start of the curve above the set point and ‘e’ is the time at the end of the curve above the set point.
At no point do you “average’ temperature values. A degree-day integral is the area under the curve, not the average of the temperature values.
You seem to have a fundamental misunderstanding of what a degree-day is and what it is used for. It appears you need more education on what an average is and what an integral is.
“The hope is that the two triangles will cancel and the actual area of the rectangle is the mid-point value (i.e. the height) times the width of the segment. Basic geometry. You then add up the areas of all the rectangles to get the total area.”
Adding up rectangles each the width of a fraction of a day. What does that remind you of?
“At no point do you “average’ temperature values.”
I’m having hard time understanding how you cannot see that everything you have described is effectively averaging temperature values, just as they say.
The only difference between the method described and simply taking 24 hourly readings, subtracting the base line and averaging them, is that using interpolation gets a slightly more accurate value for when the temperature crosses the line, they take 25 hourly readings, and it can correct for variable times readings.
But in essence all you are doing are calculating the area of 24 rectangles each of which is the height of a temperature and has a width of 1/24 of a day, adding them together and getting the average daily temperature above the line. In this method each hours height is the average of the two temperatures either side, but that just means all but the first and last reading cancel out. I’m really not sure what part of this makes you think it is not an average. Is it the idea that the temperatures are divided by 24 before being added, rather than added before being divided?
In any case, it makes no odds. The fact is that in the method described you have multiple temperature readings each with an uncertainty, which may or may not be independent, and you will have to deal with how uncertainties propagate when you add or average them.
“Thus you get the sum of the areas by doing an integral”
Maybe this is the bit that’s confusing you. You are not getting the sum of the areas by doing an integral. You are approximating the integral by adding rectangles. You could only do the integral if you had the function of the daily profile. If you are assuming it is a sine wave then you are just back to the approximate methods, and all those temperature measurements you took throughout the day were a waste of time.
“Adding up rectangles each the width of a fraction of a day. What does that remind you of?”
It’s an approximate integral, i.e. the AREA UNDER THE CURVE.
It is *NOT* an average of all the temperatures on the curve.
“I’m having hard time understanding how you cannot see that everything you have described is effectively averaging temperature values, just as they say.”
You *TRULY* do not understand integrals!
When you multiply the height of a rectangle by its width you get an AREA, not an average value. You get a SUM of the areas when you integrate over an interval. For a calculated integral you assume the width of the rectangles, in the limit, becomes ‘dx’.
Do a dimensional analysis if you have to. Assume the height and width of the rectangles are given in cm. H x W gives cm^2 – an AREA. You then sum all those rectangles and get a value with the dimension of cm^2. An average of values would have a dimension of cm, not cm^2!
Now our y-values are in temperature (use ‘degree‘) as the dimension. The x-value is in time. When you multiply degree by time you get a dimension of degree–time. An average of the y-values would give you a dimension of degree.
Look at the integral:
Dsin(t) is in degrees and dt is in time. When you multiply the two you get degree-time as the dimension of the result.
When you integrate from a to b you are adding up all the areas between a and b made up of the products of Dsin(t) times dt.
This is basic calculus. Get a Schaum’s Outline for Calculus.
If your rectangle has a width of 1 hour, it has a width of 1/24 of a day. There is no difference between summing all the heights of the rectangles and dividing by 24, and multiplying the height of each rectangle by 1/24 and summing the results.
The units don’t matter. If you calculate the average temperature for a day over a base line, you have the result in degree days. If you work out the average for a month and multiply you have the total cooling degree-days for that month.
And frankly none of this matters, because the real point you keep hiding from is that in order to calculate the precise CDD of HDD you are taking multiple measurements and combining them. Which in your view should increase the uncertainty.
“But in essence all you are doing are calculating the area of 24 rectangles each of which is the height of a temperature and has a width of 1/24 of a day, adding them together and getting the average daily temperature above the line.”
How are you getting an average? An integral is a SUM of the areas, not an average of the areas! You even admit that you are getting an area, see the bolded word above (bolding mine, tpg)
How do you think you are calculating the area of a rectangle? What do you think the width of the rectangle is? What happens to the width as you increase the number of rectangles?
“In any case, it makes no odds.”
OF COURSE IT MAKES A DIFFERENCE! Again, HVAC engineers don’t use an average temp, they use an integral – the area under the curve!
“The fact is that in the method described you have multiple temperature readings each with an uncertainty, which may or may not be independent, and you will have to deal with how uncertainties propagate when you add or average them.”
Geometric integration is just one method. If the temp curve is a sine wave then you can just use the max value in the integral. And, as you admit, this gives you *less* uncertainty!
“You are not getting the sum of the areas by doing an integral.”
Please. I had integrals coming out my dark regions in my electrical engineering courses. From a freshman to a senior integrals were all we did (other than differential equations which I hate to this day). One-dimensional integrals, two dimension integrals, 3-d vector integrals, integrals in polar coordinates, etc.
You *are* getting the area under the curve when you do an integral. That’s what (value x interval) gives you – an area.
“If you want to know the uncertainty of a degree-day estimate, you need to say what method is being used.”
I gave this to you already. What is the uncertainty of the integral of Acos(x)
That is perfectly defined. And, as I pointed out, Taylor tells you how to evaluate this.
“One method is to estimate it from max and min values, maybe using a formula assuming the day follows a sine wave.”
You don’t have to “estimate” it. Open up Taylor and read it for meaning.
“In the first case the uncertainty will depend on how good the measurements of max and min are, but also on how good the assumption of the daily cycle is.”
You are getting closer but aren’t there yet.
“Another is to take lots of measurements throughout the day and work out the average from them, possibly using some interpolation to handle the transition periods.:”
This describes how you integrate a function numerically, not how you evaluate the uncertainty of the integral value.
” If they are taken every minute and if the errors are independent, an if the uncertainty of the thermometer is 0.5°C, you could say the measurement uncertainty is 0.5 / sqrt(24*60) ~= 0.01″
Nope. This is the uncertainty of the mean, not the uncertainty of the population propagated to the mean. If all the measurements are independent and random (which they would be) then their variances add when you combine them. Since the variance and the uncertainty interval are related the total uncertainty would sqrt(24*60) x 0.5 (assuming there is *some* cancellation of the uncertainty – i.e. use root-sum-square to add them).
But this *still* isn’t the integral of the temperature curve versus time.
You are still running away from the issue. What is the uncertainty of the integral of the temperature vs time curve? How does it compare to the sum of the variances of the measurements? Stop hiding behind trying to list out all the possible uncertainties that combine to generate the uncertainty estimate for each value.
“I gave this to you already. What is the uncertainty of the integral of Acos(x)”
What has that equation got to do with determining degree days? Are you still on to your multiply max by 0.63 to get the average?
“You don’t have to “estimate” it. Open up Taylor and read it for meaning”
Once again, rather than provide an explanation, you expect me to trawl through an entire text book, which on past form will say you are wrong, and you’ll then spend the next few days trying to convince me I didn’t understand what Taylor said.
“You are getting closer but aren’t there yet”
You missed of the bit where you explain why I’m wrong.
“This describes how you integrate a function numerically, not how you evaluate the uncertainty of the integral value.”
It describes how you approximate an integral, not calculate it.
“Nope. This is the uncertainty of the mean, not the uncertainty of the population propagated to the mean.”
You asked about the uncertainty of calculating degree days, that’s what they are using this method. The mean of temperatures taking every minute, minus the base value, treating negative values as 0.
“Stop hiding behind trying to list out all the possible uncertainties that combine to generate the uncertainty estimate for each value.”
Here’s an idea. Rather than treating this like some form of paper chase, with increasingly baffling clues, why don;t you just explain what you are getting at and let me tell you why you are wrong.
“What has that equation got to do with determining degree days? Are you still on to your multiply max by 0.63 to get the average?”
Degree-day values ARE the integral of the temperature profile above/below a set point. A degree-day is *NOT* an average. It is solely the area under the curve. We’ve bee over this a couple of times already.
“Once again, rather than provide an explanation, you expect me to trawl through an entire text book, which on past form will say you are wrong, and you’ll then spend the next few days trying to convince me I didn’t understand what Taylor said.”
Taylor has *NEVER* said I am wrong. Not on anything. The only one that has been wrong on this is you trying to keep on saying that the uncertainty of independent, random values is divided by the number of values used. I have now given you any number of references, including a textbook reference and a dissertation from Howard Castrup, Ph.D that show you are wrong. When combining independent, random variables, their variances add. And variance is directly related to the uncertainty of a population, including the mean of the population.
If you don’t take the time learn the subject then nothing I say can convince you.
“You missed of the bit where you explain why I’m wrong.”
Because you needed to work it out on your own. You never believe what I tell you, not even when I provide a reference supporting my assertion.
“It describes how you approximate an integral, not calculate it.”
And, as I said, it still didn’t say how to evaluate the uncertainty of an integral!
“You asked about the uncertainty of calculating degree days, that’s what they are using this method. The mean of temperatures taking every minute, minus the base value, treating negative values as 0.”
And *still* no calculation of the actual uncertainty!
“Here’s an idea. Rather than treating this like some form of paper chase, with increasingly baffling clues, why don;t you just explain what you are getting at and let me tell you why you are wrong.”
No baffling clues. References from a textbook and a dissertation plus numerous links to internet references. If you don’t read them you’ll never learn why you are wrong. Like you keeping on trying to claim that variances don’t add when you combine independent, random variables. Or you claiming that variance is not a measure of the uncertainty of a population and therefore of the mean itself.
I’ve told you these over and over and over and over again and you continue to fall back on claiming that how precisely you can calculate the mean somehow determines the uncertainty of the population which determines how accurate the mean actually is.
You even still seem to believe that the mean of a combination of independent, random measurements of different things somehow gives you a “true value” that exists in our physical reality.
“You even still seem to believe that the mean of a combination of independent, random measurements of different things somehow gives you a “true value” that exists in our physical reality. ”
An average doesn’t have to exist in our physical reality to be true. Three number 5 doesn’t exist in reality but is a true value. I’ve never throw a fraction with a die, but the true mean of a perfect 6 sided one is 3.5. The value of my bank account doesn’t exist in our physical reality, but I trust it’s a true value.
“An average doesn’t have to exist in our physical reality to be true.”
As I have pointed out multiple times, if the average doesn’t exist in physical reality then it is useless. If I average the length of ten 2′ boards and twenty 10′ boards I *will* get an average. That average won’t exist in reality. I won’t be able to find a board in the population that is the length of the average. That average won’t help me lay out the framing for a new room in a house.
It’s the same with the GAT. It’s useless. It gives no hint as to the cause of any change. It can’t be measured. It gives no information as to how climate is changing. It’s useless for anything.
” true mean” “true value”
You are mixing things up in order to somehow support your conclusion that a non-existent average is somehow useful. Stop it.
Keeping pointing something out is useless if the thing you are pointing out is wrong. What exactly do you mean by existing in physical reality? Does it have to be tangible or can it be a concept. Does the speed of sound at a specific temperature, air pressure etc, exist in physical reality? Does the expected roll of a 6 sided die exist in physical reality? Do imaginary numbers exist in physical reality?
“Climate is determined by the WHOLE temperature profile…”
Climate is determined by a whole load of details that are not seen in a temperature profile. Rain, sun, wind etc. That does not mean you cannot look at one aspect of climate, e.g. mean temperature. If that’s changing than the climate is changing. If it is not changing, it’s still possible that the climate is changing, just not in the mean temperature.
Mean temperature is *NOT* an aspect of climate, especially when it is an anomaly!
Mean temperatures don’t tell you if the climate is changing. Again, these are MID-RANGE temperatures and all kinds of different temperature profiles can give you the same mid-range value. And when you are trying to discern a 0.01C difference from a mean that has an uncertainty greater than 0.5C it is a futile, idiotic pursuit.
Different temperature profiles can give you the same mean value, but the same temperature profile cannot give you different mean values. Hence a change in the mean implies a change in the temperature profile.
“Different temperature profiles can give you the same mean value, but the same temperature profile cannot give you different mean values. Hence a change in the mean implies a change in the temperature profile.”
So what *is* the change in the temperature profile? If you don’t know what the change is then how can you react to it?
If you assume that an increase in the mean implies maximum temperatures are going up, as does Greta, the AGW zealots, and John Kerry, then how can their reactions be of any use when the mean is going up because minimum temps are going up while maximum temps are stagnating?
If you don’t know what the cause is then you may as well not even know that there is a change. Otherwise you’ll just be running around like a chicken with its head cut off while carrying a sign saying “The End is Near!”
“So what *is* the change in the temperature profile? If you don’t know what the change is then how can you react to it?”
Here’s the strange thing about calculating summary statistics. It doesn’t destroy the original data. It doesn’t stop you looking at other data. A global mean average is the start of the process not the end.
Do the politicians listening to the AGW alarmists trumpeting that the Earth is going to burn up ever actually look up the base data to see if the max temps are going up or min temps are going up – each of which will raise the mid-range values and the anomalies?
Do *any* of the climate models spit out forecasts of minimum and maximum temps?
Again, the mid-range average, which is what most people have access to, is useless for anything other than greedy scientists to use in getting more and more grant money from gullible politicians by using scare tactics.
More and more people are asking every day why the scary forecast by the climate scientists never come to fruition. The Arctic ice isn’t gone, the Himalayan glaciers haven’t melted away, the polar bears haven’t gone extinct, massive global crop failures haven’t happened, NYC and Miami aren’t underwater, tornado occurrences haven’t skyrocketed, etc, etc, etc.
Each and every one of these based on the assumption that the GAT going up means the earth is going to turn into a cinder from ever higher maximum temperatures.
The GAT is *not* the start of a SCIENTIFIC process, it is the start of a political process by people looking for power and money.
“Have you managed to figure out why 0.63 x TMAX is not the same as the daily average yet, or do I have to show you again.”
.63 x Tmax *is* the daytime/nighttime temperature average. The *average* value of a sine wave *is* .63 x Xmax or .63 x Xmin. You’ve never shown any different.
X_avg = (1/pi) integral[ X * sin(t)] from 0 to pi. = .63 x X.
You’ve never shown any different.
“that doesn’t mean you cannot tell a lot about what the temperatures are doing by comparing just the TMEAN.”
If different Tmax and Tmin values can give the same TMEAN then how can you tell a lot about what temperatures are doing from the TMEAN value? And it’s even worse with anomalies. If Point Barrow and Miami can give the same anomaly value then what does the anomaly tell you about what temperatures are doing?
I’ve shown you in numerous ways why you are wrong but you you seem to have a blind spot about anything involving mean daily temperatures, not helped by your confusing and shifting use of language. Let me try again.
Your equation
X_avg = (1/pi) integral[ X * sin(t)] from 0 to pi. = .63 x X.
is correct, but only if the mid range temperature for the day is 0. This is not usually the case. The correct equation for a daily temperature cycle, assuming it’s a perfect sine wave, is
(TMax – TMean) * sin(t) + TMean
And as I’ve shown before, your integral then results in
0.63 * (TMax – TMean) * sin(t) + TMean
This still leaves the question of what you mean by “daytime”. Using your integral from 0 to pi, it is just the period of the day that is above the average.
ROFL!! No.
It evaluates to .63(Tmax-Tmean) + Tmean
This simplifies to .63Tmax – .63Tmean + Tmean so you get
.63Tmax + .37Tmean) as the average value.
“This still leaves the question of what you mean by “daytime”. Using your integral from 0 to pi, it is just the period of the day that is above the average”
No, see above.
Sorry, yes, that was a mistake. I meant as I’ve told you many times before
0.63 * (TMax – TMean) + TMean
Now are you accepting that is correct, simplified however you want, and your 0.63 * TMax is wrong?
“No, see above.”
See what above? There are always hundreds of lines of comments from you, I’m not rereading all of them to see how you define daytime.
You *still* can’t get it right, even when I show you.
“.63Tmax + .37Tmean
All you did was add in an offset. That doesn’t change the fact that the average is not the same thing as the mean!
You’ve just quoted my equation, which is different to your 0.63 * tmax, and then said I cannot get it right.
Yes it’s adding an offset, that’s why your equation is wrong. And that offset depends on knowing the mean temperature which in tern requires knowing both the max and the min values.
Actually you do *NOT* need to know the mean. The offset can be anything. That’s how degree-days are calculated to size HVAC systems. You integrate the curve below 65F and above 65F. One tells you how much heating you must provide to stay comfortable and the other how much cooling you need to stay comfortable.
No mean value needed at all!
You do if you want the correct value. You cannot just add any offset, the range between the mean and max determine the amplitude of the wave. If you don’t know that you don;t know how much of it was above the base line.
You’re the one who keeps insisting that if you only know the mean you know nothing about the temperature profile. How do you expect to know what the profile is if you only have the maximum?
“You do if you want the correct value.”
Nope. If you want to know what is happening to the climate then you can pick set points that allow that. There is no physical requirement to know the mean temp. If there were such a physical reason then engineers sizing HVAC systems would also need to know the mean. The fact is that they don’t. HVAC systems are sized to meet the climate at a location, not to meet the mean temperature.
“If different Tmax and Tmin values can give the same TMEAN then how can you tell a lot about what temperatures are doing from the TMEAN value?”
In another post, it’s being claimed that Tokyp had it’s coldest September in 30 years using just the mean Tokyo temperature. I’ve also pointed out the UAH mean temperature shows September as being above average, again using the mean temperatures.
Does this tell anyone the whole story? No. But it does suggest that September as a whole was warm, but it was cold in Japan.
“Does this tell anyone the whole story? No. But it does suggest that September as a whole was warm, but it was cold in Japan.”
No. You simply don’t know where was warm and where was cold. Where on the globe was it enough warmer to offset the Japan cold? Everywhere? Doubtful.
Was the uncertainty even exceeded sufficiently so you *know* that Japan was colder than average?
We’ll know when UAH publish their map for September, but it’s good to see you being skeptical of the claim that Tokyo had it’s coldest September in 33 years. Maybe you could have explained that in the comments on that article.
I just wanted to chime in here regarding the Tmin/Tmax discussion. I know one of your earlier concerns was that traditional datasets could be wrong or at least introduce a bias because they only use Tmin/Tmax and so don’t take into account diurnal or other temporal variations. That is a fair criticism. It is important to note, however, that ERA5 provides hourly grids with subhourly timesteps. The 1979-present warming trend is +0.190 C/decade as compared to GISTEMP’s +0.188 C/decade, BEST’s +0.193 C/decade, and HadCRUT’s +0.191 C/decade. So it seems like temporal variance has not introduced a substantial bias either way here.
“That is a fair criticism. It is important to note, however, that ERA5 provides hourly grids with subhourly timesteps.”
Thus the values you calculate have the dimension of Temp/Time, where Time is hourly or sub-hourly.
What does a mean with the dimension of Temp/Time actually tell you?
If you plot distance versus time of the function V = Vmax * sin(t) then what is the average of V? Is it a mid-range value? Is it .63Vmax (i.e. the integral of the curve)?
Same with the time dependent temperature function.
if T = (Tmax-Tmean)sin(t) + Tmean
then what is the average value? It remains a non-stationary function unless you do something to make it stationary. Trending a non-stationary function is a fools errand.
Part 3
“You keep confusing precision and accuracy.”
You keep saying that whilst ignoring all the times I explain to you the difference.
“If your mean turns out to be a repeating decimal does that imply the mean is infinitely precise?”
And now you are confusing different types of precision. The precision I’m talking about precision of measurement, that has nothing directly to do with how many decimal places you calculate. Measurement precision is how close repeated measurements will be to each other. You can measure something to 100 decimal places and it won’t make it more precise if the next time you measure it the result differs by 0.5.
“If the standard deviation of a population resembles how uncertain the mean of that population is…”
It doesn’t and you keep confusing this distinction. The uncertainty of the mean is how close it is likely to be to the actual mean. The standard deviation of the population is how close any random sample from that population is likely to be to the mean of that population. It’s a measure of how uncertain an individual sample is as an indicator of the mean, not a measure of how uncertain the mean is.
“and if variances add when combining individual, random populations then how does the standard deviation of the population not increase?”
And now I think you are confusing the word “add”.
If you add, in the sense of summing, a number of different measurements, the uncertainty of the sum will increase. But if you add, in the sense of a union action, a number of different populations the standard deviation of the combined population will not necessarily increase, and not in the same way that summing them does. In particular combing populations with the same distribution will not generally increase the standard deviation.
“Your “uncertainty of the mean” is a measure of how precisely you have calculated the mean.”
Again the terminology gets confusing. I would say it isn’t a measure of how precisely the mean has been calculated, more a measure of how precise the calculated mean is.
“That is *not* the standard deviation of the population which indicates how accurate the mean truly is.”
Indeed it’s not and I’m not sure why you keep confusing the two. I’m guessing that what you are trying to say, is that the standard deviation of the population is how you want to define the uncertainty of the mean. I find this a confusing definition, which doesn’t reflect the term or the measurement uncertainty we were original talking about.
If I say I’ve calculated the mean from and give you an uncertainty value, I would assume the uncertainty related to how certain I was that the mean was correct, not how certain I was that a random sample would be close to that mean.
“You keep saying that whilst ignoring all the times I explain to you the difference.”
You don’t understand the difference so how can you explain it?
Even using a micrometer to measure the diameter of a crankshaft journal instead of a meter stick still leaves you with the uncertainty associated with the micrometer. The micrometer is capable of higher precision but that doesn’t translate into eliminating uncertainty.
“And now you are confusing different types of precision. The precision I’m talking about precision of measurement, that has nothing directly to do with how many decimal places you calculate.”
Again, precision doesn’t eliminate uncertainty! And I thought you believed that the more samples you have the more precisely you can calculate a mean, isn’t that what decreasing the standard deviation of the mean implies?
“Measurement precision is how close repeated measurements will be to each other. You can measure something to 100 decimal places and it won’t make it more precise if the next time you measure it the result differs by 0.5.” (bolding mine, tpg)
And now we are back to multiple measurements of the same thing which form a random probability distribution around a true value.
How many times must it be pointed out to you that you cannot make multiple measurements of a temperature? Temperature is a time function and unless you have a time machine you can’t go back and re-measure a temperature. That makes each measurement an independent, random measurement of a different thing – which does *NOT* generate a random probability distribution around a true value!
“t doesn’t and you keep confusing this distinction. The uncertainty of the mean is how close it is likely to be to the actual mean.”
“the actual mean”? Are you implying that is a TRUE VALUE? That is, again, only true if you have multiple measurements of the same thing. There is no “actual” mean of a conglomeration of a random, independent variables, such a data set does *not* define a true value of anything!
“The standard deviation of the population is how close any random sample from that population is likely to be to the mean of that population.”
Malarky! The 68-95-99.7 rule implies that 68% of all values of a normally distributed variable are within one sigma from the mean. 95% are within two sigmas. These represent a confidence interval, i.e. the uncertainty interval for a population.
“Malarky! The 68-95-99.7 rule implies that 68% of all values of a normally distributed variable are within one sigma from the mean. 95% are within two sigmas. These represent a confidence interval, i.e. the uncertainty interval for a population.”
I’ve mentioned it else where, but you are confusing the confidence interval of the mean with the prediction interval.
I am not confusing anything.
A prediction interval is where you expect a future value to fall. That is the *exact* same thing as a confidence interval.
The confidence interval of the mean is *NOT* the confidence interval of the population. Nor is it the prediction interval for a future value a population.
“f you add, in the sense of summing, a number of different measurements, the uncertainty of the sum will increase. But if you add, in the sense of a union action, a number of different populations the standard deviation of the combined population will not necessarily increase, and not in the same way that summing them does. In particular combing populations with the same distribution will not generally increase the standard deviation.”
Again, more malarky! The RULE for combining independent, random populations is that you ADD VARIANCES. Combining is *not* a sum. It is creating a new data set, i.e. a *union* action. If the variance of the component populations add then the standard deviation of the combined population has to increase as well.
“Indeed it’s not and I’m not sure why you keep confusing the two. I’m guessing that what you are trying to say, is that the standard deviation of the population is how you want to define the uncertainty of the mean. “
The standard deviation of the population is a measure of the accuracy of the calculated mean.
Go here: http://www.isgmax.com/Articles_Papers/Estimating%20and%20Combining%20Uncertainties.pdf
While this article is a dissertation concerned with uncertainty is multiple measurements of the same thing, it also defines the uncertainty of the population mean as the standard deviation.
“We have seen that the uncertainty in a measured value x is a measure of the extent that values of x are spread around the expectation value 〈x〉. Another way of saying this is that the more spread out the distribution around 〈x〉, the larger the uncertainty”
” In addition, we can easily see that, if a distribution is widely spread, the mean square error will be large. Conversely, if a distribution is tightly grouped, the mean square error will be small. “(bolding mine, tpg).
This is talking about the standard deviation of the population around the mean, not the standard deviation of the mean. They *are* two different things.
When you combine independent, random variables, the variances add. Therefore the standard deviations do as well – meaning the spread of the distribution gets larger. Therefore the uncertainty goes up as well.
“If I say I’ve calculated the mean from and give you an uncertainty value, I would assume the uncertainty related to how certain I was that the mean was correct, not how certain I was that a random sample would be close to that mean.”
This is not how uncertainty is handled in physical science.
“The RULE for combining independent, random populations is that you ADD VARIANCES.”
Show me the text book that claims that is a rule, and then I’ll explain why it’s wrong.
“While this article is a dissertation concerned with uncertainty is multiple measurements of the same thing, it also defines the uncertainty of the population mean as the standard deviation.”
Sorry, but as far as I can see that dissertation says nothing about the uncertainty of a mean. It’s only talking about the uncertainty of single measurements.
“This is talking about the standard deviation of the population around the mean, not the standard deviation of the mean. They *are* two different things.”
Yes that’s always been the point, they are two different things. I say the uncertainty of a mean is a measure of how certain we are that the mean is correct, and you seem to be saying it’s a measure of how good a predictor of an individual sample it is. This is the difference between a confidence interval and a prediction interval.
But even if you take your definition as correct it still doesn’t justify your claim that the uncertainty increases with the square root of the sample size.
“When you combine independent, random variables, the variances add.”
Once again, no they don’t. And you still need to be clear if you are talking about measurement variations or sample variations.
“Show me the text book that claims that is a rule, and then I’ll explain why it’s wrong.”
I’ve done this at least twice but you won’t seem to accept it.
“Probability and Statistics for Engineers and Scientists”, Anthony Hayter, 2nd Edition, Pages 144 and 145:
————————–
The expectation of the sum of two random variables is equal to the sum of expectations of the two random variables.
Also, in genral,
Var(X1 + X2) = Var(X1) + Var(X2) + 2Cov(X1,X2)
Notice that if the two random variables are independent so that their covariance is zero, then the variance of their sum is equal to the sum of their variances.
The variance of the sum of two independent, random variables is equal to the sum of the variances of the two random variables. (original text is italicized, tpg)
————————————————————————
If, in addition, the random variables are independent then
Var(a1X2. + … + anXn + b) = a1^2Var(X1) + … + an^2Var(Xn)
———————————————————————-
go here: https://www.khanacademy.org/math/ap-statistics/random-variables-ap/combining-random-variables/a/combining-random-variables-article
go here: https://math.stackexchange.com/questions/115518/determining-variance-from-sum-of-two-random-correlated-variables
————————————————
from http://www.stat.yale.edu/Courses/1997-98/101/rvmnvar.htm
For independent random variables X and Y, the variance of their sum or difference is the sum of their variances
Variances are added for both the sum and difference of two independent random variables because the variation in each variable contributes to the variation in each case
————————————————————
go here: http://www.stat.yale.edu/~pollard/Courses/241.fall97/Variance.pdf
Temperature measurements such as Tmax and Tmin *are* independent and random and they are not correlated. When you combine these their variances (i.e. uncertainty) add. It’s *exactly* what Taylor covers in his first three chapters.
“Sorry, but as far as I can see that dissertation says nothing about the uncertainty of a mean. It’s only talking about the uncertainty of single measurements”
You really didn’t bother to actually read it, did you?
“We have seen that the uncertainty in a measured value x is a measure of the extent that values of x are spread around the expectation value 〈x〉.” (bolding mine, tpg)
For a normal distribution of random, dependent values (i.e. multiple measurements of the same thing) the VALUES OF X are spread around the expectation value (x). The expectation value is the true value for the measurand.
This dissertation is directly on point. And it leads to the statements:
“The uncertainty in the measurement of 〈x〉 is equal to the
standard deviation of the distribution of measurements of 〈x〉.” (bolding mine, tpg)
“Yes that’s always been the point, they are two different things. I say the uncertainty of a mean is a measure of how certain we are that the mean is correct, and you seem to be saying it’s a measure of how good a predictor of an individual sample it is. This is the difference between a confidence interval and a prediction interval.”
That is *NOT* what I am saying at ALL! I am saying that it doesn’t matter how precisely you calculate the mean, i.e. use a large number of samples, that mean still has an uncertainty related to the uncertainty of the component values from which you calculate the mean – IF YOU ARE COMBINING INDEPENDENT, RANDOM MEASUREMENTS OF DIFFERENT THINGS.
You and the climate scientists want to pretend that the more precise you make the mean derived from independent, random measurements of different things, that it somehow turns the mean into a TRUE VALUE with limited uncertainty.
As the dissertation shows, however, this can only happen if you somehow decrease the spread of the population, i.e. its standard deviation. Yet you cannot decrease the spread of the population by adding more independent, random measurements of different things because the variance (i.e. uncertainty) goes up every time you add another data point! When the variance of the population goes up so does the standard deviation of the population.
You can continue to ignore the effect the variance of a population has on the uncertainty of mean of that population but you will continue flying in the face of physical science.
“But even if you take your definition as correct it still doesn’t justify your claim that the uncertainty increases with the square root of the sample size.”
Since u_total = sqrt(u_1^2 + … + u_n^2), i.e. root-sum-square, if you have a common uncertainty, u, then you can factor it out and you are left with:
u_total = u * sqrt(n)
I’m simply amazed that you continue to believe that the more you restrict the value of the mean that it somehow lessens the uncertainty of that mean. That only applies when you have multiple measurements of the same thing, not when you have independent, random measurements of different things. The dissertation referenced even points this out, the higher the variance of the the less uncertain the mean becomes. And there is no way to lower the variance
Part 4
“Nope. Precision has nothing to do with accuracy. ”
I assume that as you are so keen on metrology you use the standard terms for measurement.
Precision is part of accuracy.
Accuracy of measurement:
closeness of agreement between a measured quantity value and a true quantity value of a measurand.
If a measured quantity value is not precise, it is not likely to be accurate.
“And uncertainty is *not* error.”
We are talking about accuracy, not uncertainty here. If a measurement is precise but not accurate it is because it lacks trueness. I find it difficult to see how something is not true if there are no systematic errors. The distinction between systematic and random errors is the distinction between trueness and precision.
“And you have NEVER answered me about what the uncertainty is for an integral of Acos(x).”
Gosh, in all those millions of questions you’ve fired at me I failed to answer one, how remiss. I’m really not sure what your question was about. Unless there’s some trick to it I would assume that as we are talking about a mathematical equation the uncertainty is zero.
“Deriving that uncertainty might give you some insight as to the uncertainty of degree-days.”
Degree days are not calculated from a precise equation. They are calculated from measured samples that have the same uncertainty as any other temperature measurement.
I think what this means is that NOAA has a Human-caused Climate Change fixation and they see warmth everywhere they look to the point that they make unsubstantiated claims about the temperature record as a means of making CO2 very, very, scary.
The UAH satellite data is the only data that can be counted on to be reliable. All the other data outfits are blinded by the siren song of Human-caused Climate Change, and it looks like this bias works its way into the temperature record. “Hottest Evah!” is the goal of the data manipulators. so they manipulate the data until they can make the claim, according to the manipulated data.
The computer-generated temperature records are all a scam run by just a few climate change activists and they manipulate their computers in concert.
The UAH satellite data correlates with the Weather Ballloon data, but the Weather Balloon data does not correlate with the computer-generated temperature charts. That ought to tell you all you need to know about which data set to trust. And it’s not NOAA’s.
Bad is bad. Once you start manipulating data to support your view, the manipulated data becomes worthless. Actually adjusting data for scientific reasons requires hard work – published processes, review, critique and more adjustments.
They can’t even adjust for local UHI, something that is doable but difficult. Instead they just smear the residual UHI heat around to hide it.
Why I don’t wonder ? 😀
Well children, as your teacher I’m soooo happy to inform you that you all won the Egg & Spoon race at this year’s School Summer Fete
Please step forward to receive your Gold Stars
The Head tells me he is looking forward to welcoming all you bright young things into 2nd Grade when school re-opens next month.
NOAA got a call to make it hottest month from the White House in support of the team effort in Congress. It was the same type phone call that DOE got to transfer the funds to Solyndra right before they failed.
In a recent email from NOAA Administrator Richard Spinrad, can you guess what Priority #1 was? Ding, ding, ding! You are correct, sir. Here’s your kewpie doll.
BTW, Priority two was Increasing equity and environmental justice,
That is right behind NASA’s top priority of landing at least one person on the moon who is capable of becoming pregnant.
Are they going to become that way while on the moon?
A “gay/lesbian transgender of color” would be the best…gets a lot of tick marks on diversity. A pregnant one would be off the scale.
(yes…I failed my diversity training.)
Ensure NOAA is seen as the primary authoritative provider of climate DISinformation and services.
Fixed it for them.
That’s what they are.
You’re joking about the “increasing equity and environmental justice”, aren’t you?
“You’re joking.”
Nope. See for yourself:
http://www.noaa.gov/stories/noaa-administrator-dr-rick-spinrad-my-first-100-days
These pronouncements on ‘unprecedented’ weather events remind me of my grandfather who always had a ready made comment: ‘I never remember it this hot … cold … dry …. wet’ whatever occasion it was. If any of us youngsters complained about the ‘extreme’ weather, he would immediately sarcastically comment ‘ yuong generation is far too soft, this is nothing compared what we had in the years long gone by’.
They “might” correct it some years after the key votes are done in DC.
Searching for all-time hottest temperature record produced two claims, to wit: Libya, year 1922, 57.8 deg C or 136 deg F, or Furnace Creek (Death Valley), year 1913, 56.7 deg C or 134.1 deg F. When you beat that we can talk.
I tell my kids I’ll talk about global warming once Greenland is back in the farming business.
The Climate Liar’s pants-fires are certainly the “hottest ever”.
Makes me wonder how many people were scrubbed from social media for correctly claiming July was not the hottest month ever.
Better start cleaning out a room in the house for European refugees.
European Gas Hit Record 100 Euros as Energy Crunch Worsens (yahoo.com)
When corrections are not published to articles which have been shown to be false, it wrecks credibility and future articles become worthless.
It’s as if these publishers had an agenda for the crap they were pushing, which makes them no different from drug dealers.
The correction will be published, in small print, on page no one looks at, at a time when people have forgotten. This is how handmade tales are conceived, normalized, and sustained in darkness.
When they continually cool the past and warm the present, it’s no surprise that the most recent month is ‘the warmest ever’.
Judith Curry, I hope that you’ve recanted your statement from several years ago that temperature adjustments don’t really matter. They do, because the MFWICs have found ways to manipulate the data to always make the current year the hottest ever (or at least in the top half dozen). They’ve got it down to an art form.
“because the MFWICs have found ways to manipulate the data to always make the current year the hottest ever (or at least in the top half dozen). They’ve got it down to an art form.”
Yes, they do.
Look at what NOAA and NASA have done to the year 1998. At the time, 1998 was the hottest year in the satellite era (beginning in 1979).
The year 1998, was the hottest year evah!, and was following the path that James Hansen had set out where CO2 increases were going to make the temperatures get hotter and hotter. And that meme worked out for Hansen as the temperatures from 1980 to 1998, had warmed as he was predicting.
But then Mother Nature threw James Hansen a curve ball. After 1998, the temperaures started cooling. That wasn’t supposed to happen in a climate change world. So to compensate for the lack of warming, Hansen and others started manipulating the temperature record to drastically cool 1998, from its original position, and that’s what they did, they cooled 1998 by 0.4C as compared to the UAH satellite record.
The Data Manipulators at NASA and NOAA did this manipulation so they could keep up the scaremongering over Human-caused Climate Change by lying and pretending that almost every year after 1998, was hotter than the prevous year. So NASA and NOAA declared at least 10 years subsequent to 1998, as being the “hottest year evah!”. They could only do this through data manipulation because the real temperatures put the lie to these claims.
Recall that the UAH satellite data and the Weather Balloon data correlate with each other, whereas the Weather Balloon data does *not* correlate with the Data Manipulators charts.
The NASA and NOAA lies are readily apparent by looking at the UAH satellite chart (below). The UAH satellite chart shows that there were NO years hotter than 1998, until the year 2016 was reached, which tied with 1998, for the warmest year in the satellite era (the margin of error for the UAH satellite is 0.1C).
So going by the real temperature profile, the one the UAH satellite chart displays, NASA and NOAA have been lying about the “hottest year evah” for decades.
Here’s the UAH satellite chart. See if you can find any years between 1998, and 2016, as being the hottest year ever, as NASA and NOAA claim. They couldn’t make these claims using the UAH chart so they manipulate their own charts to change the numbers so they can lie to the world about Human-caused Climate Change.
I think Satan will be skating to work before there is a retraction