Guest Post by Willis Eschenbach
It’s been a while since I played “Spot The Volcano”. The premise of the game is that the decrease in temperatures from volcanic eruptions is nowhere near as large as people claim. So I ask people to see if they can identify when a volcano erupted based on the temperature records of the time.
Now, I say that the main reason the temperature drop from volcanic eruptions is so small is that when we get a reduction in downwelling radiation from any cause, the equatorial oceans start to cool. When that happens the clouds form later in the day, allowing in more sunshine. And the net result is that any cooling from the volcanic eruption is mostly offset by the increase in incoming solar energy.
With that in mind, I thought I’d take a look to see what records we have for the largest volcanic eruption in modern times. This was the eruption of the Indonesian island of Tambora in April of 1815. To my surprise, I found that we have no less than forty-two temperature records from that time. As you might imagine, most of these are from Europe. The list of the forty-two stations is appended in the end-notes.
So I took the records for the period during which the Tambora eruption occurred, and I “standardized” them so that they all had an average value of zero and a standard deviation of one. Then I plotted them all on one graph. Here is that result.
Figure 1. Temperature records of forty-two temperature stations for a period during which the Tambora eruption occurred. Seasonal variations have been removed from the data, leaving only anomalies. DATA SOURCE
As you can see, there is good agreement between the various records, with the cold and warm years affecting most if not all of the records. And if that’s too fuzzy for you, here is the same data with the average of all forty-two of the stations overlaid in red on the individual station records.
Figure 2. As in Figure 1, but with the average overlaid in red.
You can see the problem. The largest eruption in modern times, and it is absolutely not obvious when it happened …
So when was the eruption? Well, it’s not where you’d expect, which would be just before one of the two biggest drops in temperature, shown on the left-hand side of the graph. Nor is it where the big temperature drop is on the far right of the graph. Nope. It’s in a very generic area where you’d never expect it to be found …
Figure 3. As in Figure 1, but with the years added.
Now, there are a couple things of note here. First, there are a number of temperature drops even in only this short record which are much larger than the temperature drop after the Tambora eruption.
Second, there are a number of cold temperature excursions even in this short record, some of which are much colder than during the period after the eruption.
My conclusion from this? Yes, there were likely areas in Europe and the US which were somewhat colder than usual after the Tambora eruption. But temperatures somewhat colder than usual occur every few years …
And overall, despite the size of the eruption, despite the megatonnes of sulfur dioxide that the eruption sent up into the stratosphere, despite the reduction in sunlight from that stratospheric dimming … despite all of that, the effect on temperature was indistinguishable from natural fluctuations in other parts of the record.
My very best to everyone,
w.
PS—As is my custom, I ask that when you comment you quote the exact words you are discussing, so that we can avoid at least some of the misunderstandings that plague the intarwebs.
DATA NOTES:
The following records were used in this analysis:
Basel Binningen, Switzerland
Berlin-Dahlem, Germany
Berlin-Tempel, Germany
Bologna Borgo, Italy
Budapest, Hungary
Chalons, France
De Bilt, Netherlands
Edinburgh Royal Obs., UK
Gdansk-Wrzeszcz, Poland
Geneve-Cointr, Switzerland
Gordon Castle, UK
Greenwich Maritime Muk, UK
Hohenpeissenb, Germany
Innsbruck University, Austria
Karlsruhe, Germany
Kobenhavn, Denmark
Kremsmuenster, Austria
Leobschutz, Czech Republic
Madras Minamb, India
Manchester Ai, UK
Milano Linate, Italy
Montdidier, France
Munchen Riem, Germany
New Haven Tweed, United States
Nice, France
Palermo, Italy
Paris Le Bourget, France
Praha Ruzyne, Czech Republic
Regensburg, Germany
St.Peterburg, Russia
Stockholm, Sweden
Strasbourg, France
Stuttgart, Germany
Torino Casell, Italy
Torneo, Finland
Trondheim Tyholt, Norway
Udine Campoformido, Italy
Vilnius, Lithuania
Warszawa-Okec, Poland
Wien Hohe War, Austria
Woro, Finland
Wroclaw Ii, Poland
Willis, very interesting and thought stimulating, as usual. My guess is that weather and climate are very complex and every major volcanic eruption is a bit different. I’m afraid we just don’t have enough detailed measurements from enough large eruptions to really be confident one way or the other about how much impact major volcanic eruptions have on both weather and climate.
Wasn’t that during the Dalton Minimum? What else was going on to cause the Minimum? This gets back to maybe there are a lot more inputs into the climate system than just Tambora, although your point of the temperatures don’t seem to fluctuate out of the “normal range for the 10 year period” appears to be valid.
There does appear to be a short .5 deg drop for over a year after the eruption which may or may not be relevant.
“There does appear to be a short .5 deg drop for over a year after the eruption which may or may not be relevant.”
Yes, I noticed that. In fact the drop lasts for almost two years. The other relatively long-term drop, centred on 1812, lasted only about a year.
The two cold spikes only last a couple of months. More smoothing of the graph would help to remove the short term effects.
It may be coincidence, but there does appear to be a nearly two year cooling following the eruption, and nowhere else in the graph is there a similar long-term cooling.
Chris
Your Fig 3 is very interesting. There was so much variability from other causes, any effect of Tambora was lost in the clutter.
1809-1810 was very cold, which is usually ascribed to the “mystery eryption” of 1808/09, known from sulphate deposits in glaciers, but not definitely identified. Contemporary observations of “dry fog” in South America suggests that it was somewhere in the Western Pacific.
Seems we could narrow down the location of that “mystery eruption” by taking those British ships logs (referenced elsewhere) and plotting their routes around that time, and look for evidence of an eruption in places where the ships didn’t go. You think?
You have missed several long records. Lund and Uppsala in Sweden for example.
The very long (from 1722) Uppsala series is available here:
http://www.smhi.se/polopoly_fs/1.2866!/uppsala_tm_1722-2018.zip
Reference: Bergström, H., and Moberg, A.: 2002, Daily air temperature and pressure series for Uppsala 1722-1998. Climatic Change, 53, 213-252.
Note that the 1999-2018 section is probably not corrected for UHI. It is an interesting record since it is one of the few that covers most of the very warm 1715-1740 interval just after the end of the Maunder minimum,
Thanks, tty. I’ll add that record. For some reason it’s not in the GHCN data. I suspect it’s because it’s created out of six different temperature records. Here’s the relevant section.
The dataset contains two versions, one adjusted for UHI and one unadjusted. Long-term trend is 0.026°C/decade unadjusted, 0.022°C/decade adjusted for UHI.
Bizarrely, post 1999 the trends difference is reversed. Unadjusted is 0.237°C/decade, adjusted for UHI is 0.239°C/decade.
w.
The adjustment before 1999 was made by Bergström and Moberg, the adjustment from 1999 by SMHI, the Swedish equivalent of NOAA. Nuff said.
He also missed Armagh Observatory.
Your charts are unlabled on the horizontal (time) axis. Knowing you, I expect this is not an accident.
How long a time period are we looking at?
oops — scanning quickly, I missed the very last chart.
Here is wiki on the eruptions presumed affects https://en.wikipedia.org/wiki/Year_Without_a_Summer
It looks like New England USA was where most cold weather was experienced. Unfortunately there is only one US datapoint in this data
Ok, then why did UAH show temperature drops that coincided very well with the El Chichón and Mount Pinatubo eruptions last century?
Thank, rah. Same problem.
w.
Willis,
One noticeable thing about UAH TLT is that it closely follows the ups and downs of ENSO3.4 with a ‘best fit’ long term lag of ~ 5 months (TLT following ENSO). I could only find monthly ENSO3.4 data starting Jan 1982, so I compared this with UAH TLTv6 over the period since. I converted both data sets to their 1982-2011 anomaly base to bring the numbers closer together for charting purposes and made this chart:
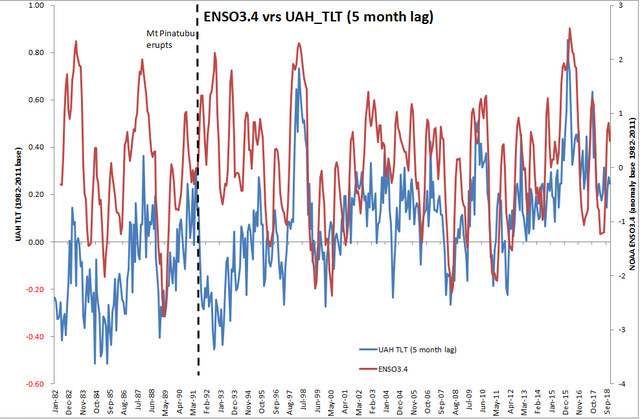
There is generally very good agreement between UAH and ENSO3.4 with this 5-month lag (except for trend, as ENSO is trendless), but the various fluctuations in ENSO are closely matched by UAH after ~5 months with one notable exception: the June 1991 Mt Pinatubo eruption in the Philippines (indicated by the vertical dashed line).
The TLT response to this was immediate and sent lower troposphere temperatures in the exact opposite direction of the ENSO signal it would normally have followed. The tight correlation between ENSO and TLT doesn’t really pick up again for a couple of years. DOesn’t this suggest that, as far as the lower troposphere is concerned at least, large eruptions can and do have an immediate and fairly long term impact on temperatures?
NOAA ENSO data here: http://www.cpc.ncep.noaa.gov/data/indices/sstoi.indices
DWR54 and Willis,
DWR54 has a very good point. Interannual temperature variations are dominated by ENSO signals. In order to see volcano effects on temperatures, one needs to remove the ENSO signal or compare the ENSO signal to global temperature signals. I have taken a preliminary look at the HadCRUT4 detrended temperature compared to the Multivariant ENSO index. You can see how El Chichon eruption in 1982 reduced the temperature anomaly of the 1983 super El Niño. Mt. Pinatubo eruption in 1991 resulted in a global temperature cooling from 1992-1994 during El Niño conditions.
https://imgur.com/BUpGjGg
Willis,
As I recall, your same analysis of major eruption events over the past two centuries showed the same lack of impact on global temperatures.
I’m curious how you explain the historical accounts of a “year without a summer”? Was it not a real event? Was it real but less a matter of cold than some other weather conditions impacting agriculture?
Rich, I suspect we’re seeing three things here.
First, certain individual locations have larger effects from any given volcanic eruption.
Second, we humanoids tend to exaggerate the weather of the past … “Why, when I was a boy, we had six feet of snow in one storm!” and the like.
Third, even one untimely frost can wipe out an entire growing season.
w.
Well yeah, in the summer we sometimes had as little as six feet!
I think what I read was that there was an excessive amount of rain in 1816.
I’m just a character out here in the Peanut Gallery, but wouldn’t “excessive amount of rain” be something consistent with elevated particles in the atmosphere? Something for the water vapor to bind to and form rain?
Yes, I thought that, too, AGW.
I learned in my Indiana history lessons about 1816, “the year without a summer,” during which hardly any crops were harvested because there were freezes in every month, and snow fell at least somewhere in the territory in every month. That was the year that Indiana came up for a vote in Congress (in December, I believe) as to whether it would become a state. According to my memories of what I learned then, the vote was in favor, but doubts were expressed whether anyone would want to live in a state where one could not plant crops. Of course, in subsequent years the weather returned to more typical conditions, and no one worried about Indiana’s being asked to resign from the Union on account of the weather. All of this was anecdotal, of course, so I did not register shock that you failed to list the Corydon, IN, weather station among your data (Corydon, a tiny village then and now, likely without any weather station, was the first capital of the state; Indianapolis was founded and built later).
Willis, Rich:
It’s been a while since I looked into it, so I’m going from memory here, but the key thing about the “year without a summer” was not consistently low temperatures. Instead, at least in North America, there was an unusually late killing frost in the spring, and then an unusually early killing frost in the autumn.
As Willis says, this “can wipe out an entire growing season”.
Ed, your timing is good. I’m looking at this in my next post, publishing tomorrow 10AM Pacific Time.
w.
“I’m curious how you explain the historical accounts of a “year without a summer”?”
Sometimes people make mountains out of molehills, like, y’know, CO2 and climate sensitivity.
The point is the temperature recovered extraordinarily quickly. That observational fact has the following implications. (Basic control theory. System response to a step change to determine system parameters.)
The volcanic eruption causes a step change in temperature. The earth’s response to the step change is to resist change (this is called negative feedback in control theory) as opposed to positive which would amplify change.
If the earth amplified temperature forcing changes (positive feedback) there would be an oscillating response for decades.
The fact that there was not an oscillating temperatures for years supports the assertion that the earth’s response to forcing change is strongly negative. i.e. The earth resists temperature changes by changes in cloud cover.
CAGW requires positive feed back to amplify.
Excellent point, William. We exist here on this planet because it is a homeostatic system. Essentially every change is resisted (damped) rather than amplified.
I assume that Willis takes an interest in this topic because volcanoes are frequently invoked as the deus ex machina for why 20th century temperatures don’t correlate well with CO2 concentration. If volcanoes have a smaller and shorter-lived impact than has been claimed, then the CAGW believers still have a lot of splainin’ to do.
Excerpts: Rich Davis – January 26, 2019 at 10:44 am
The BIG question is, …… which do you trust to be the most accurate/believable, …… the various historical temperature records ….. or ….. the historical accounts of weather conditions?
“HA”, we all know that we cannot trust the accuracy of the contents of the US Temperature Record (1870 to present).
ok, Willis, maybe the effects of a large volcanic eruption are lost in normal year-over-year variation, but you, like most everyone else, have been seduced by flashy, large pyroclastic one-volcano eruptions (like Tambora, Krakatoa, Vesuvius, etc.). But the volcanos that have an impact on climate are the large basalt flow provenances, like Deccan Siberia, and Columbia River. Not only is the temperature of the basalt flows much higher, and the geographic area affected very much greater, but the real secret is what I described in the comment “Geologists, Pizza, Beer”. This relates how a local hermit living on the Panamint Valley side of the Panamint Mountains (the other side is Death Valley), asked us to bring back from town two frozen pizzas and some beer. When we returned he said open some beers and give me one of the frozen pizzas, which he proceeded to set on a large black basalt boulder. The pizza was cooked by the time we were half-way through the beer. The temperature of the black basalt boulder must have been upwards of 160 deg F. Think about 100,000 square kilometers of black basalt flows, functioning like a black body, for hundreds of years. You can’t get those kind of results (cooling, that is) from those pretentious pyroclastic noisy events.
Ron,
Maybe I’m as dense as your basalt, but I’m not sure that I see what you’re trying to say here. Are you agreeing with Willis that volcanoes have a weak and transient cooling effect from dimming insolation but claiming that their bigger impact on climate is their strong and enduring warming effect from reduced albedo?
Sorry. I’ll try again with link this time. Why did UAH show drops in temperature that coincided very well with the El Chichón and Mt. Pinatubo eruptions last century?
It is easy to say “coincided well” but what does that means explicitly in scientific terms.
The Mt P cooling actually started well over a year before the eruption, so clearly some other effect is being confounded with it. If the cooling is exaggerated by confounding with other changes at about the same time you will think that climate sensitivity is greater. You will them be able to ramp the GHG warming to counter it in your models.
This is exactly what Hansen et co. did post Y2K when they abandoned the physics based values they got from analysing data after El Chichon and just started tweaking stuff to improve their model hindcasts.
How did the El Chichón and Pinatubo volcanic eruptions affect global temperature records?
https://wattsupwiththat.com/2009/01/13/how-did-the-el-chicon-and-pinatubo-volcanic-eruptions-affect-global-temperature/
But didn’t Tambora cause the year without a summer?
https://en.wikipedia.org/wiki/Year_Without_a_Summer?
If your theory is correct, shouldn’t you be able to see the effect in modern satellite data? I think Pinatubo caused global cooling. Is there data on tropical cloud formation that you could compare before, during and after the Pinatubo cooling?
Pinatubo sure did cause a red sun at midday in where I live in Indiana and as I remember considerably cooler temps.
It also caused incredibly beautiful deep purple “sunsets” on Oahu over an hour after the sun dipped below the horizon. I did not expect it and hadn’t brought my camera to the picnic dinner I had taken my kids to.
Yes. I would suggest that the record is inadequate, Tambora erupted during an already cool period, and temperature is important, but lack of sunlight and precipitation in the form of snow and hail can be devastating to crops.
But didn’t Tambora cause the year without a summer? https://en.wikipedia.org/wiki/Year_Without_a_Summer?
If your theory is correct, shouldn’t you be able to see the effect in modern satellite data? I think Pinatubo caused global cooling. Is there data on tropical cloud formation that you could compare before, during and after the Pinatubo cooling?
What level of accuracy do we have about the amount of CO2 released, by black smokers, and other ocean bottom vents, and how many active submarine volcanos are emitting gases continuously?
Lars
All of them are.
Funny +1
At 8.2S lat I’d expect it to take 12 months to show up in a mid-Lat NH record. and then not as a spike in an 11 yeat long graphical presentation but as a 12 minth trend.
The spikes (up and down) are month long events in Willis’ 11 years of data graph.
What about Southern Hemisphere temps or temps in the vicinity of the eruption?
How would this look if you just the closest data site, Madras Minamb, India?
Also there’s no records for the Southern Hemisphere, given Tambora is located there.
Thomas Jefferson made daily temperature measurements at Monticello from 1810 to 1816. During 1816 he measured the temperature decline known as the “Year Without a Summer” and the “Poverty Year.” He was apparently unaware of the 1816 Tambora eruption and offered no other explanation for the decline, which was associated with exceptionally cold temperatures in New England and elsewhere. I measured a modest noon temperature decline in Central Texas following the 1992 Pinatubo eruption, which was associated with a sharp increase in the aerosol optical depth. The peak noon temperature in 1990 was 96.8F, which fell to 94.0F in 1992. The temperature then recovered almost linearly until 1996, when it peaked at 100.4 F. A similar trend in minimum noon temperature occurred during these years. I’ve made near daily measurements since 4 Feb 1990 and have not observed a similar association of temperature with high optical depth since Pinatubo. I have also observed various ups and downs in temperature not associated with volcanism that Willis has described. My conclusion: (1) Major volcano eruptions can indeed reduce temperature and (2) so can weather events beyond our control.
Jefferson was always recording weather and temp when he was at home. The Christmas night 1776 when Washington and his little Army crossed the Delaware to attack Trenton, Jefferson recorded 8″ of snow fell at Monticello.
He nicknamed his thermometer Sally. His wife would ask, are you going out to check Sally again?
Apparently he did partake in taking Sally’s temperature.
But to be historically correct, Jefferson was widowed in 1982 when Martha died. He likely didn’t begin his “fatherly” relations with then 15 yr old Sally until 1788 when she was with him in France when he was the US Ambassador there.
widowed in 1782 of course (not 1982). I miss edit, sigh.
Thanks, nice to know.
Sally Hemmings was Martha Jefferson’s half sister, ie Thomas’ half sister in law.
Yes, he even bought a new thermometer during deliberations of the Declaration of Independence in Philadelphia. The 1810-1816 segment was considered his best. He converted the data into a table that I plotted to see the Year Without a Summer effect.
Tambora’s main VEI 7 eruption was 10 April 1815. It would take at least 6 moths for the higher lats of the NH to see an effect of diminished insolation there. The oceans buffer (largely prevent) short term temperature swings between hemispheres.
I had read about the “Year Without a Summer” so long ago, it is best to update.
So, rather than finding some of my old books with references to Tambora and the ensuing summer frosts, I went to Wiki.
Good review with diary observations of planting, in some places in NY State three times and getting frosted out.
One historian called it the the last subsistence crisis in the “Western World.”
Tambora is at 8 degrees south, trade winds need to be considered.
However Mayon (Philippines) is in the North Hemisphere at 13N, erupted on 1st February 1814 and appears to be clearly identified in the N. Hemisphere’s records.
Volcanic sulfur dioxide (SO2) from mount Etna is often found at altitudes of 7-8km.
In the Equatorial regions there is little of two hemispheres’ atmospheric mixing at such altitudes.
https://earth.nullschool.net/#current/wind/isobaric/500hPa/orthographic=102.02,-0.47,543
Altitude 5.5 km or 18,000 ft
Willis,
I’m curious as to whether there was a greater affect on Tmax or Tmin after Tambora? To my untrained eye there seems to be a noticeable low in the 1815 – 17 period. This isn’t obvious until you put the marker on the last chart.
Ben, I suspect that the main effect of volcanic eruptions is not a cold spike, but a lack of hot spikes …
w.
Thank you Willis, it is visible in the two yesrs after 1815 compared with the rest of the chart.
Willis,
“the effect on temperature was indistinguishable from natural fluctuations in other parts of the record.”
Stretch your x axis out more horizontally and it becomes less a part of the clutter. When one considers all of the potential causal variables acting upon temperatures it seems quite apparent that there is a significant impact by volcanic eruption aside from, or more to the point, in addition to all of the “natural” variation, of which this is simply one more natural occurrence.
Willis,
Your 2012 post on this subject is more enlightening regarding effects of volcanism. My opinion.
https://wattsupwiththat.com/2012/03/16/volcanic-disruptions/
There is not just one kind of volcano eruption. Each is unique, some with fine dust, some with coarse dust, some with almost none. Sulfur emissions vary. I suspect the difference in the records are due to such differences in volcanos.
DHR
There are also differences in the color and albedo of the ash. Violent eruptions from stratovolcanoes, which are most likely to reach into the stratosphere, will probably have ash with a higher albedo than ash from more mafic volcanoes. So, it is difficult to ascribe a quantitative behavior to ash injected into the stratosphere unless one at least knows something about the silica content of the ash. As a general rule of thumb, as dark ferromagnesian minerals are comminuted they become lighter in color, while opaque mineral stay dark or become darker. Sialic minerals tend not to change much. What is called the “streak” of a mineral is a good guideline to how the color might change. But, the point is, not all ash is the same. Climatologists who talk vaguely about ash being injected into the stratosphere are betraying their ignorance. At the level of real science, it is the particle size and the complex refractive index of the particles that are the most important consideration, and the information on the complex refractive index of various aerosols is available in the literature, although it is not comprehensive.
DHR, I agree. I read somewhere that a volcanic eruptions that ejects large amounts of sulphur into the stratosphere cause cooling. Those that don’t, don’t.
Actually, they cause warming in the stratosphere initially. Once the aerosols settle out ( a couple of years ) there is a net cooling of the stratosphere which is persistent. I have no idea whether this also happened back in 1815. Maybe recent conditions are different from then ( aircraft pollution , for example ).
This cooling implies that the stratosphere is more transparent after such an event and more solar energy gets through into the lower climate system. The probable net result is : global warming , not the cooling built into climate models.
See a fuller discussion here:
https://climategrog.wordpress.com/uah_tls_365d/
Thomas Jefferson kept exttensive weather records. He recorded 1816 as the year without a sumer.
Well, it was during the LIA. There were probably several years without summers during that few hundred years. Some of them even show up on Willis’ charts.
1816: the sumer without an m. 😉
Willis if all human co2 emissions stopped today when would we see an impact on temps and co2 levels?
Your NAS and the Royal Society joint report tells us that temps would take a thousand years to decrease and co2 levels wouldn’t drop much for thousands of years.
Nic Lewis thinks that temps wouldn’t take a thousand years to respond, but co2 levels would be much slower. Just asking?
We wouldn’t see any difference ever, temperature wise, because there is no forcing, theres nothing there excepting conjecture.
Sorry OT, but I just saw this and wanted to park it somewhere (’cause I’ll lose track of it).
Spot the landscape containing 2 #shale drilling pads, 16 wells & a #natgas pipeline…
https://twitter.com/DWBerkley/status/641443786695045120
Apparently you’re no sorry you posted it anyway.
Well I am sorry, but not terribly sorry. Well, not even that sorry, really. Just formally sorry in a sorry kind of way. Sorry if I’m being sorry for not being really and truly sorry. I’m just sorry, I guess.
I’m sorry. “Sorry if I’m being sorry” should be “Sorry if I’m not being sorry enough”
Willis, I’m agreed with your basic position that volcanoes are over rated. Feedbacks in climate, quite possibly the ones you suggest, react to ensure increase solar input which compensates for the lost energy. The degree-days of lost input get made up in the following 4-5 years.
Following Bob Tisdale’s recent article on NODC ‘averaged temperature’ of the ocean depths, I decided to look at top 100m vs 100-700m by subtracting the datasets provide. By inverting the 100m data we can see the heat flowing in and out of the thermocline and general see-sawing of the two reservoirs.
Here is a ‘spot the correction’ challenge , in the same spirit as your article.
I suspect someone has had their finger on the scales at one point , see if you can spot it.
There were quite a few VEI 4 or greater leading up to Tambora:
“Mystery eruption” somewhere in the South Pacific, 1808 or 1809 estimated at VEI-6
La Soufrière St. Vincent (in the Caribbean) 1812
Mount Awu Indonesia 1812
Suwanose-jima Japan volcano eruptions 1813-1814
Mayon Phililpines eruption Feb 1 1814
As tty pointed out the mystery eruption left a sulfate signature in glacier cores. It is similar to the signature of Tambora, with the same peak but narrower width. Tambora was a VEI-7. With all of that activity, I’m not sure you could single out one extra volcano.
the efolding time is on the order of 2 years
Eyeball observation.
After Tambora there is a slope down in temperature and it looks like the joint slowest drop.
That is: the rate of fall is slower than all other periods where the temperature falls (except possibly one other like it).
It may be that volcanoes cause a different cooling effect with a different signature. A lesser signature, sure, but still real.
There is an initial dip but within few years it recovers. This implies that volcanoes do not induce a permanent cooling effect, just a temporary one.
How can it be temporary? Well, the climate modellers would have AGW causing warming which counters the volcanic cooling and this kinda fits the late 20th c. , if you don’t look too closely.
The problem with that is Tambora does just the same thing and there was no significant AGW back then ! This would imply that there are climate feedbacks which compensate for changes in downward radiation and that the models attempting to balance AGW and volcanic forcing are doing the wrong thing.
This is why they are over sensitive post Y2K since they no longer have volcanoes to counter the exaggerated AGW.
Willis,
I am a big fan of your thunderstorm thermostat model!
You said: “Ben, I suspect that the main effect of volcanic eruptions is not a cold spike, but a lack of hot spikes …”
Is this what you meant Willis?
The large equatorial eruptions of the second half of the 20th Century were:
Mount Agung – March 17th (VEI 5) + second weak eruption May 16th, 1963.
El Chichon – March 28th (VEI 5) + 2nd weaker eruption March 30th and 3rd stronger eruption April 4th, 1982.
Mount Pinatubo – June 15th (VEI 6), 1991
Which just happened to closely followed by the onset of moderate to strong El Nino events:
1963/64 – moderate El Nino – starting around August 1963
1982/83 – very strong El Nino – starting in May 1982
1991/92 – strong El Nino – starting in Jun 1991
Normally, you would expect a noticeable increase in the world temperatures in the year following these El Nino events.
According to the Quinn El Nino index, there were:
a strong (index 4) El Nino event in 1814
and moderate+ (index 3) events in 1812 and 1817.
The expected post-warmings following the 1812 and 1817 El Nino events are evident in your temperature data, however, the post-warming expected after the 1814 El Nino event should have occurred in 1815. Maybe the volcanic cooling of the 1814 eruption was just counterbalanced by the El Nino post-warming just like the three large eruptions in the late 20th century.
[N.B.: The 1819 warming in your temperature record occurs just before a moderate (index 3) El Nino event in 1820, so it is not explained by this hypothesis].
Hi Ian, there is such a warming in the extra-tropical SH oceans:
Part of a full article on tropical feedbacks :
https://climategrog.wordpress.com/2015/01/17/on-determination-of-tropical-feedbacks/
It’s not an easy because of the natural noise in temperature series. It’s like in finance to try and find if a particular indicator can predict the future of stock prices. Lots and lots of if history is needed to find the relationship due to all the noise.
Of course there’s a lot of noise, but it’s hard to stop people shouting on the floor of a stock exchange.
It would be so much easier to just model this stuff.
modelling it is hard because the effect is also a function of the size of the aerosols
That’s not a problem, it means you have a few more unconstrained variable you can play with to ensure you get an exaggerated climate sensitivity from the model.
This is exactly the problem with the whole game. We do not have “basic physics” for some of the key phenomena that drive climate. Thanks for pointing that out.
Willis,
Sorry, but I misread Quinn El Nino index table at:
http://research.jisao.washington.edu/data_sets/quinn/
The Quinn index says that there was a moderate+ in 1819, not 1820, so the warming in your data set in 1819 could be associated with this event.
American farmers and fishermen noticed the effects of Pinatubo, which were indeed dramatic:
https://www.tandfonline.com/doi/abs/10.1577/1548-8675(2002)022%3C1014%3AWDMPHT%3E2.0.CO%3B2
The eruption of Mt. Pinatubo in the Philippine Islands during June 1991 was followed by a global temperature decline of 1°F through 1993. May to July temperatures in Minnesota during 1992 and 1993 were 3°F below the 1979–1998 average. The 1992 and 1993 year-classes of walleyes Stizostedion vitreum from Minnesota’s nine largest walleye lakes, which are gillnetted annually, were the two weakest since 1979. Mean June temperature explained more than 40% of the variation in year-class strength. Mean statewide walleye gill-net catch per unit effort (CPUE) from lake surveys increased at a rate of 1.3% annually after 1979 and was positively related to rising June temperatures, which explains 57% of the variation from lakes in glacial drift and 28% of the variation from Precambrian shield lakes. Walleye fry stocking was also positively related to increased walleye gill-net CPUE, but fingerling stocking was not. Chaotic events, such as large volcanic eruptions, may negatively affect walleye recruitment, and these effects may be evident to anglers several years later.
“The Year Without a Summer” isn’t a quaint anecdote. It’s a scientific fact, a global observation.
The effects of even the largest tropical eruptions however are fleeting.
My comment on the obvious effects of the Pinatubo eruption on North American agriculture and even fisheries is still missing. Maybe because it included a link.
I think the affect of volcanoes on temperatures and subsequent climate disturbances is a research field still in diapers. Data sets are still being adjusted as more eyes get on the ice cores.
http://www.antarctica.gov.au/magazine/2011-2015/issue-27-december-2014/science/new-ice-core-records-rewrite-volcanic-history
err, more data is availble than willis considers.
but yes, just start reading the literature and you will see that it is core complex than a simple look
at a few temperature stations and more complex than reaidng a few diaries.
There is a rcih pile of literature that no one here bothers to read before opining
Another recent article re ice core variability at the local single core level.
https://www.clim-past.net/12/103/2016/cp-12-103-2016.pdf
Thanks Willis.
Knowing this series of yours, I did not bite,
just kept reading. Ha.
~ ~ ~ ~ ~
The weather in the region was documented.
Here is a link to historical accounts:
New England Historical Society
This was a time of transport by cart, walking, or horse. Information about the regional problems did not easily get out, and doing much about it was not possible.
It became a serious issue, unlike it would if it happened in 2019. We could flood the area with food and clothing in 2 days via Amazon dot com, UPS, Fed X, and the USPS.
Similarly, read Timothy Egan’s “The Worst Hard Time” about the Dust Bowl years – before, during, after.
There were extreme hot summers, cold winters, and strong winds. The dust itself is easily explained, the weather not so much.
w. ==> Judith Curry included a paper on Tambora in her weekly review.
https://sci-hub.tw/10.1029/2018GL081018
Mr. Mosher, you disappoint me. The “study” you linked to is only an exercise in model fitting, AFAICT. I’m sure you realize, in fact you may have been one of the ones to point out, model output is not data. If I have mischarcterized the study, please define how, don’t give me one of your typical, “You got it all wrong…” type of comments.
First lets see what willis claims
‘It’s been a while since I played “Spot The Volcano”. The premise of the game is that the decrease in temperatures from volcanic eruptions is nowhere near as large as people claim. ”
Really? well HOW LARGE do they claim it is? since he gave no cite, you have to start looking for the folks he is trying to counter.
The paper is not MODEL FITTING. I suspect you dont know what model fitting is.
Here is what you should have learned.
1. It tells you what the important uncertainties are.
2. It indicates that the climate response may be driven more by the initial conditions
than the forcings
3. It tells you that summer response may be larger than winter response.
Model output is of course data, the key is knowing HOW to use it.
So, reading this paper, I would be inclined to check the observations in summer as a seperate analysis.
From the conclusions some more hints about what to look for
“Our results demonstrate that uncertainties in initial conditions can prevail or even dominate
the impact of (realistic) choices on the eruption’s magnitude on the surface temperature
response to such a large eruption. Especially for winter, the inter-ensemble overlap of posteruption temperature anomalies hinders conclusive assessments about the forcing magnitude
and response pathways compatible with a certain volcanic signature on certain regional
surface climates. Otherwise stated, different realistic combinations of volcanic forcing and
initial conditions lead to indistinguishable temperature responses. This implies that improved
constraints on the Tambora forcing would not allow for better understanding of the
temperature response to this eruption within current modelling frameworks, unless this is
accompanied by substantial progress in the constraint of initial conditions. Accounting for
volcanic forcing uncertainty seems nonetheless necessary, as the use of just a current best
estimate can bias the interpretation of reconstructed responses. This was exemplified for the
European “year without a summer” as the cluster yielding the best correspondence between
reconstructed and simulated features mainly contains realizations from an ensemble using the
low-end estimate of volcanic forcing. In this sense, the classical truth-centered approach for
ensemble analysis, where the ensemble mean and spread are regarded as forced response and
uncertainty due to internal climate variability, respectively, may bring to misleading
conclusions in reconstruction-simulations comparisons. On the other hand, certain continental
and subcontinental regions appear to be particularly sensitive to the magnitude of volcanic
forcing especially in boreal summer (e.g., North America in MPI-ESM-LR), which may
provide guidance on identifying locations where climate proxies are most sensitive to the
direct radiative impacts of volcanic eruptions.
The general validity of these conclusions stands beyond the single climate model used here,
as different models currently used in paleoclimate applications share similar ranges of
internal variability and climate sensitivity (e.g., PAGES2k-PMIP3 group, 2015).
Generalization of our conclusions must consider that the forcing uncertainty used here
accounts only for uncertainty in the volcanic stratospheric sulfur injection, not uncertainties
related to the translation of sulfur injection into aerosol and radiative properties as performed
here by the EVA module. Such uncertainties result from, e.g., the poorly constrained aerosol
size distribution for eruptions larger than those recently observed (Toohey et al., 2016), and
variations in the spatio-temporal evolution of the forcing due to differences in atmospheric
circulation and sulfur injection height. Furthermore, the estimate of uncertainty in volcanic
stratospheric sulfur injection for Tambora is smaller than most eruptions of the past 2500
years (Toohey and Sigl, 2017): Robust quantitative analysis for specific eruptions thus
requires an ad-hoc design”
Most importantly the paper gives you a START at seeing what the ACTUAL SCIENCE says about volcanic reponse.
Remember Willis’ first uncited claim
“It’s been a while since I played “Spot The Volcano”. The premise of the game is that the decrease in temperatures from volcanic eruptions is nowhere near as large as people claim. ”
WELL, how large do they claim it is? Willis never says. so you need to start
researching what the science says about this volcano. RIGHT?
or do you just wave your arms and say “The science says the effect is huge!!! but look here
I say its small!”
So a reading list..
Stoffel, M. et al. (2015), Estimates of volcanic induced cooling in the Northern Hemisphere
over the past 1,500 years. Nature Geoscience 8:784–8. doi:10.1038/ngeo2526
Swingedouw, D., Ortega, P., Mignot, J., Guilyardi, E., Masson-Delmotte, V., Butler, P.G., &
Khodri, M. (2015), Bidecadal North Atlantic ocean circulation variability controlled by
timing of volcanic eruptions. Nature Communications 6:6545. doi:10.1038/ncomms7545
Swingedouw, D., Mignot, J., Ortega, P., Khodri, M., Menegoz, M., Cassou, C., & Hanquiez,
V. (2017), Impact of explosive volcanic eruptions on the main climate variability modes.
Glob. Planet. Ch., 150: 24-45
Timmreck, C. (2012), Modeling the climatic effects of large volcanic eruptions. WIREs Clim
Change. 2012;3:545–64. doi:10.1002/wcc.192.
Toohey, M. & Sigl, M. (2017) Volcanic stratospheric sulfur injections and aerosol optical
depth from 500 BCE to 1900 CE, Earth Syst. Sci. Data, 9, 809-831,
https://doi.org/10.5194/essd-9-809-2017
Toohey, M., Stevens, B., Schmidt, H., & Timmreck, C. (2016) Easy Volcanic Aerosol (EVA
v1.0): an idealized forcing generator for climate simulations, Geosci. Model Dev., 9, 4049–
4070, https://doi.org/10.5194/gmd-9-4049-2016
Zanchettin, D., Bothe, O., Graf, H. F., Lorenz, S. J., Luterbacher, J., Timmreck, C., &
Jungclaus, J. H. (2013), Background conditions influence the decadal climate response to
strong volcanic eruptions. J. Geophys. Res. Atm. 118(10):4090–106. doi:10.1002/jgrd.50229
Zanchettin, D., Bothe, O., Lehner, F., Ortega, P., Raible, C. C., & Swingedouw, D. (2015),
Reconciling reconstructed and simulated features of the win
Thank you, Mr. Mosher, now I have an idea what you’re talking about.
I didn’t want to quote the whole thing you quoted even though it does give a detailed analysis, but I think that one sentence sums up what I’m getting out of this, i.e., the impact of a volcano may be less than natural variability and/or uncertainty. In other words, it ain’t no big deal. I like this paper, it does a better job than most of admitting what they could prove and what they still don’t know. Having said that, it still is, IMHO, way too much time spent straining at gnats. Models have been shown to be unfit for purpose of predicting long-term climate. Now the model these authors have spent so much time dissecting, bisecting and fine-tuning may be intended solely to model a volcano’s impact on the world weather (it’s not getting anywhere near 30 years, they freely acknowledge, so don’t call it climate) and in the end it appears they concede it can’t be done, the choice of initial conditions completely overwhelms the response from the volcano. So overall, this study supports Willis’ conclusion, a volcano doesn’t have a significant impact on GST.
What gets the most noise from people who publish headlines, and therefore I conjecture may be what Willis is responding to, is papers like this: http://advances.sciencemag.org/content/4/6/eaao5297 where the entire intent of the paper seems to be the-only-reason-we’re-not-warming-the-way-we-predicted-is-an-evil-conspiracy-by-the-sun-and-those-damn-volcanoes-so-you-can’t-relax-yet-CO₂ -will-get-you-in-the-end-anyway!!! (But reveals 3 significant climb-downs: 1st there has been nearly a decade of denying a “pause”, now it seems there is one; 2nd a decade ago greenhouse gas forcing was going to overwhelm natural variability in 10 years, but now this paper admits it hasn’t; and 3rd the BBC said the science was settled in 2005 and there was no sun link to climate change, now there is; these are all paraphrased from David Whitehouse.) So Willis seems to be right, the effect from a volcano is overwhelmed by natural cycles and uncertainty, so don’t blame every cooling, or even every failure to warm, on volcanoes.
I would be interested to see Figure 3 compared against PMO and/or AMO, and maybe for good measure graph the El Niño’s and La Niñas.
Which has led me to cogitate this: The “anomalies” are calculated solely from an average of a 30 year set of years. To truly plot “anomalies” one should know what the natural cycle of weather would have been, so rather than a flat-line average, there should be a sine wave (maybe rising or falling) or even double sine waves added together. Then subtract that from the current temperature to possibly hope to begin to see if we might be able to tell if something is changing, and whether or not it might be significant.
Looks like I forgot to say, “…and ENSO…” Some other commenters not only thought of that, they’re producing the graphs. I like it. Both DWR54 and ALLAN MACRAE (seem to) show that, with a 5-month offset, ENSO is good predictor of temperature except for a couple of years immediately after a significant volcanic eruption. Now we’re getting somewhere.
It seems to make sense that some type of natural variation would be in play at the time of eruption. If a minor warming was occurring the eruption may do nothing more than limit any increase (dampen) and may not be identifiable because one couldn’t know how much warmer it was going to be owing to other natural causes. If the natural variability was a temperature decrease an eruption would enhance a temperature decline, but one could never know how low the temperature would have gone anyway. The question then becomes one of does an eruption spew enough material into the atmosphere to over-ride other drivers of natural variation in temperature. I guess I’m the fourth frog on the log with this issue.
Maybe all this shows is how doctored the surface datasets are.
Willis,
Why are all your records (the 42) from the Northern Hemisphere? I know Tambora is on the Equator or thereabouts but there should be the same effect in Southern Hemisphere, shouldn’t there be (or similar lack of)
I have not read all the comments so maybe this is redundant.
Very interesting paper, and as you say, surprising.
Old Woman, the reason is that there are not many temperature records from the Southern Hemisphere in general, and none from that early a time.
w.
Calendar dates of several major volcanos are co-plotted on HadCRUT4 temperature graph starting 1850 in Figure 10 at http://globalclimatedrivers2.blogspot.com . Consistent with Willis’ assessments: “No consistent AGT [Average Global Temperature] response is observed to be associated with these.”
It would be interesting to see the weather effects of a Toba type eruption (75,000 years ago), thought to be 30 x the size of Tambora, but the effect on humans would be rather severe.
I assisted David Ludlum on the publishing of the Nantucket Weather Book. One of his series and meticulously researched.
“The Year Without a Summer” is well documented.
June, July and August all recorded below freezing temperatures on the Island with “ice in the water pails each month.”
Crop failures drove many islanders to the Midwest.
Much as warmer, drier conditions drove Indians from Arizona to Colorado 600 years ago.
(Moved from Nantucket to Arizona two years ago. My on island tomatoe plants did not do well that year 🙂
Do you have a reference to the July ice? Amazon has the book available for about $100, there are less expensive used books.
The diary of Mrs. Kezia Fanning:
June 15
Remarkable cold weather for the season. Ice was on water pail in the morn this week. Vegetation almost destroyed.
Thomas Rodman’s record at New Bedford gave an indication of departures from normal.
June -5.1, July -5.8, August minus 2.1, September-3.4
There are no temperature records
On Nantucket till 1886.
Hope this helps,
Bruce
The June freeze is well documented in New Hampshire, I can find but a single reference to frost in July, and that was in the White Mountains.
June in NH:
http://notrickszone.com/wp-content/uploads/2016/04/Volcanic-Dust-Injections-and-NH-Temperatures-1880-1970-Oliver-1976.jpg
http://journals.ametsoc.org/doi/pdf/10.1175/1520-0450%281976%29015%3C0933%3AOTROHM%3E2.0.CO%3B2
“A period of several decades existed (~1915-1945) in which volcanic activity was unusually light and, as mentioned earlier, the temperatures were higher than the preceding [1880s to 1910s] or, in fact, the subsequent (current) [1950s-1970s] period. … Numerous possible causes of climate change have been discussed in the literature, including both anthropogenic and natural factors. Two principal anthropogenic sources are often considered: changes in atmospheric carbon dioxide and changes in tropospheric dust. … Mitchell (1975) concluded that neither tropospheric particulates [anthropogenic pollution] nor atmospheric CO2, in concert or separately, could have accounted for the major part of the observed temperature changes of the past century.”
—
http://www.nature.com/articles/srep24331
“There are 54 large explosive volcanoes during 501–2000 AD in total, and the strongest one is the Samalas volcano in 1257–1258, which is followed by three smaller eruptions in 1268, 1275 and 1284. These strong volcanoes do not allow the climate to recover, and might have triggered the Little Ice Age.”
https://www.nature.com/articles/srep24331/figures/2
—
https://hal-amu.archives-ouvertes.fr/hal-01457247/document
“Climate simulations using single and cumulative forcings suggest that the ocean surface cooling trend from 801 to 1800 CE is not primarily a response to orbital forcing but arises from a high frequency of explosive volcanism. Our results show that repeated clusters of volcanic eruptions can induce a net negative radiative forcing that results in a centennial and global scale cooling trend via a decline in mixed-layer oceanic heat content.”
99 records in GHCN v4
probably more in berkeley earth. I have to check
Here are the best sources if you have the time. The source files you used have not been updated since
we lost our access to the lawrence livermore supercomputer. I’ll see if I can get them updated
but its a huge task on a deskside system
look here:
1. Spatial http://berkeleyearth.lbl.gov/auto/Global/Gridded/Complete_TAVG_LatLong1.nc
2. Station data: QC applied http://berkeleyearth.lbl.gov/downloads/TAVG/LATEST%20-%20Quality%20Controlled.zip
3. Predicted station data
http://berkeleyearth.lbl.gov/downloads/TAVG/LATEST%20-%20Breakpoint%20Corrected.zip
predicted station data is this. during the estimating process every station/segement is assigned a quality
score. The quality score is a weight that is used to create the final field.
After completing the final feild, we can then subtract the station from the feild. This diference
is the “adjustment” the station would need to bring it into alignment with the field prediction.
Some people called this “adjusted data”, however for us adusted data is an OUTPUT of the process and not an input.
Steven Mosher January 26, 2019 at 6:00 pm
Thanks for the link to the data, Steve. I took a look. Of the 99, only 61 have over 120 valid observations during the period of my graphs … and the additional 19 stations make no difference to the results.
All the best,
w.
Willis:
The Tambora eruption occurred during the on-going 1814 “ENSO warm event”, which is why the climate record doesn’t show a deep drop in temperatures immediately associated with the eruption. You have to look at the ENSO temperatures at the time of an eruption. Had it occurred during a La Nina, its climatic effect would have been even more severe.
The same happened with the Pinatubo eruption, which also occurred during an El Nino. Smaller eruptions in non-El Nino years have exhibited more initial cooling than Pinatubo, though it eventually did end the El Nino, and temperatures dropped–but not as much as they would have done otherwise–it did not cause a La Nina, as is often seen after even smaller eruptions.
yup.
The bigger issue is the uncertainty ( monthly) during this time period
on the order of 2-3C which could swamp any signal
Steven Mosher January 26, 2019 at 7:00 pm
Mosh, when I plot up the 61 datasets covering the time, in actual degrees as anomalies, I get the following:
Not seeing the monthly uncertainty … what am I missing?
w.
what are you missing?
Brohan’s data.
https://sci-hub.tw/10.5194/cp-8-1551-2012
Thanks
I looked at Brohan’s data … still not seeing the “monthly uncertainty”. Also, his graph of “Northern Hemisphere temperatures from observations” in Figure 9 is totally unlike the GHCN data …
Fascinating stuff nonetheless, thanks for the link.
w.
Burl Henry January 26, 2019 at 6:11 pm
Thanks, Burl. I’ve never seen an ENSO record that went back to 1814 … link, please?
w.
Willis
You’ll find the data here:
http://research.jisao.washington.edu/data/quinn/quinn15251987.dat
Thanks, Burl and Bindidon. Can’t say I’m impressed with that Quinn El Nino Index. It overlaps with the NINO34 Index from 1870 to 1987. Here’s how they compare. I averaged the NINO34 index for all the years where the Quinn Index was 0, 1, 2, etc. Here’s the result:
As you can see, a Quinn Index of 5 is not statistically different from a Quinn Index of 0. Both of them translate into a negative NINO34 value. the Quinn Indexes of 1, 4, and 6 all translate into high NINO34 values. Go figure.
And given that the Quinn Index does that badly in modern times, the idea that it is accurate in 1815 is … well … let me just call it “very doubtful” and let it go at that.
Best to you both,
w.
Willis, I’m afraid you did not choose the best approach when yearly averaging a monthly time series like ENSO.
Simply because the El Nino signals are concentrated around a peak mostly located near year begin. Averaging the monthly values into years instead of doing that around the peaks often will dilute the El Nino information, especially where it is immediately followed by a strong La Nina.
Some similarities exist, but in many places it gets a bit silly.
I don’t want to search for the NINO3+4 stuff on the disk, but MEI for 1871-2017 I have a hand.
Here is the monthly data:
https://drive.google.com/file/d/1Fg9vsUoSkvyVcnG4t3GY4mxslS2LE2bi/view
and here is its yearly average:
https://drive.google.com/file/d/1ICmCex43tAr-AdtyYVTEDo_EJZbWJe6d/view
Nevertheless I suppose like you that Quinn’s accuracy is somewhat questionable.
Bindidon January 27, 2019 at 3:56 pm
Bindidon, the Quinn data is annual averages. If I use anything but annual averages to compare them to, I’d be comparing apples and oranges … no bueno.
Regards,
w.
Willis:
The book “El Nino in History” by Cesar N. Caviedes has a Table of El Ninos and La Ninas from 1800-1999, which includes an El Nino in 1814.
However, he does discuss the Quinn, et al chronologies, which span the years 1541-1983. and states that it is considered “the yardstick against which the effects of past El Ninos on the entire Pacific as well as on distant continents are gauged”. Quinn;s list integrated the findings of an Emil Taulis (1934) on El Nino conditions in Chile, and Caviedes had produced a separate list in 1991,(which I have not seen, as yet). I am sure that they had facts which identified an El Nino in 1814.
Burl Henry
With Google’s usual help I found a free copy of César N. Caviedes book on the Persian Met Agency server:
El Nino in History
Storming through the Ages
http://www.kermanshahmet.ir/myfiles/admins/xabar/file/cavi0813020999.pdf
This is imho one of the most competent books concerning ENSO events.
1814 is indeed referenced therein as El Nino year. But it certainly wasn’t a very strong one: all heavy El Ninos appeared als yearly duos.
Bindidon January 29, 2019 at 10:48 am
I looked at it. I also took the next step, which it appears you didn’t take. I listed off all of the years he says are El Nino and La Nina years, and compared the modern ones to his list … bad news. He doesn’t do much better than just picking at random.
Not impressed …
w.
Willis:
Links are:
sharpy.org/1739-1816.html
research.jisao.washington.edu/data_sets/quinn
So much for the sulphur injection into the upper atmosphere geoengineering idea, than.
https://iopscience.iop.org/article/10.1088/1748-9326/11/2/024001#erlaa0d97s2
This is an interesting approach
https://iopscience.iop.org/article/10.1088/1748-9326/aa7a1b
using break in temperature reconstructions to derive dates of eruptions
One thing I have learned before wading into the data is to get a view of prior work.
Not only are there more stations in GHNC v4 but there is additional data
see the work below.
Lesson: if you want to challenge the science around how volcanos work and the challenges of detecting
that, you need to do a basic literature review
( see figure 9 in https://sci-hub.tw/10.5194/cp-8-1551-2012)
Some other work
https://iopscience.iop.org/article/10.1088/1748-9326/aac4db
https://sci-hub.tw/10.5194/cp-8-1551-2012
https://sci-hub.tw/10.1016/j.gloplacha.2017.01.006
‘Volcanic eruptions primarily impact the global radiative budget of the Earth,
leading to a global temperature drop, as described in the introduction and first noticed
by Lamb (1970). For example, the cooling impact of the Mt. Pinatubo eruption is
evaluated to be of around 0.5 K (Soden 2002). Brohan et al. (2012) used an
unprecedented collection of observations of log-books preserved in the British library to
estimate the response of the global climate to the 1815 Tambora and the 1809 unknown
eruptions. They found a global temperature response to these two eruptions of the same
order of magnitude, which can be interpreted as rather modest given the reconstructed
IVI of these eruptions. Nevertheless, it remains difficult to assess the exact temperature
response to a particular eruption solely from observations given that the forced volcanic
signal is superimposed upon natural variability, for example related to ENSO, AMO and
NAO among others (Zanchettin et al. 2013a), wwhich can be superimposed on volcanic
eruptions’ impacts (Lehner et al. 2016). In addition, Canty et al. (2013) argued that
taking into account the ocean circulation changes due to the eruptions could lower the
estimate of the radiative directly induced global temperature cooling by a factor of two.
Nevertheless, their analysis should be considered with caution because they used an
AMO index as a proxy of ocean circulation, while the latter includes by construction
(spatial average of SST anomalies) the radiative changes due to volcanic eruptions (this
effect is further discussed in section 5).
….
Until recently, the signature of very large volcanic
eruptions like Samalas or Tambora was not clearly visible in temperature
reconstructions of the last millennium, in particular from tree ring data, which is known
to capture particularly well interannual climatic variations. To explain this mismatch,
Mann et al. (2012) proposed that years with very cold anomalies, similar to the year
without a summer following the Tambora eruption in 1816 (Luterbacher & Pfister 2015),
may prevent trees from growing and de facto inhibit the production of any ring. Such an
issue would have a very strong impact on the estimation of the age of trees and
consequently on the related chronology in the climate reconstructions, since some years
may be missing in the account of layers.
Schurer et al. (2014) showed that volcanic eruptions can explain most of the
forced variability over the last millennium as compared to solar variations. These
findings were confirmed over the last two millennia by using continental scale
reconstructions by PAGES 2k–PMIP3 group (2015). Concurrently, climate models seem
to produce too strong surface cooling related to volcanic eruptions (Fernández-Donado
et al. 2013). An overestimation of Northern Hemisphere temperature response to
volcanic eruptions has also been found by Schurer et al. (2013) using detectionattribution analyses.
Brohan, P. et al., 2012. Constraining the temperature history of the past millennium using early instrumental
observations. Climate of the Past, 8(5), pp.1551–1563.
https://sci-hub.tw/10.5194/cp-8-1551-2012
Amongst the archives in the British Library (BL) in London
are some 4000 logbooks from ships in the service of the English East India Company (EEIC); each recording the details
and events of a voyage from England to the Indies (usually
India, China or both) and back, typically taking the best part
of two years. The EEIC received its charter from Elizabeth
I in 1600, and many of its earliest voyages became famous
because of their excellent records of new lands; for example
that by Henry Middleton to the Moluccas in 1604-6 (Foster,
2010). These early voyages were recorded in diaries; logbooks – formally prepared documents of a standard format
– did not begin to appear until the 1650s. Their preparation
was part of an officer’s duties until the gradual expansion of
the Company in the 1830s into a quasi-military and political
body responsible for overseeing British interests in India and
beyond. Those archived in the BL, therefore, extend from the
1600s through to the 1830s, and are well-known to historians
(Farrington, 1999). They document social conditions, discipline, medicine and health, the trade and transport of goods,
people and passengers. They touch on first contact with new
lands and peoples, convey colonial attitudes and cultures, and
describe long lost coastal towns and villages. Many even contain detailed drawings of coastlines, ships, mammals, birds
and sea creatures.
Ship’s logbooks are also valuable sources of historical
climate data (Chenoweth, 1996; Wheeler et al., 2006; Brohan et al., 2009, 2010), and the EEIC logbooks include
daily records of the weather along the routes taken by the
ships: they cover large parts of the Atlantic and Indian
Oceans, and include the occasional foray into the Pacific. All
the logbooks contain wind speed and direction records, as
this was vital information for early navigators, but the later
logs, starting in about 1790, are even more valuable, as some
of them contain daily thermometer and barometer observations as well as the wind reports. The principal instigator of
the addition of instrumental observations was Alexander Dalrymple – the Company’s, and later the Royal Navy’s, first
hydrographer. Dalrymple was both an explorer and an enthusiastic scientist, and, as hydrographer, he was responsible for
ensuring that the EEIC ships could transport goods to and
from England as quickly as possible and at minimum risk
of loss. With this in mind, he equipped the East Indiaman
Grenville with a set of meteorological instruments for her
voyage in 1775 under Captain Burnet Abercrombie (Dalrymple, 1778), and set a pattern to be later adopted by officers on
all EEIC ships.
Brohan 2012
1. Read the literature.
2. Best estimate of the response is around .5C
3. Global land records have uncertainties much higher than the signal
4. Look at the other data
“The records of the English East India Company (EEIC),
archived in the British Library, offer a remarkable new insight into the weather and climate of the late eighteenth and
early nineteenth centuries. Their archives include 891 ships’
logbooks containing daily temperature and pressure measurements, and wind-speed estimates, each covering a voyage from England to India or China and back. The 273 000 new weather observations extracted from those logs provide
material for detailed reconstructions of the weather and climate between 1789 and 1834 and offer new insights into
pre-industrial climate variability. For all three meteorological
variables studied (temperature, pressure and wind) it is clear
that the data can be used for investigating variability over
the period of measurement, though comparison with measurements made decades or centuries later will require close
attention to observational biases.
The observations demonstrate that the large-scale temperature change, over the Atlantic and Indian Oceans, associated
with the two big tropical volcanic eruptions in 1809 and 1815
was modest (perhaps 0.5 ◦C). Some of the GCM simulations
in the CMIP5 ensemble show much larger volcanic effects
than this – such simulations are unlikely to be accurate in
this respect. Recent annually-resolved proxy reconstructions
of Northern Hemisphere temperature show a varied but similarly modest volcanic response (about 0.2–0.7 ◦C); the new
observations therfore provide an out-of-sample validation for
the proxy reconstructions – supporting their use for longer term climate reconstructions.”
OR, you can look at a small noisy subset ( skepticsTM technique) and conclude the science is wrong
“Now, I say that the main reason the temperature drop from volcanic eruptions is so small is that when we get a reduction in downwelling radiation from any cause, the equatorial oceans start to cool. When that happens the clouds form later in the day, allowing in more sunshine. And the net result is that any cooling from the volcanic eruption is mostly offset by the increase in incoming solar energy.”
1. would you accept this hypothesis as a definitive test of your model?
2. Can you quantify
A) the cooling you expect from volcanos
B) the amount of cooling offset?
c) the “net” small cooling?
You see with a physics model you can do all this, and you can discover that “hey your estimated cooling is too much” and this leads to additional insights
A) the size of particles matters
B) the concomitant natural cycles matter, and may be influenced.
C) the observations may be biased.
This is what distinguishes a “just so” explanation ( some cooling, offest by more sunshine) from a physics
explanation which has to put numbers ( even if they are guesses) on the line.
The just so explanation is so fuzzy that it’s hard to modify or improve in light of data.
The physics approach ,which puts numbers on the line(even if they are gross estimations) can be modified
enhanced, constrained. some answers can be ruled out, while other remain as “consistent with”
the approach.
Steven, if we had a “physics model” I’d be glad to use it. Instead we have tinkertoy models that don’t include host of important phenomena and have very little to do with the physics.
Now, if you want numbers, I’ve been there and done that, as you’d know if you had, what did you call it … oh, yeah, “Read the literature.” I showed that a decrease in downwelling solar at the Mauna Loa observatory due to Pinatubo and El Chichon of up to 60 W/m2 had no visible effect on the Mauna Loa temperatures.
So piss off with your “This is what distinguishes a “just so” explanation ( some cooling, offest by more sunshine) from a physics explanation which has to put numbers ( even if they are guesses) on the line.” I’ve given you stacks of numbers over the years, including the very numbers you are now asking for, and you have roundly ignored them or dissed them or made one cryptic information-free comment and kept on with your nonsense.
w.
Large volcanic eruptions are, at most, short transient events in most temperature records. El Chichón and Pinatubo are most noticeable in the satellite stratospheric temperature data. Otherwise, they didn’t leave much of a mark.
Willis is spot on about Tambora. Also, the Pleistocene Toba eruption, which at one time was suspected of nearly wiping out our ancestors didn’t leave a noticeable tempeature mark in any of the ice cores.
Also, the Pleistocene Toba eruption, which at one time was suspected of nearly wiping out our ancestors didn’t leave a noticeable tempeature mark in any of the ice cores.
The period following the Toba eruption shows a prolonged temperature drop in the Vostok ice core.
Phil. January 27, 2019 at 10:50 am
Must be time for “Spot The Volcano, Toba Edition” …
Answer to follow …
w.
That looks like the period from 80,000 BP to 60,000 BP and Toba is dated to around 74,000 BP so that would put it during the first drop, there is evidence that Toba may have been as many as four events. Dating it precisely in the ice core records is difficult because there is no associated tephra so it’s done using sulphate and isotope measurements.
Thanks, Phil. Actually, these days it’s been dated a bit more accurately. From the paper:
Here’s the location …
Not seeing the claimed huge cooling …
w.
The 18 month post Tambora period seems to be the longest overall cooling trend in the graph.
efolding time of the aerosols are around 1-2 years
if they get to the stratosphere, otherwise they rain out quickly
Just more confirmation that no matter the concentrations of individual gases in the atmosphere, just one defines temperature.
Solar radiation volumes hitting the earth surface are controlled by h20 in a pretty narrow band.
A dim sun = less cloud, and a strong sun = more cloud.
Its seems to me a ”cycling speed” thing.
More energy absorbed and a faster cycle of transfer.
Hi Willis,
Century-scale volcanoes like El Chichon and Pinatubo are clearly evident when one plots the Nino34 Area Sea Surface Temperature, vs. the Global UAH LT temperature four months later.
https://wattsupwiththat.com/2018/09/20/icelands-monster-volcano-charging-up-for-eruption/#comment-2463203
It is known that major (century-scale) volcanoes cause about 0.5-0.6C of global cooling, due to the ejection of fine materials into the upper atmosphere, which take about 5 years to fully dissipate – see below for the evidence. These large volcanoes reportedly also emit large quantities of CO2.
It is obvious that the global cooling effect of the fine volcanic ejecta greatly overwhelms the global warming effect of the CO2. Quelle surprise!
…
Regards to all, Allan
Notes:
The Nino34 Area Sea Surface Temperature (the blue line in the following plot), adjusted by the Sato Global Mean Optical Depth Index (for major volcanoes – the yellow line), correlates quite well with the Global UAH LT temperature four months later (the red line).
https://www.facebook.com/photo.php?fbid=1527601687317388&set=a.1012901982120697.1073741826.100002027142240&type=3&theater
It is clear from the divergence of the red line (Global UAH LT temperature) below the blue line that (Nino34 SST) that El Chichon and Pinatubo caused about 0.5C to 0.6C of global cooling that took about 5 years to fully dissipate (warm up) in each case.
As I recall, Mt St Helens was probably large enough to cause cooling too, except that it blew sideways, not up – fatal for the observer located in that direction.
I think St Helens didn’t release much SO2 either. Those Indonesian volcanoes have a lot more.
I didn’t include references, but I wrote in http://wermenh.com/1816.html :
My reference link is stale, I don’t have time at the moment to hunt things down.
ALLAN MACRAE January 27, 2019 at 5:36 am
Sorry, Allen, not seeing it … here’s “the Nino34 Area Sea Surface Temperature, vs. the Global UAH LT temperature four months later.” Large red/black and blue/black dots are Pinatubo and El Chichon eruption dates, arrows show the two years following each one.
What am I missing?
w.
Hi Willis – can you see this plot, referenced above? If not, contact me through my website and I will email it to you with the spreadsheet.
See the places where the red and blue lines diverge – that is the magnitude of the volcano-induced cooling.
Best, Allan
https://www.facebook.com/photo.php?fbid=1527601687317388&set=a.1012901982120697.1073741826.100002027142240&type=3&theater
Allan, I can see it. A question—what is “Sato”?
w.
Hi Willis,
Sato Aerosol Optical Depth Volcanic Index:
http://data.giss.nasa.gov/modelforce/strataer/
https://data.giss.nasa.gov/modelforce/strataer/tau.line_2012.12.txt
Data goes back to 1850 but stops in 2012 – but no Century-scale volcanoes since then (I think).
Best, Allan
———————————————————–
I used the Sato to adjust the calculated UAHLT for the volcanic effect – that is the yellow line.
Note the divergence post 2016, where the yellow and blue lines sit below the red line – curiouser and curiouser.
Maybe the right chart, showing you what isn’t visible in yours?
https://drive.google.com/file/d/134HW_g8ensDzrWyHgHKWz45fR4UqGb_8/view
Please have a look at 18982/83 (St Helens, Chichon), 1992/93 (Pinatubo.
You clearly see the volcano influence many commenters were talking about.
And it’s off topic, but you see also that
– the tropospheric response to ENSO- is much smaller than that to ENSO+;
– 2016 was something unusual compared with 1998 (the LT signal was higher in 2016 then in 1998, despite the ENSO signal having been a lot weaker).
Bindidon, per your graph it looks like the volcano is warming the troposphere … no?
w.
Willis
No of course it doesn’t. How do you come to that strange conclusion?
You easily can see that exactly at the eruption points, the troposphere cools.
Would that not have been the case, then the tropsphere would have reached at that time the same level as MEI’s El Nino signal, just like in 1997/98.
You also easily can see in a comparison of UAH’s lower troposphere (LT) and lower stratosphere (LS), that at these eruption points, the stratosphere warms:
https://drive.google.com/file/d/1_ecu50TZYPYfr57XIWZ_rcu9p2trm2hy/view
Sources (column 3 in each):
– LT: https://www.nsstc.uah.edu/data/msu/v6.0/tlt/uahncdc_lt_6.0.txt
– LS: https://www.nsstc.uah.edu/data/msu/v6.0/tls/uahncdc_ls_6.0.txt
Thanks, I was reading it backwards.
w.
You’re welcome.
J.-P.
OK, I can see this chart. While initially there appears to be some congruence, I think Willis’ has the correct back-check on that, do a scatter-plot. It normalizes what you’re looking at. Wait a second…
@Willis, what if you take a difference, (somehow)… assume ENSO is a trend-line, how far does the GST vary from that trendline? A “de-trended” data set, IOW?
FB says I’m not part of your “audience”. Can you put it someplace else so all can see it?
Hi RedV – does this work for you? Please advise.
Willis, you are a bloody gem. Talk about throwing a hand grenade into the conversation, this is one of the best. I always knew that volcanic eruptions lowered the global temperature because I read it somewhere. Now I see that I may have been a lazy gullible. Keep up the good work.
Just found that study with references to mid-ocean seismicity and termohaline circulation.
Compiling all the stations into one graph hides any regional anomalies that might have occurred. Parts of New England, for example, had a very cold summer in 1816 with many days of freezing rain, snow and frost. One might make the case that the temperatures during 1816 were actually cooler than they might have been had the volcano not erupted.
Wayne Shepheard:
A volcanic eruption does not instantaneously affect average global temperatures, it typically takes about 12 months before its maximum cooling effect occurs, as its SO2 aerosols circle around the globe.
The cold 1816 summer was right on schedule for the April 1815 Tambora eruption.
There was a post awhile back, I think on here(?) about the “year without a summer”, and found while indeed there was at least one frost episode in every month that summer, if you turned the daily temperature into monthly averages (as we do to modern-day data) there was almost no difference between the summer of 1816 vs. 1815 or 1817.
This is a grim story – about 1816 – “The Year Without Summer”, following the eruption of Tambora in 1815.
https://en.wikipedia.org/wiki/Year_Without_a_Summer
The Year Without Summer was called “the last great subsistence crisis in the Western world”.
It was cold circa 1800 during the Dalton solar minimum – as Napoleon’s Grande Armée discovered in 1812 on their disastrous winter retreat from Moscow.
Britain (including Canada) and the USA engaged in the War of 1812. The Americans tried to keep warm by burning Toronto, and our side tried to keep warm by burning the White House. Since then, both sides have declared victory – Canadians resent Toronto and Americans resent the White House, so both sides think they got the better of that deal.
According to wiki:
“As a result of the series of volcanic eruptions, crops in the aforementioned areas had been poor for several years; the final blow came in 1815 with the eruption of Tambora. Europe, still recuperating from the Napoleonic Wars, suffered from food shortages. Food riots broke out in the United Kingdom and France, and grain warehouses were looted. The violence was worst in landlocked Switzerland, where famine caused the government to declare a national emergency. Huge storms and abnormal rainfall with flooding of Europe’s major rivers (including the Rhine) are attributed to the event, as is the August frost. A major typhus epidemic occurred in Ireland between 1816 and 1819, precipitated by the famine caused by the Year Without a Summer. An estimated 100,000 Irish perished during this period. A BBC documentary, using figures compiled in Switzerland, estimated that the fatality rates in 1816 were twice that of average years, giving an approximate European fatality total of 200,000 deaths.”
In New Hampshire, we did not have a July frost in the southern part of the state. There are claims they did in Franconia, in the White Mountains.
I think the polar jet stream was overall pushed south but also had a meridional flow that both let cold air go south, and hot air come north. The highest temperature that summer in southern NH was 100F on June 23rd. While that didn’t negate the killing frost earlier in the month, the heat wave help mask it in monthly averages.
Looks to me that some sort of integral or cumulative plot of the anomaly would be more revealing. I’ve seen lots of data that does not show up if the time domain is wrong.
I have done some work on GCRs nucleating not just clouds but magma gases as deep as 4.4 km.
So in our “disaster cycles” Quiet sun letting in GCRs causes dropping temperatures due to clouds and also increased earthquakes and vulcanism. It’s a double whammy.
The Hawaii volcano 2018 and it’s cyclical wee hours eruptions /EQ in the plus 5 range led me to this line of study. I need to do more mathmatically and statistically, but this month of work will not allow it. It’s a big deal though, and I am convinced (myself) it is true, but to what degree.
Why bother looking at monthly, or even daily or hourly, data to find an event that has a lifetime of one or two years (or maybe 3 for the really big ones). At least one should take annual data, at the shortest. Since el Nino is the biggest competitor to volcanoes for putting bumps in the record, and has a recurrence interval on the order of 5 years, a 5-year smoothing would remove much of the el Nino “noise”.
John Christy ran a 5-year running mean of several tropospheric data sets, including his own, and gets:
Can you spot the volcanoes?
Hint: there’s two of them.
Thanks, Richard. I made your graphic visible. Here’s the problem.
A “running mean” is the worst of all filters, because it turns peaks into troughs, and troughs into peaks.
Here is Christy’s lower troposphere temperature data (yellow), and that same data smoothed with a 5-year running mean (red).
As you can see, Pinatubo occurred right at a temperature peak … but after the running mean it’s at the bottom of a trough. And the opposite happened to El Chichon … it occurred at the bottom of a trough, and after the running mean it’s near a peak.
Running means are rubbish, and should NEVER be used to smooth data.
w.
Yeah, simple running means create more artifacts than most statistical shenanigans. Perhaps Christy should have used a gaussian or other smoother, but for his purposes the running mean sufficed to show his point – very powerfully!
It looks like he did a centered five year mean, which runs from Year-2 to Year+2, which means the effects of the volcano may show up 2 years before the blow-out! If you shift the smoothed curve two years later, to have a following mean from Year+0 to Year +4, the dips and peaks seem to line up a bit better (a quick glance here). Physically that makes sense.
Unfortunately, for the 5-year following means, el Chichon has no Year 0 five year mean, since it occurred 3 years after the data starts in 1979.
Willis
“Running means are rubbish, and should NEVER be used to smooth data.”
I made a different experience all the years when comparing time series.
While agreeing with you about running means being useless everywhere you need to go into little details, I think that they are conversely pretty good whenever you want to compare series behaving only superficially different.
Here is an example: a comparison of GHCN V3 with UAH 6.0 land-only:
https://drive.google.com/file/d/1aymAha2312Tiw8XqHrf6qIKaiN5RYbgt/view
Behind the inevitable differences in the standard deviations, which look like texts written using different dialects, the running means perfectly extract what the series really have in common.
Rgds,
J.-P.
Amateurish rubbish! Polarity reversal NEVER occurs in the low-frequency pass-band of running means, only for alternate higher-frequency side-lobes of the sinc-function-like frequency response H(f). While they’re very far from optimum as low-pass filters, the harmonically spaced zeros of H(f) are practically indispensable in TOTALLY eliminating strictly periodic (diurnal and seasonal) components of climate data , which otherwise would obscure the orders-of-magnitude smaller climate signal.
For those unfamiliar with the frequency response of N-term moving averages:
H(f) = sin(Npi*f)/[Nsin(pi*f)], for f in the interval [0, 0.5]
That occurs ONLY because an unintelligent choice of N was made, which put the high frequencies of volcanic effects on one of the negative side-lobes of H(f). Such are the hazards of analytically blind number-crunching. That unremitting blindness to Fourier synthesis and analysis of data is the entire basis of the Ocasio-Cortez-level populist appeal: “who are you gonna believe … 1sky1 or your own eyes?”
BTW, professionals in DSP have long recognized that running means are the OPTIMAL filters of given length for suppressing noise.
1sky1 February 4, 2019 at 2:58 pm
I just demonstrated, not claimed but demonstrated, that a running mean turns troughs into peaks and vice versa.
Now you come along and claim that’s perfectly OK because … well, something about polarity and side-lobes. Look, I don’t WANT peaks in my data turned into troughs and vice versa, no matter how much you may claim it is all perfectly fine.
And for all the rest of you good folks, who are you gonna believe … 1sky1 or your own eyes? LOOK AT THE ARROWS to see what a running mean does to a trough. In addition, the running mean has taken Pinatubo from occurring at a peak in the data (yellow line) to occurring at a trough in the running means (red line) … but no worries, 1sky1 assures us that’s no problem at all.
w.
My 4:36pm comment properly belongs here.
I was able to identify it in the first graph before looking forward.
Your position on this does not really appear to be very scientific and is aimed more as a propaganda ploy.
Yes, the climate or weather is very variable. I think most people can understand this.
but there are ways to extract the relative effects of volcanic eruptions by understanding some of the other drivers of climate and weather.
Oceans dominate Earth’s temperature stability. A short event like a volcano would have little effect on Earth’s average temperature.
But the wrong event on the wrong moment can be disastrous in an Europe recovering from 20 years of continuous wars with a shortage of able young men and horses.
“A short event like a volcano would have little effect on Earth’s average temperature.”
I don’t agree.
Because our climate primarily depends on solar radiation reaching the oceans.
Huge volcanic eruptions uniformly fill the atmosphere with aerosols.
Thus if you want to quantify volcano effects, the worst idea is to restrict your analysis on land surfaces.
Between 1250 and 1600, there was an endless series of huge eruptions (VEI 6 to 7), beginning with Samalas on Lombok Island (Indonesia).
The influence of the aerosol spread during two centuries certainly was far bigger for the oceans than for the land surfaces: while the latter quickly move from warm to cold and vice-versa, the oceans store heat for much longer time.
Vilnius, Lithuania
Warszawa-Okec, Poland
Wien Hohe War, Austria
Woro, Finland –>
Vilnius, Lithuania
Warszawa-Okec, Poland
Wien Hohe Warte, Austria
Woro, Finland
https://goo.gl/images/s7NknL
https://goo.gl/images/HqsNyi
Who is “we”? I’m surprised you didn’t use Gov William Plummer’s records from Epping NH. While I only created a spreadsheet for his April-September 1816 temperatures, his records are important as they’re at a highly impacted area.
There are also records lurking around from Massachusetts, Vermont (or just south), and maybe another good one in New Hampshire. I don’t know where they are and they may not even be scanned or the data digitized.
For anyone else interested, Plummer’s data is at http://wermenh.com/1816/ – There’s a lot of other stuff, including an NH report I wrote for a Geocache and a more scientific look that I wrote for WUWT et al for the 200th anniversary.