
.
The most destructive storms are convective storms like hurricanes , tornadoes, thunderstorms and heavy rainfall. This video examines where the greatest convective energy is located and why scientists are finding a decrease in extreme weather, evidence that contradicts the climate crisis narratives.
A transcript of video is available at
https://perhapsallnatural.blogspot.com/2021/12/how-pressure-systems-control-climate.html
Jim Steele is Director emeritus of San Francisco State University’s Sierra Nevada Field Campus, authored Landscapes and Cycles: An Environmentalist’s Journey to Climate Skepticism, and proud member of the CO2 Coalition.
All sound meteorology which appears to be a mystery to climatologists.
As for how it all fits into a bigger picture, see here:
https://www.researchgate.net/publication/342109625_Return_to_Earth_A_New_Mathematical_Model_of_the_Earth's_Climate
which proposes that convective overturning creates the so called greenhouse effect and not radiative gases.
1.25X speed
Ironically, the reason the Earth is warmed by the atmosphere is not the mythical greenhouse effect but the real greenhouse effect.
Just like inside a greenhouse, the air can warm and rise but most can’t escape the system.
“Wet areas are getting drier”.
See? Climate change. Told ya!
European natural gas prices hit new high
“European natural gas prices rise further as freezing weather arrives
Declining flow through key Russian pipeline has also pushed prices higher, analysts say
Ronald Smith, senior oil and gas analyst at BCS in Moscow, said the drop in supply on the Yamal route could be explained by unseasonably cold temperatures, which have reached minus 25 Celsius in western Russia and close to minus 50C in East Siberia.
‘It is possible that cold weather here in Russia is limiting Gazprom’s export capacity to an extent and/or they are working to keep Russian storage as full as possible.’ he said.”
https://www.ft.com/content/aa51e2fe-3da1-47cb-aa88-61f92e954e41
“Germany will shut down three nuclear plants forever next week, slashing clean and reliable baseload power in the middle of winter and during the worst energy crisis in Europe since the Second World War.”
That should be a teachable moment. I wonder if the leaders will learn and how many dead citizens will pay the price for their lesson.
A friend of mine is predicting that Russia will invade Ukraine, on Christmas day. They will then be able to turn off the gas taps to Europe until they accept the new world map.
Personally I doubt this, the reaction to that would be far more than Putin is used to or might imagine, in fact I doubt he’s seriously contemplating that, and fully understands the response would be strong and decades long in the process.
I do however believe Putin will do anything that makes him look essential to Russian borders and sovereignty, just so he can stay in power.
But for sure he can kiss the Black Sea Fleet bye-bye, from there forwards, it would be destroyed.
Few days ago I said on another thread “Vlad the Terrible is readying for the Xmas & New year exercitus fireworks.”
Dissolution of the Soviet Union took place exactly 30 years ago on December 26, 1991.Recently Putin called this event the end of “historic Russia”
Question is how is going to mark the anniversary, I doubt that he will ignore it.
Please don’t use Marxist phrasing…
Vuk: I know how you use “Green”, and we are aligned on the same set of principles. That said, it has been a decades long pet peeve of mine to hear “Green” being used as the LEFT has redefined it.
Increasing CO2 increases green, reducing it reduces green. At least this is true with the levels we’re talking about!
So, I posit that nuclear plants are not green. Just sayin’. 😉
I’ve always thought it’d be Europe that first crashes from the madness, they are so progressive.
The current forecast is for the Temp conditions in western most Russia to become much worse in coming days (-35C or so). So if cold is the real cause of a restricted supply, it will get worse before it improves after the new year some time.
At present Europe is cold but not so bad until about the 30th, when it gets much colder, as per.

It’s not just low temperatures that might be a problem. Had a look at earth.nullschool a couple of hours ago – the highest wind speed I could find in Germany was 8 mph, the lowest 3mph.. Not too good for the windmills, and at 2300 hrs (local), it’s a long time till sunrise.
Definitely worth viewing. More actual data that puts the lie to climate alarmist carnival barkers.
Steele provides a transcript. My favorite comment:
I have often posted an observation (my own theory, but nobody has pointed to statute or case law that contradicts it) which goes like this:
Because of his inexcusable delays Mann’s case against Tim Ball was tossed out of court. That meant he avoided presenting evidence under his control. That, in turn, gives rise to adverse inference. I think the reasonable inference is:
ROTFL The Mann is a self-confessed fraud.
Except for this year in Germany, Vancouver, Henan, Sicily, Kentucky, the Philipines.
Except for all those extreme events!
Speaking of climate alarmist carnival barkers…
Are you confident these events never happened before?
I was going to ask the same question.
Over the last 50 years, I was born in 1950, I can recall many events related to climate in all these countries /States.
Just because in your short life, Griff, and the gutter press say they are unprecedented it doesn’t mean it’s true.
Just a single example
The deadliest overall tropical cyclone to affect the Philippines is believed to have been the Haiphong typhoon, which is estimated to have killed up to 20,000 people as it passed over the country in September 1881.
In case you haven’t got to difficult subtraction at school yet, that’s 140 years ago.
Ben,
Population of the Philippines in 1881 is likely to be a third, or possibly less – of the current 110 million or so.
So death toll then proportionately more.
Tho’ noting better protection is likely today. I hope.
Auto
The deadliest most extreme hurricane ever recorded in the US happened in 1900, in Galveston Texas. Before any coal power plants existed, or SUVs.
Weather events have always happened at some place some time
So pathetically desperate, ignorant and off topic
Are you sure you and Simon aren’t related? Did you two eat a lot of lead paint chips as kids? No joke, as Biden says.
You may want to have your brain function tested. You may be suffering from early? onset dementia. I have noticed that you comments over time have become simpler!
Simplistic is the word you wanted.
Definition of simplistic
: excessively simple or simplified : treating a problem or subject with false simplicity by omitting or ignoring complicating factors or details
If you knew anything about statistics you would know that it is necessary to have some extreme weather events to maintain the current climate statistics. Another way of xsaying this is, if we didn’t have some extreme weather events, the climate would be changing from the recent historical case to a different climate with FEWER extreme events then would be expected.
But, no, griff and the idiots jump on every extreme event as “evidence” that the climate is changing for the worse. Go look at the data, fools. Strong tornadoes are decreasing in number, hurricanes are fewer and not stronger, drought is lessening – and this is all IPCC and government statistics. Stop lying.
Meaning, the other 99.99% of the Earth has had non-extreme weather.
You’re such a mindless fool – give it up.
griff you are very funny but could you persuade rockyrex from the Guardian to come on WUWT.
Now he’s really funny with his ex-geography teacher cracker barrel doomsday approach to climate change and his database of posts that he regularly repeats..
He’s been there about 13 years and is a Guardian mod, has his own website but never strays on to other blogs whom he describes as the crankosphere.
He’s a real climate alarmist coward so I don’t expect him to appear but you never know.
I’d love him to come on here and get wasted.
The Philippines(note spelling) are known to be the most exposed country to tropical storms in the world with about 20 typhoons entering the Philipine area of responsibility every year. At least 5 of these storms are destructive.
The most devastating typhoon to hit the Philippines, however, was way back in October 1881, when Typhoon Haiphong killed around 20,000 people and went on to destroy the port of Haiphong in Vietnam and lay waste to large parts of that country and eventually cause some 300,000 deaths.
Six years later in 1887 Typhoon Angela caused some 1800 fatalities in the Philippines.
https://daydreaminginparadise.com/the-10-worst-typhoons-to-ever-hit-the-philippines/
In the video you state 14,000 kilometres altitude – twice. You have it correct in the written text at 14,000 metres.
Yep, I didnt catch my mistake until I published the video, but corrected the trasncript
Oh those famous Hadley and Ferrel cells of pedantic meteology, that are nearly unidentifiable from outer space!!
https://epic.gsfc.nasa.gov/
I’m nearly unidentifiable from outer space but that doesn’t prove I’m a mere figment of some academic’s fevered imagination.
Haha, No, but Hadley cells are 5000 km across so should be apparent….so look at EPIC for a few days and decide if Hadley and Ferrel cells are oversimplified academic bullshit for weathermen-in-training or not.
The cells are not hard to identify if you look at upper tropospheric wind flow.
The ideal concept may be misleading to some extent, but the thermal transfer flow is there.
What I see is the continents creating wakes/eddies, it’s most easily identified after S. America passes, the Andes (note heavy stationary clouds hanging west) that drives through the atmosphere followed by eddies between 60-40 s-lat, that move clockwise. Same with Africa. Enhanced due to both continents “circling” Antarctica.
Well, really easy to identify in my Meteorology textbooks….in satellite views not so much….conclusion….Hadley cells and Unicorns are both valid topics of literature….Coriolis effect, very identifiable….
Bob and Doug eh?
I don’t know about Hadley or Ferrel cells but we sure killed a lot of brain cells with that case of Molson’s last night…
….meteology ?…where is spell check when you need it ?
Spell check is your fiend
No, it’s your worst enema. : )
Why does NASA intentionally brighten every image of Earth? Himawari-8 clearly shows how much darker Earth really is.
CAPE is primarily the result of the high buoyancy of water in air. Explained in fine detail here:
http://www.bomwatch.com.au/wp-content/uploads/2021/08/Bomwatch-Willoughby-Main-article-FINAL.pdf
It also explains why 14,000m is the upper limit the water achieves during convective instability.
The warming ocean surface is the result of the water cycle, ocean to land, slowing down. That follows the reducing differential in insolation between ocean and land that has been occurring since 1585. Oceans are getting less sunlight while land is getting more due to the dominance of water over the surface in the Southern Hemisphere.
Net evaporation from oceans will decline for the next 10,000 years but the wet region is slowly moving northward as perihelion moves later than the austral summer solstice but will eventually coincide with the boreal summer solstice – 10,000 years from now. Climate is changing as it always has.
https://wattsupwiththat.com/2021/11/14/global-water-cycle/
N2 AT# =28, H2O AT# =18
Rick. Indeed the high buoyancy of water vapor (18 g/mol) vs dry air (29 g/mol) does play a big part in convective lift. The higher specific heat of water (4.2. J/g.K) vs air (1 kJ/kg.K) also means that moist air stays warmer for a given amount of adiabatic cooling (expansion cooling due to air rising to a lower pressure level). These factors combine to make moist air rise faster than dry air, even before it becomes cool enough for condensation to occur.
On aviation weather maps there is a dashed brown line, called the “dry line” that is depicted running north/south across the Great Plains. This is the point where dry air from the wet meets moist air from the gulf. Even if the air masses are the same temperature, the less-dense, moist air will ride over the denser, dry air and connective activity (thunderstorms) can occur.
CAPE can only generate above the level of free convection. Convective instability is the result of the CAPE being extinguished. Extinguishing CAPE is an explosive process with moist air literally bursting in to the dry region above the level of free convection.
The CAPE forms through the progressive condensing of water above the level of free convection to create the dry zone. It requires 30mm of water column to create a level of free convection and above 45mm of water column, the instability becomes cyclic.
The paper I linked to gives considerable detail on the process.
Thanks Rick. I scanned the paper. It look very interesting. Can’t wait to read it.
Just to add it goes considerably higher in cells than 14 km (46kft). 18 km can occur.
Not over 31C ocean (the maximum possible open ocean temperature) and starting at sea level.
14,000 m is the upper limit for water (condensation)?
don’t the big thunderstorm anvil tops get up to 20km or even higher?
Open ocean surface temperature does not exceed 31C and the atmospheric profile starts at sea level. The 14,000m relates to these conditions.
Thunderheads can exceed 14,000m by a considerable margin when they generate over enclosed water or land starting at higher surface temperature and higher surface elevation.
Jim, pressure driven climate has been discussed at length for years by Erl Happ. Many, many chapters with observational supporting data.
https://reality348.wordpress.com/
So Convection Available Potential Energy includes warmer conditions. And as was pointed out, “…despite increased detection, total counts have declined over the past 2 decades”
_________________________________________________________________________
As it turns out, warm conditions have declined in much of the so-called “Tornado Alley” in the United States. If you go to NOAA’s Climate at a Glance and Choose “Ohio Valley Climate Region” then select:
:
Maximum Temperature,
6-Month,
October,
1895-2021,
[✓] Display Trend
and click on [Plot]
you will find that for tornado season May through October since the 19th century maximum temperatures have dropped. Here’s what that looks like:
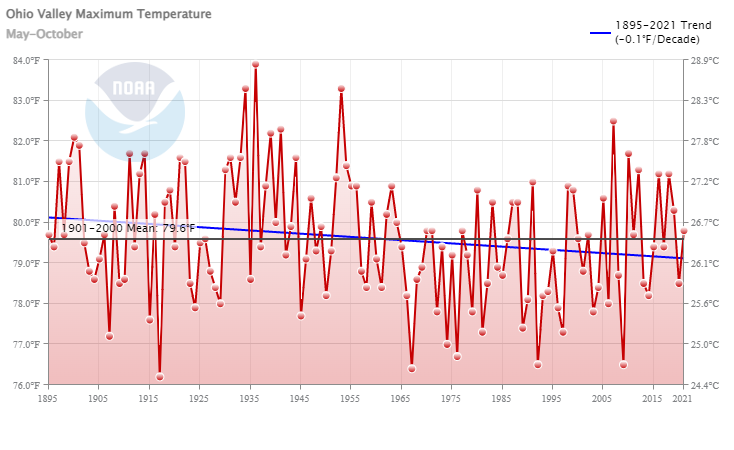
This is true for much of the Eastern United States. Here’s a depiction of that derived from Climate at a Glance data from a few years ago:
Does that Max temperature decline in the warmer months translate into fewer F3+ tornadoes?
______________________________
By the way, is there a link to the data that’s depicted in the bar chart of F3+ tornadoes
that we see at 11:18 in the You Tube Video? My search for such a link has found nothing. It must be buried deep somewhere at NOAA.
Here is the URL which indeed is not easily found from there site (www1.ncdc.noaa.gov/pub/data/cmb/images/tornado/clim/EF3-EF5.png)
Thanks for the reply. That leads to the chart. I know years ago I had a link to the data but most don’t work. This one:
(https://web.archive.org/web/20201230090750/http://www.tornadohistoryproject.com/)
From the WayBack Machine has data up to 2017 and stops. It doesn’t seem to exist anymore.
I was hoping for one like this one for Hurricanes
(https://www.aoml.noaa.gov/hrd/hurdat/All_U.S._Hurricanes.html)
Where did my post go?
New research shows that changes in the upper atmosphere and ionosphere are driven by winds in the troposphere. That is interesting, indicating a direction of causality from lower atmosphere to upper. A lot of commentary on solar phenomena asserts the opposite, that solar wind, and magnetic and other phenomena in the upper atmosphere exert an effect downward, impacting on the lower atmosphere and climate.
https://www.nature.com/articles/s41561-021-00848-4
If there is causal effect in the other direction, from lower atmosphere weather all the way up to ionosphere, that could be challenge to hypotheses of solar and astrophysical causation of climate changes. With causation shown to exist in the other direction, bottom to top of atmosphere, this raises the risk of data interpretation being confounded by cause-effect ambiguity. Phenomena in the ionosphere could be effects, not causes, of tropospheric weather and climate changes.
“14,000 kilometers”? Heard at least twice in the video. Should be meters!
yes,
i mis-spoke It was corrected in transcript
This is at odds my understanding tornado trends and the analysis presented here:
https://agupubs.onlinelibrary.wiley.com/doi/full/10.1029/2018GL080819
5.5% / yr increase over 1994-2016 in tornadic power. This is quite a remarkable claim. Both alarming and demanding an explanation: >100% increase over a 20 year period in a fundamental energy metric. Such an effect in a climatological metric is unheard. Radar technology has not changed dramatically over this period. Cherry (or lucky!?) picking of start/ stop dates? Poor metrics/ analysis/ data? Real physics? How is this consistent with the data on EF-3+ decreases. Should I be concerned that we will see another 100% increase in the next 2 decades? Continuing to 2100?
The idea of tracking fundamental energy metrics is a good one. Extraordinary claims — which this is — demand extraordinary proof. Can someone help me? I don’t have the energy to sort through this BS any more.
From my Facebook blog site De Facto CHEM:
WOW 🤩 REAL POPULAR SCIENCE NEEDS TO BE SEARCHED LIKE A NEEDLE IN A HAYSTACK!
THIS IS ONE PIECE OF INFORMATION THAT CLIMATE CHANGE PUSHERS DON’T WANT YOU TO KNOW!!
I posted before reasoning that we scientists do not subscribe to one specific method of research when finding answers to problems.
I mentioned that the mere fact of taking a thermometer to measure environmental temperatures and reach out conclusions about “climate change”, basically as those defending the “CO2 and global warming” are doing, is simply an unreliable methodology.
In thermodynamics, we have connections between temperature (T), pressure (P) and volume (V). The DIRECT measuring of temperatures has the unfortunate input of too many variables contributing to the reading, and so the connections with gas molecules of CO2 would be only 1 contribution out of many, very hard to isolate.
Instead, the more correct INDIRECT method of measuring from a distinct thermodynamic property like pressure, would provide more reliable conclusions, due to the fact that atmospheric pressure receives much less contribution from distinct variables.
Again, as I’m an observer scientist and a reporter of the situation because I don’t have a lab to study climate change, but I do have the expertise to rationalize the claims, you don’t have to take my word for it.
Here’s a video of a scientist explaining more profoundly the exact point that I’m trying to bring about. Unfortunately the more correct indirect measurements do not support the pusher’s climate change and CO2 agenda.
JBVigo, PhD
Environmental Science & Engineering
https://wattsupwiththat.com/2021/12/21/how-pressure-systems-control-the-climate-part-1-decline-in-extreme-weather/