Author: Kenneth Schultz
Foreword
Across the world, politicians are going out of their way to promise fantastically expensive climate policies. US President Joe Biden has promised to spend $US500bn ($648bn) each year on climate — about 13 per cent of the entire federal revenue. The EU will spend 25 per cent of its budget on climate.
Most rich countries, stampeded by climate activists and peer pressure now promise to go carbon neutral by mid-century.
Surprisingly very few countries have made a serious independent estimate of the cost.
In this study, I estimate the total cost to Australia of achieving net-zero carbon dioxide emissions by 2050 to be around $1.13 trillion.
Any country aiming to achieve net-zero carbon dioxide emissions must replace all fossil fuel burning equipment with carbon-free equipment and generators. Where that is not possible, carbon offsets must be employed.
The Australian Labor Party has pledged it will commit Australia to a target of net-zero carbon dioxide emissions by 2050 if it wins government.
With the Northern Territory signing up for net-zero in July 2020, every state and territory has now adopted a net-zero target.
“Every state and territory has now adopted a net-zero target, meaning Australia now has a de facto national net-zero target,” Climate Council CEO Amanda McKenzie said in a July 10, 2020 statement.
“The national net-zero target is a message to all investors. Australia will be out of fossil fuels by 2050.”
The Prime Minister has been moving towards such a commitment for some months. “Our goal is to reach zero emissions as soon as possible, and preferably by 2050”, said Mr Morrison in a speech on February 1, 2021.
So now it is imperative to closely examine what such a commitment really means for Australia.
In this report, I’ll present what net-zero carbon dioxide emissions for 2050 means for Australia in terms of cost and the rate of deployment of carbon-free energy and the coincident decommissioning of fossil fuel infrastructure.
To conduct the analysis I used data from the federal government report ‘Australian Energy Update, Commonwealth of Australia 2020 – Guide to the Australian Energy Statistics 2020’1, as well as other sources quoted in the endnotes.
Contents
Executive summary
- Definitions
- Energy consumption per annum
- Replacing fossil fuels with renewables
- The task
- Carbon footprints
- Solar farms
- Nuclear power plants
- Cost comparisons
- Carbon offset calculations
- The global warming hypothesis
- Summary
- Endnotes
Executive summary
This study will show that to achieve net-zero carbon dioxide emissions by 2050, Australia will need to:
- Decommission an amount of fossil fuel-burning generators, vehicles and equipment that collectively consume 1,085,000 gigawatt hours of fossil fuel annually and replace with zero emission equipment.
- Install 119,000 wind turbines over an area of 60,000 square kilometres, an area as large as the area of 3 million MCG stadiums. Construction and installation of the turbines will consume 36 million tonnes of steel and 145 million tonnes of concrete.
- Install 6 million rooftop solar systems.
- Build 22,000 solar farms.
- For the 516,000 gigawatt-hours of fossil fuel-burning equipment that cannot be replaced, provide carbon offsets by planting 17 billion trees per annum for a total cost of $238 billion and a total land requirement of 201 million hectares, an area equivalent to 50 per cent of Australia’s total agricultural and grazing land.
- Build 6 nuclear power stations at a cost of $92 billion
- Emit 670 million tonnes of carbon dioxide during the manufacture and construction of the infrastructure
- Spend an estimated total of $1.13 trillion
This infrastructure requirement may be tweaked with more of some items and less of others but it will still need to add up to the total number of gigawatt hours to replace or offset.
The total gigawatt-hours are based on Australia’s current energy usage, derived from the Australian government report ‘Australian Energy Update, Commonwealth of Australia 2020 – Guide to the Australian Energy Statistics 2020’.
If construction started on 1st January 2022, a total of 354 wind turbines would need to be installed every month, or 11.8 every day, until 2050, at a total cost of $476 billion.
In the same time frame, 18,000 solar rooftop systems would need to be installed every month together with 67 solar farms at a total cost of $326 billion.
The total cost would run out at $1.13 trillion, not including ancillary costs such as the construction of power lines connecting remote wind and solar farms to the main power grids.
For all the massive costs and societal disruptions, the impact on global temperatures would be, in the words of Australia’s chief scientist, “virtually nothing”.
1. Definitions
To those not familiar with the subject I will give a brief explanation of the terms and units used in this analysis.
A watt is a unit of power and is used to quantify the rate of energy transfer.
Units: 1 kilowatt (KW) is a thousand watts
1 megawatt (MW) is 1,000 kilowatts = 1 million watts
1 gigawatt (GW) is 1,000 megawatts = 1 billion watts
Electrical generating plants are often designated as having a capacity of so many Megawatts or even Gigawatts, but this is not very helpful as it doesn’t specify how much electricity it can actually generate over a specified time period.
A more useful unit is the megawatt-hour (MWh) or gigawatt-hour (GWh), which is the actual amount of electricity generated over one hour. For example, an electricity generator supplying one megawatt of energy for one hour will generate one megawatt-hour (MWh) of electricity. For generators operating 24 hours per day, such as coal or nuclear plants, a one-megawatt plant can generate 8760 megawatt-hours (MWh) in one year, where 8760 is the number of hours in one year. For a solar farm where the solar panels can only gather energy five hours per day, the multiplier becomes 8760 x 5/24.
A further complication is that the Australian Energy Update Report specified above quotes most energy consumed or generated in another unit, petajoules (PJ). For this analysis, I have converted petajoules to gigawatt-hours, where one petajoule is equal to 277.778 gigawatt-hours.
I added an extra column to the tables derived from the above report showing energy also in gigawatt hours, which makes it easier to follow examples later.
2. Energy consumption per annum
The relevant figures for energy consumption are:

The figures include not only electricity generation but fuels consumed by industry, aircraft, passenger vehicles, trucks, mining equipment and heavy machinery. With over 2 million rooftop solar systems, a number of solar farms and wind turbines, renewables provide only 6.4 per cent of Australia’s energy needs.
The problem of looking to renewables to supply all of Australia’s energy needs by 2050 is the difficulty of scaling up. Some 20 per cent of all residences, mainly the more affluent, already have rooftop solar. This relatively high figure was achieved mainly because of large taxpayer funded subsidies. Under this scheme, the less wealthy homeowners are often subsidising the more wealthy homeowners who can afford to install solar.
3. Replacing fossil fuels with renewables
For Australia to reach its net zero target with renewables, it will have to decommission 1,601,112 GWh of fossil fuel generators and devices (table 1) and replace them with a combination of solar and wind turbines. Where they can’t be decommissioned, carbon offsets will have to be deployed.

Not all fossil fuel devices can be decommissioned. A problem arises with converting large trucks and industrial machinery to electric.
For example, the Caterpillar 797F dump truck is powered by a 4,000 horsepower turbocharged diesel engine. At full power it will require 2.98 megawatts of energy. Assume the truck runs at 50 per cent of maximum power for an eight-hour shift. It would consume around 12 megawatt-hours of electricity. It would need 120 of Tesla’s latest automotive batteries to power it. The batteries would weigh 64 tonnes
This is just an example of the impossibility of converting large machinery to electric. Not to mention converting a Boeing 787.
The following table lists sectors that can only be partially converted.

Let’s assume that 50 per cent of the vehicles and equipment in these sectors can be converted to electric. That amounts to 515,847 GWH to be subtracted from the total fossil fuel amount of 1,601,112 GWH leaving 1,085,265 GWH to be replaced by renewables. The other 515,847 GWH will need to be dealt with by carbon offsets, which we will come to.
The following table lists the sources of renewable energy in Australia for the 2019 year. The only renewables with expansion capability are wind and solar PV, the other sources are mostly static.

4. The task
And therein lies the problem. How do we scale up some 33,000 GWH of wind and solar to 1.085 million GWH, a factor of 33?

A large amount of baseload power will still be needed when the wind stops blowing and the sun stops shining. Storage batteries will offset some of the baseload needs. But without being recharged during prolonged rainy and cloudy periods or wind-free periods, the batteries will run down. Commercial and industrial buildings could not afford to be without power and would still stay connected to the grid.
But wind turbines and solar panels will not cut it, even with backup batteries. They require base-load power and the only means of providing such carbon-free baseload power is by way of nuclear power generation.
Nuclear produced energy is clean, green, reliable baseload electricity. Australian politicians will have to get their heads around the fact that nuclear power is essential in meeting their net-zero targets. There is simply no other way to do it. (See nuclear power generation below)
Let’s assume that the minimum CO2 free baseload is comprised of one nuclear generation plant in each of the six mainland states. These jointly will provide 66,000 gigawatt-hours per annum. That leaves a balance of 1,085,000 hours (rounded to the nearest thousand) to be shared between wind and solar.
If the split is 70 per cent wind and 30 per cent solar it equates to 713,000 GWh for wind, 203,822 GWh for solar farms and 101,911 GWh for rooftop solar, which will require 6 million installations (there is a total of 9 million dwellings in Australia and around 2 million rooftops already have solar.)
One wind turbine can generate on average 6 gigawatt-hours of electricity per annum. In a windfarm, the generally accepted minimum area required for each turbine is 0.5 square kilometres. This is to take into account topography and to ensure minimum air turbulence between turbines.

Wind turbines chop up a large number of birds and bats each year. Figures are hard to come by, but the US Fish and Wildlife Service estimate America’s 67,000 wind turbines kill up to up to 500,000 birds and 888,000 bats each year.2 Based on the US figures, the required 119,000 turbines could kill around one million birds, including the iconic wedge-tailed eagle, and 1.6 million bats annually.
The cost of an average wind turbine of 3 Mw capacity is about $4 million, the cost of installing 119,000 wind turbines in Australia will run out at around $476 billion. In addition, maintenance, estimated at $45,000 per unit will cost an additional $5.35 billion per annum.3
Materials required
Material requirements of a modern wind turbine have been reviewed by the United States Geological Survey. On average 1 MW of wind capacity requires 103 tonnes of stainless steel, 402 tonnes of concrete, 6.8 tonnes of fibreglass, 3 tonnes of copper and 20 tonnes of cast iron. The elegant blades are made of fibreglass, the skyscraper-sized tower of steel, and the base of concrete.4
5. Carbon footprints
All types of electricity generators have a carbon footprint, which is the amount of CO2 generated over its lifecycle, from mining its constituent minerals, to the construction, maintenance and decommissioning of the generator.
Figures vary from researcher to researcher, but I have taken the figures of the 2017 report from the University of Texas as being the most authoritative.5
The University of Texas carbon footprint figures for various forms of electricity generations are shown in the chart below.
One gram of CO2 per KWh equates to one tonne of CO2 per GWh.

6. Solar farms
Many solar farms are being built around Australia but they still account for a small percentage of renewables generation. I used a December 2019 report by MCG Quantity Surveyors6 to arrive at a cost of building a 5-megawatt solar farm. The average cost from the two case studies is $11.9 million. Assuming an area of 20 acres is required for a solar farm of this gives a total space requirement of 963 square kilometres..
7. Nuclear power plants
Currently, there are 440 nuclear reactors in thirty countries in operation around the world. As of April 2020, 55 reactors were under construction, including 4 in the US and 12 in China.
One large nuclear power plant can generate on average 11,000-gigawatt-hours per annum. Australia would need to build 6 such nuclear power plants to meet the minimum requirements of carbon-free baseload power.
Building such a plant requires 40,000 tonnes of steel and 200,000 tonnes of concrete7
The practicalities for Australia are that after overcoming massive environmental hurdles, placing orders, training technicians and incurring long construction times, the first nuclear power plant would not be commissioned before 2030. That time frame is optimistic considering the time allocated to build Australia’s next-generation submarine fleet. That leaves just 240 months to build 6 nuclear plants, or one every forty months.
Australia has by far the largest identified uranium resources in the world8
The cost of building nuclear power plants is very difficult to pin down as the costs vary enormously from country to country due to varying construction costs and varying rates of finance. The only guide I could find is two nuclear plants under construction in Georgia in the US. The final estimated combined cost for both is US 23 billion, or A$ 15.3 billion each.
British firm Rolls-Royce is developing small modular reactors that could be shipped to Australia in containers and erected on site. These are expected to be available by 2030.9 Each unit will have a generating capacity of 440 megawatts capable of generating 3,850 gigawatt-hours per year (this figure is arrived at by multiplying the capacity by 8760, the number of hours in a year- assuming it is online 100%). However, they will not be in production until at least 2030.
8. Cost comparisons
One way of comparing the costs of different energy producers is known as the levelised cost of energy (LCOE) which includes the lifetime costs of building, operating, maintaining and fuelling a power plant.
The LCOE is calculated as the ratio between all the discounted costs over the lifetime of an electricity generating plant divided by a discounted sum of the actual energy amounts delivered.
I have not included an LCOE comparison chart here, because they can be misleading. Generally, wind and solar appear quite competitive in comparisons, but there are two factors not usually taken into account:
- In the calculations, the cost of renewables are generally subsidised by taxpayers
- Renewables require storage systems, such as batteries. Instead of adding the storage costs to the cost of a renewable such as wind or solar they usually appear under their own headings.
9. Carbon offset calculations:
Finally, let’s deal with the matter of carbon offsets. From above we had 515,847 GWH that cannot be replaced with renewables, but only with carbon offsets by the planting of trees. To prevent fraud, the trees must be planted in Australia where they can be monitored.
One kilowatt-hour of fossil fuel burning generates 0.707 kilograms of CO210
One mature tree can absorb 21 Kg of CO2 per annum.11
The table below calculates the total number of trees to be planted annually at 17.3 billion.

The trees will take 20-30 years to reach maturity before they can absorb their full 21 kilograms of CO2 so there will be a constant backlog. A dog chasing its tail comes to mind.
It is difficult to get an estimate of tree planting costs, but let’s assume the cost of each plant, together with labour, maintenance and the acquisition of land amounts to 50 cents per tree. That amounts to $8.5 billion per annum or $238 billion over 28 years. Senator Richard Colbeck, on a tree-planting excursion with the Prime Minister, estimated every billion trees require 400,000 hectares of land, hence, 17 billion will require 7.2 million hectares or 201 million hectares. Over 28 years.
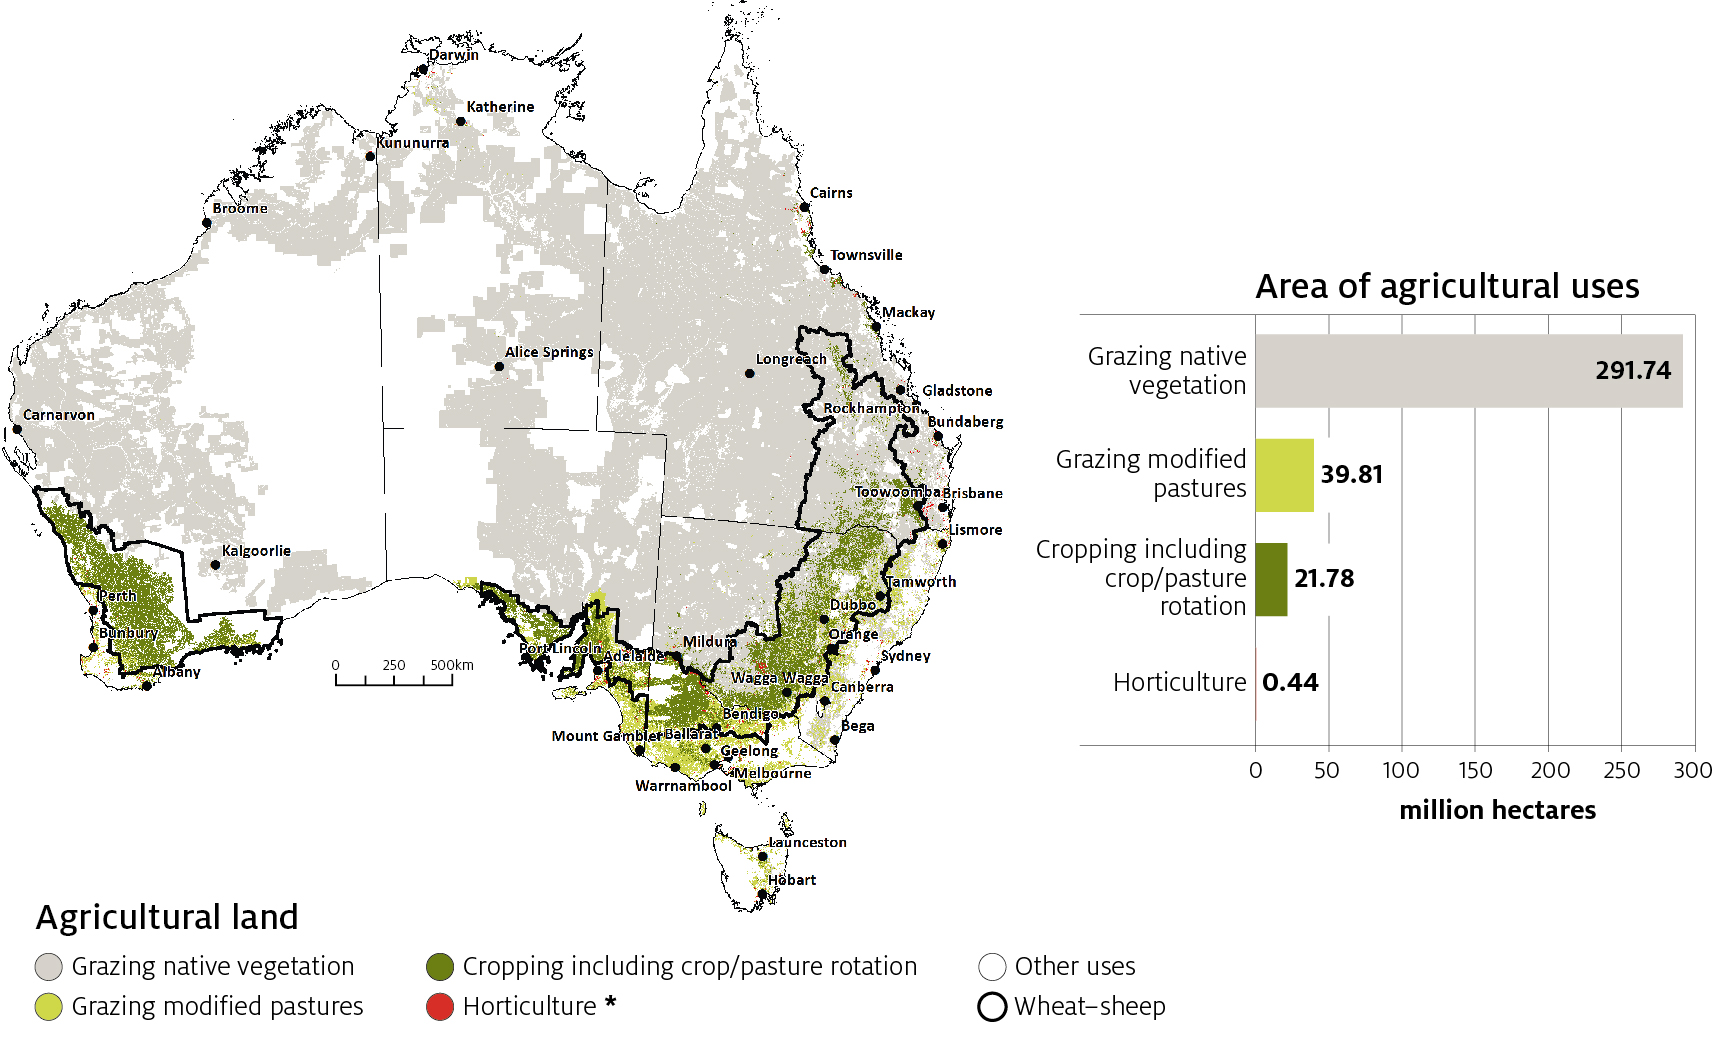
Australia has a total of 353 million hectares of grazing and agricultural land12. The tree-planting program would take up 57 per cent of the total grazing and agricultural land by 2050.
Much of Australia’s grazing land is in semi-arid areas. It would be a logistical nightmare to provide sufficient water during the growing phase of the trees.
10. The global warming hypothesis
All of this economic pain and industrial disruption over an unverified hypothesis about the impact of carbon dioxide on global temperatures. Looking at the climate change subject rationally, it is quite bizarre that a colourless, odourless trace gas comprising just 0.04 per cent of the earth’s atmosphere, and essential to all life on the planet can be routinely described by governments and the media as a “pollutant.” All life is carbon-based, and the primary source of this carbon is the CO2 in the global atmosphere.
There is no scientific evidence the planet is in any danger from runaway global warming. A “consensus” between a select group of “scientists” is not science. Science does not depend on consensus. It depends on testable hypotheses. We have a hypothesis that fossil fuels may be responsible for the very small increase in temperature over the last century. But such a hypothesis can only be tested over a very long period of time. All we have so far are predictive models. These have already been shown to be grossly inaccurate.
As there has been no discernible increase in earth’s temperature for the past twenty years, the term “global warming” has quietly been abandoned in favour of an all-encompassing “climate change”. Now every anomaly, whether it be drought or floods, can be attributed to the nebulous “climate change”.
There is no evidence that hurricanes and cyclones are increasing in frequency and intensity. In fact, the reverse is the case.13
Studies by reputable institutions including the CSIRO have concluded the average sea level rise between 1992 and 2016 is a minuscule 3.31 millimetres annually,14 nothing like the six metres claimed by Al Gore.
The one indisputable fact about CO2 is that it is essential for all life on earth. Without it, there would be no life on earth, for two very good reasons.
Firstly, CO2 is plant food. All plant life depends upon CO2. No CO2 means no plant life and hence no life on earth.
Secondly, the so-called greenhouse gases, of which carbon dioxide is just one, combine to make the planet habitable by raising the average temperature of the earth by some 20 degrees Celsius. Without this greenhouse effect, the planet would largely be an uninhabitable ice sheet.
Carbon dioxide should be revered, not demonised.
Statement from Australia’s Chief Scientist, Alan Finkel:
“On 1 June 2017 I attended a Senate Estimates hearing where Senator Ian Macdonald asked if the world was to reduce its carbon emissions by 1.3 per cent, which is approximately Australia’s rate of emissions, what impact would that make on the changing climate of the world. My response was that the impact would be virtually nothing”.15
Embarrassed, Finkel quickly put out a media statement trying to cover his tracks, but he did not deny his statement.
11. Summary
In section 4, I asked the question, how do we scale up from the current 33,000 gigawatt-hours of wind and solar to 1.085 million GWh, a factor of 33?
Together with the proposed nuclear plants and the carbon offsets (table 5), this is what is required for Australia to achieve its target of net-zero carbon dioxide emissions by 2050.
Table 6 reveals Australia must install 354 wind turbines per month, or 12 every day, as well as 17,842 rooftop solar system and 72 solar farms every month until 2050, a logistically impossible task.

Material requirements of a modern wind turbine have been reviewed by the United States Geological Survey. On average 1 MW of wind capacity requires 103 tonnes of stainless steel, 402 tonnes of concrete, 6.8 tonnes of fibreglass, 3 tonnes of copper and 20 tonnes of cast iron. The elegant blades are made of fibreglass, the skyscraper-sized tower of steel, and the base of concrete.16

All types of electricity generators have a carbon footprint, which is the amount of CO2 generated over its lifecycle, from mining its constituent minerals, to the construction, maintenance and decommissioning of the generator.
Figures vary from researcher to researcher, but I have taken the figures of the 2017 report from the University of Texas as being the most authoritative.17
The University of Texas carbon footprint figures for various forms of electricity generations are shown on page 8
Table 8 reveals that in Australia achieving its 2050 zero-net emissions target, it will be responsible for emitting 672 million tonnes of carbon dioxide.

Table 9 below shows that based on the calculations in this study, the estimated total cost of Australia achieving net-zero carbon dioxide emissions by 2050 is in the order of 1.13 trillion dollars.
By comparison, the federal government’s annual total revenue pre-Covid was $493 billion.

The total cost would run out at $1.13 trillion, not including ancillary costs such as the construction of power lines connecting remote wind and solar farms to the main power grids.”
One country that has not bought into the climate change lunacy is China. Chinese President Xi Jinping must be sitting back smugly watching the Western nation lemmings racing to the economic cliff.
Communist China, in 2020, built over three times as much new coal power capacity as all other countries in the world combined — the equivalent of more than one large coal plant per week. In addition, over 73 gigawatts (GW) of new coal power projects were initiated in China, five times as much as in all other countries, while construction permits for new coal projects also accelerated.18
Also in 2020, China’s CO2 emissions rose by 1.5% while those of most other countries fell. Although in 2020, the world retreated from coal, these retirements were eclipsed by China’s new coal plants.19
Even before China built those new plants, it was already the world’s biggest emitter of fossil fuel carbon dioxide (CO2): In 2019, China was responsible for almost 30% of CO2 emissions — roughly twice the amount emitted by the US, then the second largest emitter.20 China, the planet’s primary coal consumer, already has the largest concentration of coal plants globally;21 in 2020, it produced 3.84 billion tons of coal, its highest output since 2015. In addition, China, in 2020, imported 304 million tons of coal, up 4 million tons from 2019.22
12. Conclusion
And there you have it.
Massive industrial and economic disruption. Unreliable energy. Higher energy prices reducing Australia’s international competitiveness.
Deployment targets that will be logistically impossible to achieve in the time frame.
A gargantuan total cost of $1.13 trillion.
And in the words of Australia’s Chief Scientist, virtually no impact on the world’s climate.
It begs the question, why would any political party want to condemn Australia to such an ill-conceived scheme that would decimate our economy while assisting China to grow economically, politically and militarily.
13. Endnotes
[1] https://www.energy.gov.au/publications/australian-energy-update-2020
[2] https://www.evwind.es/2020/10/01/the-realities-of-bird-and-bat-deaths-by-wind-turbines/77477
[3] https://weatherguardwind.com/how-much-does-wind-turbine-cost-worth-it/
[4] https://pubs.usgs.gov/sir/2011/5036/sir2011-5036.pdf
[5] https://www.factcheck.org/2018/03/wind-energys-carbon-footprint/
[6] https://www.mcgqs.com.au/media/australian-solar-farms/
[7] Ecolo.org>documents>wind-concret-steel-07
[8] NEA & IAEA (2019) Uranium 2018: Resources, Production, and Demand.
[10] https://www.epa.gov/energy/greenhouse-gas-equivalencies-calculator
[11] https://www.usda.gov/media/blog/2015/03/17/power-one-tree-very-air-we-breathe
[12] https://www.agriculture.gov.au/sites/default/files/images/ag-snapshot-2021-2-01.jpg
[13] https://wattsupwiththat.com/extreme-weather-page/
[14] IPCC Fifth Assessment Report (AR5) – Summary for Policymakers page 9
[16] https://pubs.usgs.gov/sir/2011/5036/sir2011-5036.pdf
[17] https://www.factcheck.org/2018/03/wind-energys-carbon-footprint/
[18] https://globalenergymonitor.org/wp-content/uploads/2021/02/China-Dominates-2020-Coal-Development.pdf
[19] https://www.carbonbrief.org/analysis-chinas-co2-emissions-surged-4-in-second-half-of-2020
[21] https://www.carbonbrief.org/mapped-worlds-coal-power-plants
[22] https://www.scmp.com/economy/china-economy/article/3121426/china-coal-why-it-so-important-economy
As much as what I am about to say depresses me; I think there is another aspect that needs to be considered. By 2050 it is likely places like Europe, the US, Australia, and Japan will have much less demand for energy. As the population of the most developed regions is set to plummet before 2050. Even China’s population will fall by almost half. Global birthrates are so low most of our current considerations likely won’t matter to the extent we forecast.
From article at endnotes 2:
“If we’re looking at the bigger picture, wind power’s impact on bird populations is relatively small when compared with other human-related sources of avian mortality. Numerous studies demonstrate that far more bird deaths are caused by collisions with buildings (676 million), vehicles (214 million), and power lines (32 million) in the United States. (It should be taken into consideration, though, that birds killed by wind turbines have historically been of higher conservation value than the robins and sparrows killed by non-wind-related sources.) Cats actually top the list when it comes to annual bird deaths in the United States. (Image courtesy of National Audubon Society.)
Even with its relatively low impacts, the wind industry holds itself to a higher standard and does more to mitigate wildlife damages than any other energy industry. Wind developers constantly evaluate risks to birds before projects are sited, adjusting wind farm design, turbine location and project operations to reduce potential harm. The wind industry follows the U.S. Fish and Wildlife Service’s Land-Based Wind Energy Guidelines—and as a result, over 90 percent of American wind farms now have zero eagle deaths.”
And again I dispute the annual total bird death figures for the USA – if you look you’ll find they are extrapolated from the unique 1980s design site at Altamont Pass – not at all like any modern wind site or installation.
Griff, as usual you ignore the important issues raised and concentrate on a relatively unimportant side issue.
Look at the resources required :-
36,738,864 tonnes of steel which requires coking coal to produce,
143,388,576 tonnes of concrete which is also reliant on coal power for production.
2,425,478 tonnes of fibreglass reliant on fossil fuels for production.
1,070,064 tonnes of copper reliant on fossil fuel for mining.
7,133,760 tonnes of cast iron reliant on fossil fuels.
Then remember that you will need to go through the process all over again in 25 years or less.
Then recall that this is for a country with a population of only 26 million.
Then multiply that by all the other countries in the world that are stupidly going down this road.
You’re right griff. My cat is constantly dragging home eagles. Eagles and hawks also pile up outside my house from their constantly flying into the walls. It’s a bother.
While I have your attention, in which time period would you prefer to live your life? Tick the box:
[__] Benign low CO2 1675-1750
[__] Dangerous CO2 1950-2025
There is a lot of questionable analysis around bird and bat kills. I discussed some of this a coupe of years back:
https://quadrant.org.au/magazine/2019/09/wind-energy-and-the-extinction-of-eagles/
Idiots in NT would sign cos of green/labor/aboriginal mobs, funny how they all want whiteys medical and luxuries provided “on country” but do F all to work pay taxes for it. betcha of that got pulled due to NT going broke real fast that might change;-)
and NT is like Tassie cant meet its own running costs fed govt supports it heavily
Puts a new meaning on the word ” walkabout” !
Soon to apply to all Northern Territorials
If it costs Australia, a rich country with abundant resources such a large amount of money, how on earth are the many poorer countries going to afford net-zero or will countries like Australia have to pay double to give to these countries? The sooner people see this is a humongous fraud scheme the better.
Yet one more great post in a growing list of posts/articles that provide actual data and analysis that confirms unambiguously the total lunacy of thinking that weather dependent unreliables can replace fossil fuels. The biggest problem I see for the developed countries committing economic suicide via “green” energy mandates is that the populace is basically fat, dumb, and happy and are not really paying attention because they are not yet being affected. The poorest people in developed countries still have a standard of living far greater than most people in undeveloped or developing countries. Since the left now controls virtually all media (including social media) and has thoroughly taken over our educational systems, the populace is fed lies daily about climate change and that fossil fuels can be replaced with wind turbines and solar panels. It will likely take some prolonged massive grid failure due to over-reliance on unreliables affecting millions of people with lots of deaths to get people to wake up except that even when/if that happens, far too many people have been so thoroughly indoctrinated that they will continue to believe the problem was not due to unreliables – if we had just built more, the problem would have been averted. China and Russia are ROFLTAO at the stupidity of western “leaders”.
IF you really, really, truly want to get rid of those deadly CARBON emissions, then every political and fake science member of That Group of Whiners has to start the reduction process themselves. How? Make THEM wear and use rebreather equipment 24 hours a day, 7 days a week, 365.25 days per year, and if they travel, they are only allowed to do so by walking, riding bicycles, swimming across large saltwater bodies, and not being allowed outdoors.
They should set the examples for the rest of us peons.
Have a nice summer.
It would need 120 of Tesla’s latest automotive batteries to power (the Caterpillar 797F dump truck).
What fun it will be recharging these when there is a lull in the wind or at night time when fossil fuels have gone. This is way beyond ludicrous.
https://s7d2.scene7.com/is/image/Caterpillar/C781407?$cc-g$&fmt=pjpeg
Carbon neutral is “defund the police” applied to fossil fuel.
It is amazing to see the people in charge of so many wealthy nations stating goals of “net zero” with straight faces when they must know it is very much like promising to run the economy on perpetual motion machines supported by fairy dust and unicorn pee. An all of this with a goal of having exactly zero impact on global weather.It is obvious this will never happen. Politicians seem to have shortened their critical decision making framework to just the next 15 minutes of media coverage. It used to be they at least look forward a few election cycles but now reality doesn’t even get a seat at the table of political strategy.
That’s a lot less than it will take California to do the same – based on a prior article at WUWT referencing estimates by the State. You may be off by at least one order of magnitude.
Here is a BALLPARK capital cost estimate of “going green” for the US and for the entire world.
We are talking tens of TRILLIONS of dollars, just for the US.
WORLD AND US PRIMARY ENERGY CONSUMPTION AND CAPITAL COST
https://www.windtaskforce.org/profiles/blogs/world-total-energy-consumption
World energy consumption is projected to increase to 736 quads in 2040 from 575 quads in 2015, an increase of 28%, according to the US Energy Information Administration, EIA.
See URL and click on PPT to access data, click on to page 4 of PowerPoint
https://www.eia.gov/outlooks/ieo/
Most of this growth is expected to come from countries not in the Organization for Economic Cooperation and Development, OECD, and especially from countries where demand is driven by strong economic growth, particularly in Asia.
Non-OECD Asia, which includes China and India, accounted for more than 60% of the world’s total increase in energy consumption from 2015 through 2040.
PARIS AGREEMENTS
China, India, and other developing Asian countries, and Africa, and Middle and South America, need to use low-cost energy, such as coal, to be competitive. They would not have signed up for “Paris”, if they had not been allowed to be more or less exempt from the Paris agreements
Obama agreed to commit the US to the Paris agreements, i.e., be subject to its financial and other obligations for decades.
However, he never submitted the commitment to the US Senate for ratification, as required by the US Constitution.
Trump rescinded the commitment. It became effective 3 years later, one day after the US presidential elections on November 3, 2020.
If the US had not left “Paris”, a UN Council likely would have determined a level of renewable energy, RE, spending, say $500 billion/y, for distributing to various poorer countries by UN bureaucrats.
The Council would have assessed OECD members, likely in proportion to their GDPs.
The US and Europe would have been assessed at 100 to 150 billion dollars/y each.
The non-OECD countries likely would continue to be more or less exempt from paying for the Paris agreements.
SUMMARY OF CAPITAL EXPENDITURES FOR THE WORLD AND US
The analysis includes two scenarios: 1) 50% RE by 2050, and 2) 100% RE by 2050.
The CAPEX values exclude a great many items related to transforming the world economy to a low-carbon mode. See next section.
50% RE by 2050
World CAPEX for RE were $2,652.2 billion for 2010-2019, 10 years
World CAPEX for RE were $282.2 billion in 2019.
World CAPEX for RE would be $24,781 billion for 2019 – 2050, 32 years; compound growth 5.76%/y
US CAPEX for RE were $494.5 billion for 2010 – 2019, 10 years.
US CAPEX for RE were $59 billion in 2019.
US CAPEX for RE would be $7,233 billion for 2019 – 2050, 32 years; compound growth 8.81%/y
100% RE by 2050
World CAPEX for RE were $2,652.2 billion for 2010-2019, 10 years
World CAPEX for RE were $282.2 billion in 2019.
World CAPEX for RE would be $60,987 billion for 2019 – 2050, 32 years; compound growth 10.08%/y
US CAPEX for RE were $494.5 billion for 2010 – 2019, 10 years.
US CAPEX for RE were $59 billion in 2019.
US CAPEX for RE would be $16,988 billion for 2019 – 2050, 32 years; compound growth 13.42%/y
SUMMARY OF “BIG-PICTURE” CAPEX FOR THE WORLD AND THE US
World More-Inclusive CAPEX
The above CAPEX numbers relate to having 50% RE, or 100% RE, in the primary energy mix by 2050, which represents a very narrow area of “fighting climate change”. See Appendix for definitions of source, primary and upstream energy.
This report, prepared by two financial services organizations, estimates the world more-inclusive CAPEX at $100 trillion to $150 trillion, over the next 30 years, about $3 trillion to $5 trillion per year
https://www.investmentexecutive.com/news/research-and-markets/funding-the-fight-against-global-warming/
NOTE: The Intergovernmental Panel on Climate Change has estimated that an average of $3.5 trillion per year will be needed just in energy investments between 2016 and 2050 to achieve the 1.5-degree target.
https://www.reuters.com/business/environment/us-must-halve-emissions-galvanize-global-climate-action-un-chief-2021-04-19/
US More-Inclusive CAPEX
The ratio of World CAPEX for RE / US CAPEX for RE = 16,988/60,987 = 0.279
A more-inclusive US CAPEX could be $27.9 trillion to $41.8 trillion
The US CAPEX could be less, because, at present, the world is adding a quad of RE at about $58.95 billion, compare to the US at about $102.78 billion.
It is unclear what accounts for the large difference.
Part of it may be due to differences of accounting methods among countries.
NOTE: The CAPEX numbers exclude costs for replacements of shorter-life systems, such as EVs, heat-pumps, batteries, wind-turbines, etc., during these 30 years. For comparison:
Hydro plants have long lives, about 100 years.
Nuclear plants about 60 years
Coal and gas-turbine plants about 40 years
Wind turbine systems about 20 years
Solar systems about 25 years
Battery systems about 15 years
Additional Considerations
1) Fossil Fuel Feedstocks: There are a vast number of systems and activities requiring fossil fuel feedstocks to produce millions of every-day products and services. What would replace these fossil fuel feedstocks? Biofuels would require more than a billion of acres of fertile land.
http://www.windtaskforce.org/profiles/blogs/world-land-area-needed-for-replacing-fossil-fuels-with-biofuels
http://www.windtaskforce.org/profiles/blogs/politically-inspired-marginally-effective-corn-to-ethanol-program
http://www.windtaskforce.org/profiles/blogs/excessive-predictions-of-future-biomass-and-biofuel-consumption
2) Rebuilding for Energy Efficiency: Reforming transportation systems and vehicles, and rebuilding almost all buildings, including housing, would be required to reduce their energy consumption by at least 50%. The world fleet of cruise ships and private yachts and private planes would be outlawed?
Any costs (in the US at least $50 trillion) associated with these 2 items are excluded from the CAPEX numbers.
Any costs for on-going replacements of mostly, short-life RE systems, are excluded from the CAPEX numbers.
NOTE: Achieving 100% RE by 2050, as a slogan, sounds attractive. It likely would be not feasible for a multitude of reasons.
World RE was about 100.18 quads, or 15.98% of total energy consumption in 2019, per EIA.
EIA projects world RE at 252.25 quads, or about 252.2 / 910.69 = 27.7% of world energy consumption by end 2050
See table 1A.
See URL, click on PPT to access data, click on page 4 of PowerPoint for inter-active graph.
https://www.eia.gov/outlooks/ieo/
3) Reliability of Electric Service: High levels of wind and solar on electric grids would require an HVDC overlay grid, connected at many points to the existing HVAC grids.
The HVDC overlay grid would move around electricity to wherever it would be needed, to ensure 99.97% reliability of service throughout the US. The CAPEX for a US overlay grid would be about a $400 to $500 billion.
The CAPEX for site-specific, custom-designed, utility-scale, storage would be about $400 billion/TWh, if $400/kWh, delivered as AC.
For example: The New England grid, fed-to-grid of about 110 TWh/y, would need about 9 to 10 TWh of storage (battery storage or pumped-hydro storage) to cover wind/solar lulls and seasonal variations, if it had 1) much more wind and solar, and 2) no gas-fired CCGT plants, and 3) no nuclear plants, and 4) no major transmission connections to NY and Quebec.
http://www.windtaskforce.org/profiles/blogs/wind-plus-solar-plus-storage-in-new-england
4) Standards for Determining CO2 Reduction: Presently, there exists no standard way to verify the CO2 emissions and RE build-out claims of various countries! The opportunities for cheating/fudging/obfuscation are endless.
– The CO2 of upstream energy is usually ignored.
– Energy systems are rarely analyzed on an A-to-Z basis, because various RE promotion programs would not be anywhere near as attractive, regarding annual costs and CO2 reduction. See Appendix.
When countries such as AU, or states, such as CA, streamline the building of nuclear power facilities, we will have reached a tipping point in the climate scare. They remain delusional otherwise.
I frown on the use of “farm” as in wind-farm or windfarm (this post).
Only in the sense that they harvest subsidies can they be considered farms.
Facilities is a better descriptor – wind power facilities.
When countries or states, such as CA, streamline the building of nuclear power facilities, we will have reached a tipping point in the climate scare. They remain delusional otherwise.
I frown on the use of “farm” as in wind-farm or windfarm (this post).
Only in the sense that they harvest subsidies can they be considered farms.
Facilities is a better descriptor – wind power facilities.
John
Oops! a double
Screw the renewables and just build the nuclear plants.
The problem is indeed a very large one however I am not so sure it needs be quite as bad as this. I tried to look at UK consumption in the same way although not to this level of detail. When looking at energy consumption the conversion of thermal energy to electrical energy is very inefficient, much of the thermal energy is lost during generation. A combined heat and power plant could make use of this but most of electricity generation in the UK do not and instead use cooling towers or the sea – hence why our nuclear stations are by the sea – and this energy is lost. Renewable energy, in the form of solar and wind, provides electrical energy directly (I do appreciate the simplistic nature of this argument) and does not lose energy in the same way. A large proportion of the thermal energy requirement would therefore not need to be replaced.
Yes, Kenneth Schultz sets out a horrendously complex and expensive solution to our “climate emergency”, inasmuch as we can never have enough money, land, or Greens accepted reliable technology to resolve this issue, meanwhile decimating our industry, farming communities and businesses not lucky enough to draw taxpayer subsidies and the resulting obscene profits.
One can see this whole climate emergency diatribe is for the benefit of the 1% ridiculously wealthy businessmen like the mass carbon dioxide producing space junkie, corporate jet flying, but warming knuckle rapping entrepreneur, Richard Branson.
The problem I have is that nobody has yet defined or proven the problem requiring such a dehumanizingly radical “solution”!
Good article. My take is that politicians will keep marching down the path to utopia until the pain of doing so becomes too much to bear. And then they will promptly head off on another impossible dream denying the faith they once professed.
I am attempting to communicate with a politician regarding the futility of wind, batteries and solar and sent her the Kenneth Schultz article above. Her response was not to answer my questions but to question the author’s credentials. Could Kenneth or someone please provide these.
Thank you in advance.
Kenneth,
Thank you. This is the first detailed, practical scenario I have seen. I have tried to get this sort of detail from the Climate Council. Only one uninformative reply to my three attempts. Would you consider sending a link to your analysis to the Climate Council and the Smart Energy Council.
I would be happy to do this if it is OK with you.
Please contact me by email if you wish. Hopefully a moderator could provide my email address to you.
I did similar calculations in May using the Aust Energy Update 2020 and produced similar results to yours. Your work is much more comprehensive. It is just basic mathematics.
Not sure if anyone is still reading this post. I did not think to ask this question when I first read it, so will ask now. One assertion I make is that wind turbines and solar panels cannot generate enough energy to power the process from cradle to grave to reproduce themselves – that is the mining/processing of raw materials, all transportation from mining to manufacture to end site, the manufacturing process, site preparation, ongoing maintenance, ultimate decommissioning, and disposal. This post appears to support that assertion, but I am not entirely certain. This article states “For example, the Caterpillar 797F dump truck is powered by a 4,000 horsepower turbocharged diesel engine. At full power it will require 2.98 megawatts of energy. Assume the truck runs at 50 per cent of maximum power for an eight-hour shift. It would consume around 12 megawatt-hours of electricity. It would need 120 of Tesla’s latest automotive batteries to power it. The batteries would weigh 64 tonnes” – I think that statement alone may confirm my assertion. So, first question – how many of these type/size dump trucks are used in the mining operation for wind/solar? How many wind turbines/solar panels at what capacity would be needed to keep batteries charged (assuming for discussion sake that this is even practical)? How much energy is required to power excavating equipment? From there we need to understand how much energy is required to process the raw materials – that is, separate the overburden from the ore itself, transfer the processed ore to a manufacturing facility, power the manufacturing process, transport finished product to the ultimate destination, prepare the site, assemble the structures, maintain the structures, decommission, and dispose. How many wind turbines/solar panels/batteries would be required to support this entire process without using fossil fuels or nuclear?
Very Briefly.