Author: Kenneth Schultz
Foreword
Across the world, politicians are going out of their way to promise fantastically expensive climate policies. US President Joe Biden has promised to spend $US500bn ($648bn) each year on climate — about 13 per cent of the entire federal revenue. The EU will spend 25 per cent of its budget on climate.
Most rich countries, stampeded by climate activists and peer pressure now promise to go carbon neutral by mid-century.
Surprisingly very few countries have made a serious independent estimate of the cost.
In this study, I estimate the total cost to Australia of achieving net-zero carbon dioxide emissions by 2050 to be around $1.13 trillion.
Any country aiming to achieve net-zero carbon dioxide emissions must replace all fossil fuel burning equipment with carbon-free equipment and generators. Where that is not possible, carbon offsets must be employed.
The Australian Labor Party has pledged it will commit Australia to a target of net-zero carbon dioxide emissions by 2050 if it wins government.
With the Northern Territory signing up for net-zero in July 2020, every state and territory has now adopted a net-zero target.
“Every state and territory has now adopted a net-zero target, meaning Australia now has a de facto national net-zero target,” Climate Council CEO Amanda McKenzie said in a July 10, 2020 statement.
“The national net-zero target is a message to all investors. Australia will be out of fossil fuels by 2050.”
The Prime Minister has been moving towards such a commitment for some months. “Our goal is to reach zero emissions as soon as possible, and preferably by 2050”, said Mr Morrison in a speech on February 1, 2021.
So now it is imperative to closely examine what such a commitment really means for Australia.
In this report, I’ll present what net-zero carbon dioxide emissions for 2050 means for Australia in terms of cost and the rate of deployment of carbon-free energy and the coincident decommissioning of fossil fuel infrastructure.
To conduct the analysis I used data from the federal government report ‘Australian Energy Update, Commonwealth of Australia 2020 – Guide to the Australian Energy Statistics 2020’1, as well as other sources quoted in the endnotes.
Contents
Executive summary
- Definitions
- Energy consumption per annum
- Replacing fossil fuels with renewables
- The task
- Carbon footprints
- Solar farms
- Nuclear power plants
- Cost comparisons
- Carbon offset calculations
- The global warming hypothesis
- Summary
- Endnotes
Executive summary
This study will show that to achieve net-zero carbon dioxide emissions by 2050, Australia will need to:
- Decommission an amount of fossil fuel-burning generators, vehicles and equipment that collectively consume 1,085,000 gigawatt hours of fossil fuel annually and replace with zero emission equipment.
- Install 119,000 wind turbines over an area of 60,000 square kilometres, an area as large as the area of 3 million MCG stadiums. Construction and installation of the turbines will consume 36 million tonnes of steel and 145 million tonnes of concrete.
- Install 6 million rooftop solar systems.
- Build 22,000 solar farms.
- For the 516,000 gigawatt-hours of fossil fuel-burning equipment that cannot be replaced, provide carbon offsets by planting 17 billion trees per annum for a total cost of $238 billion and a total land requirement of 201 million hectares, an area equivalent to 50 per cent of Australia’s total agricultural and grazing land.
- Build 6 nuclear power stations at a cost of $92 billion
- Emit 670 million tonnes of carbon dioxide during the manufacture and construction of the infrastructure
- Spend an estimated total of $1.13 trillion
This infrastructure requirement may be tweaked with more of some items and less of others but it will still need to add up to the total number of gigawatt hours to replace or offset.
The total gigawatt-hours are based on Australia’s current energy usage, derived from the Australian government report ‘Australian Energy Update, Commonwealth of Australia 2020 – Guide to the Australian Energy Statistics 2020’.
If construction started on 1st January 2022, a total of 354 wind turbines would need to be installed every month, or 11.8 every day, until 2050, at a total cost of $476 billion.
In the same time frame, 18,000 solar rooftop systems would need to be installed every month together with 67 solar farms at a total cost of $326 billion.
The total cost would run out at $1.13 trillion, not including ancillary costs such as the construction of power lines connecting remote wind and solar farms to the main power grids.
For all the massive costs and societal disruptions, the impact on global temperatures would be, in the words of Australia’s chief scientist, “virtually nothing”.
1. Definitions
To those not familiar with the subject I will give a brief explanation of the terms and units used in this analysis.
A watt is a unit of power and is used to quantify the rate of energy transfer.
Units: 1 kilowatt (KW) is a thousand watts
1 megawatt (MW) is 1,000 kilowatts = 1 million watts
1 gigawatt (GW) is 1,000 megawatts = 1 billion watts
Electrical generating plants are often designated as having a capacity of so many Megawatts or even Gigawatts, but this is not very helpful as it doesn’t specify how much electricity it can actually generate over a specified time period.
A more useful unit is the megawatt-hour (MWh) or gigawatt-hour (GWh), which is the actual amount of electricity generated over one hour. For example, an electricity generator supplying one megawatt of energy for one hour will generate one megawatt-hour (MWh) of electricity. For generators operating 24 hours per day, such as coal or nuclear plants, a one-megawatt plant can generate 8760 megawatt-hours (MWh) in one year, where 8760 is the number of hours in one year. For a solar farm where the solar panels can only gather energy five hours per day, the multiplier becomes 8760 x 5/24.
A further complication is that the Australian Energy Update Report specified above quotes most energy consumed or generated in another unit, petajoules (PJ). For this analysis, I have converted petajoules to gigawatt-hours, where one petajoule is equal to 277.778 gigawatt-hours.
I added an extra column to the tables derived from the above report showing energy also in gigawatt hours, which makes it easier to follow examples later.
2. Energy consumption per annum
The relevant figures for energy consumption are:

The figures include not only electricity generation but fuels consumed by industry, aircraft, passenger vehicles, trucks, mining equipment and heavy machinery. With over 2 million rooftop solar systems, a number of solar farms and wind turbines, renewables provide only 6.4 per cent of Australia’s energy needs.
The problem of looking to renewables to supply all of Australia’s energy needs by 2050 is the difficulty of scaling up. Some 20 per cent of all residences, mainly the more affluent, already have rooftop solar. This relatively high figure was achieved mainly because of large taxpayer funded subsidies. Under this scheme, the less wealthy homeowners are often subsidising the more wealthy homeowners who can afford to install solar.
3. Replacing fossil fuels with renewables
For Australia to reach its net zero target with renewables, it will have to decommission 1,601,112 GWh of fossil fuel generators and devices (table 1) and replace them with a combination of solar and wind turbines. Where they can’t be decommissioned, carbon offsets will have to be deployed.

Not all fossil fuel devices can be decommissioned. A problem arises with converting large trucks and industrial machinery to electric.
For example, the Caterpillar 797F dump truck is powered by a 4,000 horsepower turbocharged diesel engine. At full power it will require 2.98 megawatts of energy. Assume the truck runs at 50 per cent of maximum power for an eight-hour shift. It would consume around 12 megawatt-hours of electricity. It would need 120 of Tesla’s latest automotive batteries to power it. The batteries would weigh 64 tonnes
This is just an example of the impossibility of converting large machinery to electric. Not to mention converting a Boeing 787.
The following table lists sectors that can only be partially converted.

Let’s assume that 50 per cent of the vehicles and equipment in these sectors can be converted to electric. That amounts to 515,847 GWH to be subtracted from the total fossil fuel amount of 1,601,112 GWH leaving 1,085,265 GWH to be replaced by renewables. The other 515,847 GWH will need to be dealt with by carbon offsets, which we will come to.
The following table lists the sources of renewable energy in Australia for the 2019 year. The only renewables with expansion capability are wind and solar PV, the other sources are mostly static.

4. The task
And therein lies the problem. How do we scale up some 33,000 GWH of wind and solar to 1.085 million GWH, a factor of 33?

A large amount of baseload power will still be needed when the wind stops blowing and the sun stops shining. Storage batteries will offset some of the baseload needs. But without being recharged during prolonged rainy and cloudy periods or wind-free periods, the batteries will run down. Commercial and industrial buildings could not afford to be without power and would still stay connected to the grid.
But wind turbines and solar panels will not cut it, even with backup batteries. They require base-load power and the only means of providing such carbon-free baseload power is by way of nuclear power generation.
Nuclear produced energy is clean, green, reliable baseload electricity. Australian politicians will have to get their heads around the fact that nuclear power is essential in meeting their net-zero targets. There is simply no other way to do it. (See nuclear power generation below)
Let’s assume that the minimum CO2 free baseload is comprised of one nuclear generation plant in each of the six mainland states. These jointly will provide 66,000 gigawatt-hours per annum. That leaves a balance of 1,085,000 hours (rounded to the nearest thousand) to be shared between wind and solar.
If the split is 70 per cent wind and 30 per cent solar it equates to 713,000 GWh for wind, 203,822 GWh for solar farms and 101,911 GWh for rooftop solar, which will require 6 million installations (there is a total of 9 million dwellings in Australia and around 2 million rooftops already have solar.)
One wind turbine can generate on average 6 gigawatt-hours of electricity per annum. In a windfarm, the generally accepted minimum area required for each turbine is 0.5 square kilometres. This is to take into account topography and to ensure minimum air turbulence between turbines.

Wind turbines chop up a large number of birds and bats each year. Figures are hard to come by, but the US Fish and Wildlife Service estimate America’s 67,000 wind turbines kill up to up to 500,000 birds and 888,000 bats each year.2 Based on the US figures, the required 119,000 turbines could kill around one million birds, including the iconic wedge-tailed eagle, and 1.6 million bats annually.
The cost of an average wind turbine of 3 Mw capacity is about $4 million, the cost of installing 119,000 wind turbines in Australia will run out at around $476 billion. In addition, maintenance, estimated at $45,000 per unit will cost an additional $5.35 billion per annum.3
Materials required
Material requirements of a modern wind turbine have been reviewed by the United States Geological Survey. On average 1 MW of wind capacity requires 103 tonnes of stainless steel, 402 tonnes of concrete, 6.8 tonnes of fibreglass, 3 tonnes of copper and 20 tonnes of cast iron. The elegant blades are made of fibreglass, the skyscraper-sized tower of steel, and the base of concrete.4
5. Carbon footprints
All types of electricity generators have a carbon footprint, which is the amount of CO2 generated over its lifecycle, from mining its constituent minerals, to the construction, maintenance and decommissioning of the generator.
Figures vary from researcher to researcher, but I have taken the figures of the 2017 report from the University of Texas as being the most authoritative.5
The University of Texas carbon footprint figures for various forms of electricity generations are shown in the chart below.
One gram of CO2 per KWh equates to one tonne of CO2 per GWh.

6. Solar farms
Many solar farms are being built around Australia but they still account for a small percentage of renewables generation. I used a December 2019 report by MCG Quantity Surveyors6 to arrive at a cost of building a 5-megawatt solar farm. The average cost from the two case studies is $11.9 million. Assuming an area of 20 acres is required for a solar farm of this gives a total space requirement of 963 square kilometres..
7. Nuclear power plants
Currently, there are 440 nuclear reactors in thirty countries in operation around the world. As of April 2020, 55 reactors were under construction, including 4 in the US and 12 in China.
One large nuclear power plant can generate on average 11,000-gigawatt-hours per annum. Australia would need to build 6 such nuclear power plants to meet the minimum requirements of carbon-free baseload power.
Building such a plant requires 40,000 tonnes of steel and 200,000 tonnes of concrete7
The practicalities for Australia are that after overcoming massive environmental hurdles, placing orders, training technicians and incurring long construction times, the first nuclear power plant would not be commissioned before 2030. That time frame is optimistic considering the time allocated to build Australia’s next-generation submarine fleet. That leaves just 240 months to build 6 nuclear plants, or one every forty months.
Australia has by far the largest identified uranium resources in the world8
The cost of building nuclear power plants is very difficult to pin down as the costs vary enormously from country to country due to varying construction costs and varying rates of finance. The only guide I could find is two nuclear plants under construction in Georgia in the US. The final estimated combined cost for both is US 23 billion, or A$ 15.3 billion each.
British firm Rolls-Royce is developing small modular reactors that could be shipped to Australia in containers and erected on site. These are expected to be available by 2030.9 Each unit will have a generating capacity of 440 megawatts capable of generating 3,850 gigawatt-hours per year (this figure is arrived at by multiplying the capacity by 8760, the number of hours in a year- assuming it is online 100%). However, they will not be in production until at least 2030.
8. Cost comparisons
One way of comparing the costs of different energy producers is known as the levelised cost of energy (LCOE) which includes the lifetime costs of building, operating, maintaining and fuelling a power plant.
The LCOE is calculated as the ratio between all the discounted costs over the lifetime of an electricity generating plant divided by a discounted sum of the actual energy amounts delivered.
I have not included an LCOE comparison chart here, because they can be misleading. Generally, wind and solar appear quite competitive in comparisons, but there are two factors not usually taken into account:
- In the calculations, the cost of renewables are generally subsidised by taxpayers
- Renewables require storage systems, such as batteries. Instead of adding the storage costs to the cost of a renewable such as wind or solar they usually appear under their own headings.
9. Carbon offset calculations:
Finally, let’s deal with the matter of carbon offsets. From above we had 515,847 GWH that cannot be replaced with renewables, but only with carbon offsets by the planting of trees. To prevent fraud, the trees must be planted in Australia where they can be monitored.
One kilowatt-hour of fossil fuel burning generates 0.707 kilograms of CO210
One mature tree can absorb 21 Kg of CO2 per annum.11
The table below calculates the total number of trees to be planted annually at 17.3 billion.

The trees will take 20-30 years to reach maturity before they can absorb their full 21 kilograms of CO2 so there will be a constant backlog. A dog chasing its tail comes to mind.
It is difficult to get an estimate of tree planting costs, but let’s assume the cost of each plant, together with labour, maintenance and the acquisition of land amounts to 50 cents per tree. That amounts to $8.5 billion per annum or $238 billion over 28 years. Senator Richard Colbeck, on a tree-planting excursion with the Prime Minister, estimated every billion trees require 400,000 hectares of land, hence, 17 billion will require 7.2 million hectares or 201 million hectares. Over 28 years.
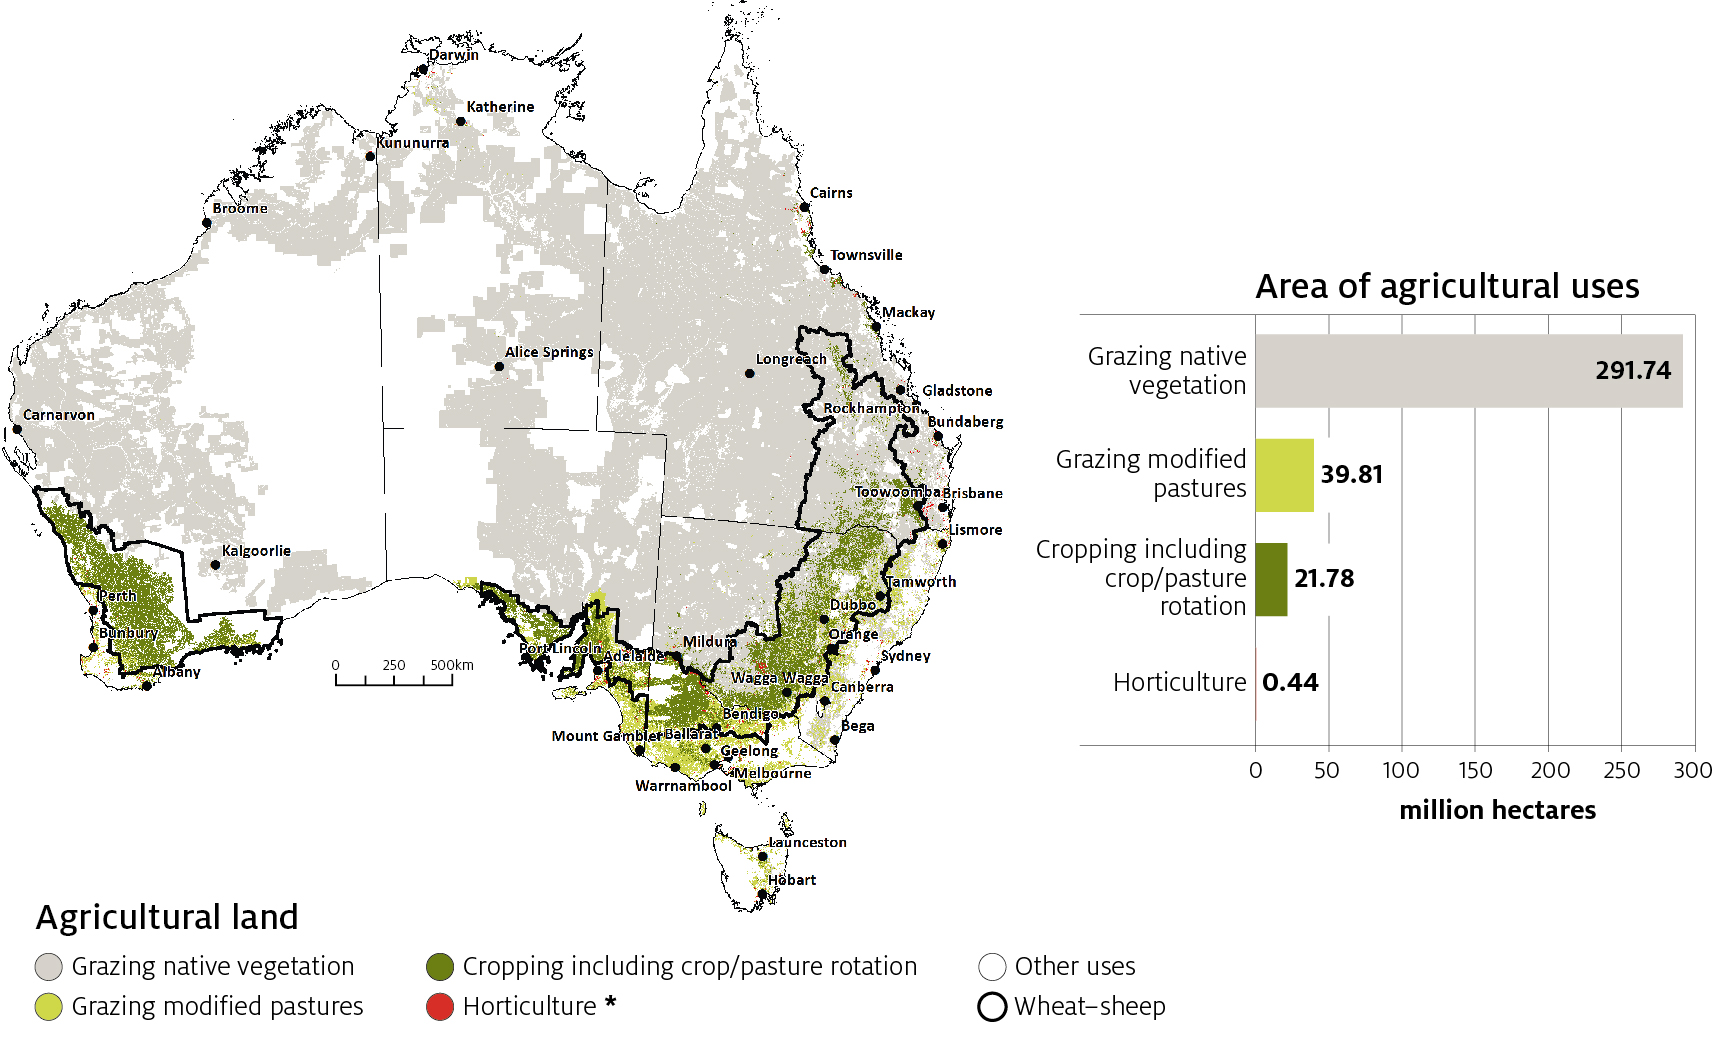
Australia has a total of 353 million hectares of grazing and agricultural land12. The tree-planting program would take up 57 per cent of the total grazing and agricultural land by 2050.
Much of Australia’s grazing land is in semi-arid areas. It would be a logistical nightmare to provide sufficient water during the growing phase of the trees.
10. The global warming hypothesis
All of this economic pain and industrial disruption over an unverified hypothesis about the impact of carbon dioxide on global temperatures. Looking at the climate change subject rationally, it is quite bizarre that a colourless, odourless trace gas comprising just 0.04 per cent of the earth’s atmosphere, and essential to all life on the planet can be routinely described by governments and the media as a “pollutant.” All life is carbon-based, and the primary source of this carbon is the CO2 in the global atmosphere.
There is no scientific evidence the planet is in any danger from runaway global warming. A “consensus” between a select group of “scientists” is not science. Science does not depend on consensus. It depends on testable hypotheses. We have a hypothesis that fossil fuels may be responsible for the very small increase in temperature over the last century. But such a hypothesis can only be tested over a very long period of time. All we have so far are predictive models. These have already been shown to be grossly inaccurate.
As there has been no discernible increase in earth’s temperature for the past twenty years, the term “global warming” has quietly been abandoned in favour of an all-encompassing “climate change”. Now every anomaly, whether it be drought or floods, can be attributed to the nebulous “climate change”.
There is no evidence that hurricanes and cyclones are increasing in frequency and intensity. In fact, the reverse is the case.13
Studies by reputable institutions including the CSIRO have concluded the average sea level rise between 1992 and 2016 is a minuscule 3.31 millimetres annually,14 nothing like the six metres claimed by Al Gore.
The one indisputable fact about CO2 is that it is essential for all life on earth. Without it, there would be no life on earth, for two very good reasons.
Firstly, CO2 is plant food. All plant life depends upon CO2. No CO2 means no plant life and hence no life on earth.
Secondly, the so-called greenhouse gases, of which carbon dioxide is just one, combine to make the planet habitable by raising the average temperature of the earth by some 20 degrees Celsius. Without this greenhouse effect, the planet would largely be an uninhabitable ice sheet.
Carbon dioxide should be revered, not demonised.
Statement from Australia’s Chief Scientist, Alan Finkel:
“On 1 June 2017 I attended a Senate Estimates hearing where Senator Ian Macdonald asked if the world was to reduce its carbon emissions by 1.3 per cent, which is approximately Australia’s rate of emissions, what impact would that make on the changing climate of the world. My response was that the impact would be virtually nothing”.15
Embarrassed, Finkel quickly put out a media statement trying to cover his tracks, but he did not deny his statement.
11. Summary
In section 4, I asked the question, how do we scale up from the current 33,000 gigawatt-hours of wind and solar to 1.085 million GWh, a factor of 33?
Together with the proposed nuclear plants and the carbon offsets (table 5), this is what is required for Australia to achieve its target of net-zero carbon dioxide emissions by 2050.
Table 6 reveals Australia must install 354 wind turbines per month, or 12 every day, as well as 17,842 rooftop solar system and 72 solar farms every month until 2050, a logistically impossible task.

Material requirements of a modern wind turbine have been reviewed by the United States Geological Survey. On average 1 MW of wind capacity requires 103 tonnes of stainless steel, 402 tonnes of concrete, 6.8 tonnes of fibreglass, 3 tonnes of copper and 20 tonnes of cast iron. The elegant blades are made of fibreglass, the skyscraper-sized tower of steel, and the base of concrete.16

All types of electricity generators have a carbon footprint, which is the amount of CO2 generated over its lifecycle, from mining its constituent minerals, to the construction, maintenance and decommissioning of the generator.
Figures vary from researcher to researcher, but I have taken the figures of the 2017 report from the University of Texas as being the most authoritative.17
The University of Texas carbon footprint figures for various forms of electricity generations are shown on page 8
Table 8 reveals that in Australia achieving its 2050 zero-net emissions target, it will be responsible for emitting 672 million tonnes of carbon dioxide.

Table 9 below shows that based on the calculations in this study, the estimated total cost of Australia achieving net-zero carbon dioxide emissions by 2050 is in the order of 1.13 trillion dollars.
By comparison, the federal government’s annual total revenue pre-Covid was $493 billion.

The total cost would run out at $1.13 trillion, not including ancillary costs such as the construction of power lines connecting remote wind and solar farms to the main power grids.”
One country that has not bought into the climate change lunacy is China. Chinese President Xi Jinping must be sitting back smugly watching the Western nation lemmings racing to the economic cliff.
Communist China, in 2020, built over three times as much new coal power capacity as all other countries in the world combined — the equivalent of more than one large coal plant per week. In addition, over 73 gigawatts (GW) of new coal power projects were initiated in China, five times as much as in all other countries, while construction permits for new coal projects also accelerated.18
Also in 2020, China’s CO2 emissions rose by 1.5% while those of most other countries fell. Although in 2020, the world retreated from coal, these retirements were eclipsed by China’s new coal plants.19
Even before China built those new plants, it was already the world’s biggest emitter of fossil fuel carbon dioxide (CO2): In 2019, China was responsible for almost 30% of CO2 emissions — roughly twice the amount emitted by the US, then the second largest emitter.20 China, the planet’s primary coal consumer, already has the largest concentration of coal plants globally;21 in 2020, it produced 3.84 billion tons of coal, its highest output since 2015. In addition, China, in 2020, imported 304 million tons of coal, up 4 million tons from 2019.22
12. Conclusion
And there you have it.
Massive industrial and economic disruption. Unreliable energy. Higher energy prices reducing Australia’s international competitiveness.
Deployment targets that will be logistically impossible to achieve in the time frame.
A gargantuan total cost of $1.13 trillion.
And in the words of Australia’s Chief Scientist, virtually no impact on the world’s climate.
It begs the question, why would any political party want to condemn Australia to such an ill-conceived scheme that would decimate our economy while assisting China to grow economically, politically and militarily.
13. Endnotes
[1] https://www.energy.gov.au/publications/australian-energy-update-2020
[2] https://www.evwind.es/2020/10/01/the-realities-of-bird-and-bat-deaths-by-wind-turbines/77477
[3] https://weatherguardwind.com/how-much-does-wind-turbine-cost-worth-it/
[4] https://pubs.usgs.gov/sir/2011/5036/sir2011-5036.pdf
[5] https://www.factcheck.org/2018/03/wind-energys-carbon-footprint/
[6] https://www.mcgqs.com.au/media/australian-solar-farms/
[7] Ecolo.org>documents>wind-concret-steel-07
[8] NEA & IAEA (2019) Uranium 2018: Resources, Production, and Demand.
[10] https://www.epa.gov/energy/greenhouse-gas-equivalencies-calculator
[11] https://www.usda.gov/media/blog/2015/03/17/power-one-tree-very-air-we-breathe
[12] https://www.agriculture.gov.au/sites/default/files/images/ag-snapshot-2021-2-01.jpg
[13] https://wattsupwiththat.com/extreme-weather-page/
[14] IPCC Fifth Assessment Report (AR5) – Summary for Policymakers page 9
[16] https://pubs.usgs.gov/sir/2011/5036/sir2011-5036.pdf
[17] https://www.factcheck.org/2018/03/wind-energys-carbon-footprint/
[18] https://globalenergymonitor.org/wp-content/uploads/2021/02/China-Dominates-2020-Coal-Development.pdf
[19] https://www.carbonbrief.org/analysis-chinas-co2-emissions-surged-4-in-second-half-of-2020
[21] https://www.carbonbrief.org/mapped-worlds-coal-power-plants
[22] https://www.scmp.com/economy/china-economy/article/3121426/china-coal-why-it-so-important-economy
I don’t see how Australia can have zero fossil fuels by 2050 when there are many places in Australia which are hundreds of kilometres from the nearest electricity. Many places are only accessible by air, typically helicopter, but often light planes, for at least some of the year.
Will flying doctors have electric planes by then?
Those areas would naturally need to be abandoned. You’re savin’ the planet mate!
seen the auspost map?
aboriginal claims to the entire country
places where no one inc them ever COULD survive due to no water little wildlife to eat no trees etc in deserts
but golly gee theyve managed to claim every scrap WAS inhabited by tribes no one ever heard of or saw!!
since some cave in WA was claimed 60k inhabited they now ALL claim theyve been here for that long.
we cant fill the place or survive with tech and 25mil of us
amazing how a few k or them(they say 1 mil) managed that?
2050 AD is a bit soon, but one could harvest energy in space and beam to Earth.
But if you could do that, then industry will move to space so as to get this energy cheaper without the costs of beaming it to Earth.
But before 2050 AD, everyone could have beach house by living on the ocean.
Could make small artificial tropical islands on the ocean.
And when industry in space one can drop prefab artificial islands from space.
This makes almost as much sense as the idea of eliminating petroleum and living on wind and solar power! Any idiot, with a tiny brain, can see that you can NEVER replace petroleum with wind power OR solar power! After all, we are talking about thousands of KW versus Trillions of KW!
Very interesting. So how much would it cost (Including all fuel costs) to keep the current set up going. So cost of new coal/ gas power stations power lines up to 2050?
Look up Eviation among many others
Spending a cost of $1.13 trillion to achieve ‘zero fossil fuels by 2050’ in Australia will have zero effect on the World Climate as the reduction will be swamped by the activities of 1,439,323,776 Chinese and 1,393,827,579 Indians who see no sense in the boondoggle. Meanwhile we are still waiting for evidence that CO2 has any great effect on the World Climate n any case.
India and China will not be forced to do anything, because the rest of the world will be so impoverished, it would not have the ”enforcement” resources.
The residents of asylums will be running the world
they already ARE
greentards wokes n soyboyz abound
Good article.
Which all raises the question that even if the west bankrupt themselves, the rest of the world does not intend to follow the western lemmings over the economic cliff to perish on the rocks of social instability that lie below.
Has anyone worked out what the co2 concentrations will actually be by 2050 if the west removes itself from the equation, but the rest of the word carries on using fossil fuels until they find a better source of energy in due course.
At a minimum it is likely to be 450ppm. Which puts the huge costs and sacrifices in even greater perspective.
Any other estimates?
tonyb
tonyb,
As is well known,Bjorn Lomborg has stated in his latest book and in several columns that it will cost New Zealand 5 Trillion dollars and 16-32 % of its annual GDP (but not 16-32% annually)to achieve Net Zero emissions by 2050.
I think the arguments in this post are correct but the “gargantuan figure of $1.13 trillion dollars” for Australia to achieve this result looks unbalanced versus NZ.
Perhaps it is too conservative, or is Australia’s economy blessed with its mineral and resources income?
Herbert
I have Lomborgs book in front of me. It is a good read.
The UK expects to budget some £2 trillion but that does not begin to take into account all sorts of associated infrastructure. It also conveniently forgets we don’t actually have such things as Hydrogen boilers or that we will require treble the amount of electricity by 2050 than today.
However, having said that are people really willing to destroy their standard of living with dramatic changes to their lifestyle when most (sane) countries don’t intend to follow us? Especially if they realised that by 2050 co2 will be higher than today not lower.
I suspect the govts will need to continue with their elaborate smokescreens as sooner or later when the bills start coming in and the electricity fails, they will realise they have been conned.
The GWPF commented that the Office of Budget Responsibility had failed badly in making the UK estimate since it bought all the lies peddled by the unelected Committee for Climate Change about wind energy becoming cheaper, huge advances in technology probably not even at any serious stage that bring massive increases in efficiency.
Australia and NZ are physically too vastly different to draw any parallels between the costs ?
NZ has less land to devote to renewables, so would have to pay higher prices to acquire it.
Do the costs cited here include land acquisition.
Incidentally, the network costs will be substantial: transmission lines (with losses) to cover long distances for low density resources, needing to be able to transmit peak output, but with only 25-30% capacity factor.
Nicholas brings out the insanity of the whole Paris set up, which requires Western countries to impoverish themselves by forgoing the fossil fuels which brought them to their present level of prosperity while allowing China (now by far the biggest emitter), India, Mexico and others to continue without restriction to use fossil fuels to advance their living standards to an extent well beyond the capacity of so-called renewables. As the ancient Greeks observed those whom the gods wish to destroy, they first make mad.
Projections indicate India and China will each have about 1.46 B folks in 2026. By 2027, projections suggest India will have a larger population than China. China’s will begin to drop by 2040; India’s begins dropping about 2065, after peaking at 1.65 B.
Assumptions are important with such things, so results vary by study. Usually, agencies make more that one set of assumptions and thus projections, as in the link below for Australia.
https://www.abs.gov.au/AUSSTATS/abs@ur momisugly.nsf/Lookup/3222.0Main+Features12004%20to%202101?OpenDocument=
It’s all so absurdly impossible. You have to wonder what the real plan is. We joke that politicians are morons, but actually they’re self-serving and clever. They absolutely have to know that they are promising something completely impossible. How dangerous to our freedom is the real plan?
During the Middle Ages, the Catholic Church had enormous CENTRALIZED POWER AND CONTROL
It had complete control over the minds of the people.
You do as we say, or damnation and ex-communication
Any heresies were dealt with on the burning pile.
It could usurp/extort enormous resources and ORDER the building of huge cathedrals all over the land, for glorifying THE LORD.
In the end, a PROTESTANT MOVEMENT arose!
That is exactly what is needed to finally halt the inane, emotional 2050 insanities
Where do you think the Greens got the idea from?
It’s a message, all right. Start getting your money out of Oz now, before the rush starts – and the walls go up.
In process. The Soveriegn Risk investing in Australia is too high.
Australia is well advanced down the exit from fossil fuels. The consequences are apparent already.
The most important, almost every export industry in Australia will be closed. Whole factories have been relocated to China. Then we import the goods, free of guilt, back from China. China is moving to ban all exports from Australia, iron ore is recognised as being next. Currently China is threatening to bomb some area in Australia. I presume that imports from China will be stopped by China in the near future.
Australia is underperforming. High energy costs, red tape, green tape and CV19 policies out of line with international best practice. My foreign investments are doing better.
well lets hope it stops the chinese who are still buying homes/land/farms/water etc in Aus
Oh they’ll stop buying them alright. I reckon your home will make a nice place for one of the mid-level bureaucrats who will administer 澳大利亚 (ao da li ya) once they’ve put you out. How are you at building solar panels?
I’m bookmarking this post, and will keep reviewing comments in the firm belief that some wind & solar power disciples will come along with a detailed critique that explains where / how / why author Kenneth Schultz is amiss with his analysis and conclusions.
(note – handwaving away numbers and facts is not a legitimate form of critique)
The Australian Energy Update is a marvelous source of data. I did similar calculations in a series of spreadsheets. The result was very similar to what K. Schultz has shown. His work is more comprehensive than mine. Well done Kenneth.
Further, I tried to get some information from the Climate Council. I received an inadequate reply to my first request. The second request was ignored. That was around mid May 2021.
Kenneth’s analysis need to be presented to members of the Australian parliament. We should all use the result of Kenneth’s calculations and ask our local federal member of parliament to respond to some questions we should individually ask. I will be doing just that in the coming week.
Has someone been putting LSD into community water supplies around the world? How can this madness be happening? It seems everywhere in the western world governments have lost all rationality.
Don’t worry. Everyone I know, including me, will be dead by 2050. And everyone who isn’t dead by then will wish they were as their standards of living will all be based on feudalism.
Our kids will suffer then..don’t these young ones today need to see & really understand what they are marching for? Send Greta, UN,WHO a copy of this post and ask for their “expert” opinions & detailed analysis of the costs to net-zero!
Thanks for this detailed analysis, Ken. As Bjorn Lomborg said, ‘wishful thinking is not a sound public policy.’
When you are virtue signaling facts and results are irrelevant. My belief is before the people will allow themselves to be pushed back in lifestyle to 1900 they will revolt. Carbon tax in France anyone?
Lifestyle pushed back to 1900?
People will be dreaming of having such a lavish lifestyle
I predict that NO country will ever reach a goal of ‘net zero’, never….
“Net zero” is a BS term.
It just means countries and wealthy individuals can “pollute” as much as they like as long as they plant a tree.
Real zero is unachievable
Ah now I see a viable path for the weasels. Tree inflation coupled with phantom trees. Plus massive subsidies to tree planting companies that have a license to plant “responsibly”.
Tree inflation
A real tree sequesters x kg of CO2 per year. Through tree inflation (TI), each tree will be modeled to sequester an ever-increasing annual amount of CO2 as ahem, The Science ™ advances. (Thus requiring fewer trees to produce the necessary carbon offsets).
Phantom trees
It is much cheaper and also infinitely more feasible to “plant” or more technically “instantiate” phantom tree objects (PTOs). PTOs will theoretically adjust for the previously unrecognized spontaneously arising dense forests in the Outback due to elevated CO2. PTOs will ultimately cover two-and-a-half trillion square kilometers of Australia. Licensees for PTO instantiation will be paid $5k (AUD) per PTO instantiation. The process for obtaining a phantom tree object instantiation licence (PTOIL) will involve a rigorous government Offsets Commission with commissioners appointed by the Senate to prevent any possible corruption. (Phantom trees will more than cover the gap in carbon offsets, opening up exciting opportunities for international trade in offsets).
Responsible Tree Planting Subsidy
To completely prevent the possibility that unscrupulous money-grubbing capitalists might profit from the massive funding of carbon offsets, a license will be necessary to become a tree-planting enterprise. These responsible tree plantation licenses (RTPLs) will be issued by the Offsets Commission (to ensure the absolute integrity of the process).
Early in the article, it mentions that in some cases it just won’t be possible to eliminate fossil fuel use. So carbon offsets will be purchased.
–
My question is, since ongoing fossil fuel use will require ongoing purchases of carbon offsets, just how many trees will need to be planted each year?
–
If fossil fuel use is a larger amount than the Net Zero by 2050 crowd believes will be needed – I think part of their planning is “and then a miracle occurs” – could tree planting on a massive scale be one of those unintended consequences.
–
I dunno. It could be no big deal.
The accounting trick is not to plant trees. The trick is to promise not to chop them down. You can do that over and over to get all of the credits you require.
Ah… a very sensible solution. Problem solved.
If the world does go mad in the next couple of decades and create a massive demand for solar panels, copper, wind turbines, rare minerals etc, won’t that tend to push the prices of these things up? Esp. as it will take time to ramp up the production capacity.
Do our governments agree this will happen?
What have I missed?
First thing is to build up the nation’s power supply so it can back up all the windmills and photocells when the wind doesn’t blow and the sun doesn’t shine, without emitting the devil gas. Also, to supply all the electric automobiles and the manufacturing facilities required to service the net zero economy. Also, to heat all the buildings electrically. In just 30 years. Better get busy.
According to Lomborg the cost for NZ to go to net zero by 2050 would be 5 trillion dollars and if true the cost for Aussies would be 55 T $. NZ 0.1% and Aussies 1.1%.
The cost for the USA would be about 690 T $, China about 1400+ T $ and the EU about 480 T $.
And Lomborg’s expert team agrees with the 5 T $ estimate by the NZ economics team that arrived at their 5 T $ estimation.
Of course OZ only emits 1.1 % of global emissions so it is all BS and fra-d and the CSIRO tell us that the ENTIRE SH is ALREADY A NET co2 SINK. See Cape Grim site CSIRO.
And Dr Rosling’s BBC video tells us in the REAL WORLD that fossil fuels have increased life expectancy and wealth over the last 200+ years. IOW from poor and sick to health and wealth in just 200 years.
When will these DONKEYS wake up?
https://nypost.com/2019/12/08/reality-check-drive-for-rapid-net-zero-emissions-a-guaranteed-loser/
BTW here’s the CSIRO Cape Grim site link and their quote that the SH is already a NET co2 SINK. Of course the NH is the NET SOURCE of co2. I hope you NH people feel your guilt and shame? SARC.
https://www.csiro.au/en/research/natural-environment/atmosphere/Latest-greenhouse-gas-data
“Seasonal variation””Carbon dioxide concentrations show seasonal variations (annual cycles) that vary according to global location and altitude. Several processes contribute to carbon dioxide annual cycles: for example, uptake and release of carbon dioxide by terrestrial plants and the oceans, and the transport of carbon dioxide around the globe from source regions (the Northern Hemisphere is a net source of carbon dioxide, the Southern Hemisphere a net sink).
The Cape Grim baseline carbon dioxide data displayed show both the annual cycle and the long-term trend.”
I have noticed that climate alarmists have massively understated the costs of net zero promises. Here in Britain, the Climate Change Committe has estimated the cost at 1.4 trillion pounds which has now become the de facto official cost estimate by the British government. Even the Office for Budget Responsibility has accepted this estimate as its basis for future forecasting. The Climate Change Commitee is staffed entirely by climate alarmists who seem to be proud of their science and reality denying positions.
Extrapolating the cost for New Zealand to Britain means that the real cost will be 50 trillion pounds. Of course, this figure would bankrupt Britain instantly. In the next few years the true cost of net zero will slowly become apparent to the general public. Then the fun will start.
But if you don’t succeed with the first bit of emissions taxes, just add more until success is achieved ! Politicians and economists agree…
Just as an aside, let’s say we agree that it would _only_ cost NZ $5T to reduce the global temperature by 0.00002’C/year (as claimed in the recent report).
According to a quick Google search, NZs yearly tax take is $85Bn – let’s call it 100. If my maths is correct, that means NZ would need to spend 50 years worth of its _total tax take_ to achieve that marvellous feat.
Assuming that NZ wants to spend some of that tax on other stuff (NZ has a _massive_ social welfare system), we’re talking about _centuries_ to pay for all this insanity.
This summary is inadequate, because it deals mostly with fossils as fuels, and wind systems and solar systems, etc.
We should be talking about how fossil-based materials are used to make clothes!
What will be used to make the millions of products modern lifestyles demand?
Surely, we will not be just navel gazers while wearing hair shirts.
Never flying, never go on a cruise, never go skiing, or yachting, all energy-intensive activities.
What will be used to asphalt the roads?
At present, tar is a refinery waste product
What will clothes and shoes be made off?
There are a million questions.
Not having fossil feedstocks, is like not having air to breathe and water to drink.
When will this insane, myopic emotionalism finally stop?
This was my thought, also.
What will replace the 6000 products currently produced from fossil fuels?
Perhaps they will order/demand that scientists come up with a solution to producing unicorn farts.
Kenneth
There are some things that would provide a bit more certainty in your analysis:
Regards
John
I don’t think that mature trees will grow much more than this. Immature trees may do. In fact, the best way to sequester carbon dioxide is to chip those trees young and cover your flowerbeds. That fact would annoy most Greenies greatly 🙂
We know that their so called emergency or crisis or existential threat is absurd and here’s why.
Since 1970 Africa has increased its population by 1 billion people and life exp from 47 to 64.
The world pop has increased by a further 4.1 bn people since 1970 and life exp from about 57 to 73 in 2021. Look up the data for yourselves.
All of this in just 50 YEARS and URBAN living percentage has increased as well all around the world.
The portion of the cost attributed to wind and solar hardware is ongoing like the “dog chasing its tail” because of the relatively short useful life.
Meanwhile with so much of the nations wealth and energy tied up in the plan, export returns would be dropping, government receipts falling, unemployment increasing and living standards collapsing.
Even if it were desirable, which it isn’t, it is physically impossible and politically insane to try.
”…would decimate our economy while assisting China to grow economically, politically and militarily.”
Yep, and in our defence we can have charging stations in the outback to keep our tanks going while we wait decades for our submarines to be built for anything that arrives by sea. Oh wait, that’s right, we are an island continent.
You’ve made a bit of a basic error in your initial assumption about how much energy is going to be required. Table 1 is energy consumption by energy type. What this table doesn’t show is the inefficiencies of the energy used. In the electrical sector the energy used was approximately 1600 PJ whilst the energy produced by the electrical sector was about 850 PJ. A coal plant is only going to be approximately 30% efficient in turning coal into electricity as an example.
The same goes for the transport sector. An ICE vehicle is going to be at best 35% efficient and can certainly be as low as 20%. So in this case you’re only going to require somewhere between a quarter and a third of current energy used if all vehicles go electric.
Efficiency of power usage is a moot point if you can’t produce & store enough of it to start with, which is the essential failure of the wind & solar lunacy.
Actually, 30% efficiency for coal is way off the mark. The global average of the existing coal fleet is 34%; best available technology (Advanced Ultrasupercritical, or what GE calls Steam H) gives 49.1%. Since every 1% efficiency gain gives a 2-3% reduction in GHG emissions, simply converting the existing coal fleet over time will reduce GHG emissions by 30-45%.
Nice post!
It shows the net-zero goal by 2050 (or I think even 2100) to be magical thinking.
And the analysis barely mentions the costs of transmission and the limited life
expectancy of wind and solar (which would need to be replaced starting ~year 15 for wind
and ~year 20-25 for solar).
But IIRC nuclear does not efficiently ramp up & down rapidly to be used as backup for the intermittancy of wind/solar. Spinning reserve is better with gas or coal. This likely means some amount of hydroelectric or battery storage would also be necessary. Hydro is geographically limited, and Lithium batteries are terribly expensive (& environmentally unfriendly) and need to be replaced every ~10-15 years as well.
So, wreck the economy and make the nation more fragile, for no detectible climate changes, just feel-good virtue signaling.
In sum: all pain, and no gain.
Where are the engineering societies? Why aren’t they screaming bloody murder about this nonsense?!
The solar Figurw you cite is optimistic. The panels don’t fare too well in storms (refer Puerto Rico) or severe hail events.
You are correct on spinning reserve, though. Alice Springs has heavy reliance on solar and suffered a blackout when a heavy cloud system crashed the system. I also understand France’s GHG emissions have increased since they added substantial wind, because their 790% nuclear capacity cannot adjust quickly to fluctuation in wind output and they have had to add single pass gas turbines for system stability.
I also understand GE now have systems that allow easier ramping for coal units.
The engineering societies, like most professional societies, are run by (and mainly occupied by) people that are employed in a manner that doesn’t require them to work in an efficient manner (govt, education, etc); in addition there are members that are there to just to make them feel good about themselves, or they get the corporation to pay the fees and the members are getting continuing education credits.
It is absolutely amazing to look at the ASCE articles from 80 years. They were useful, even valuable. Now they are simply a form of ‘getting published’ BS that isn’t useful to anyone.
All of this cost risk supposes that eliminating mankind’s CO2 emissions will reduce the global mean temperature anomaly, a statistical construct, by some amount.
Nobody knows if this will happen.
Nobody knows when this will happen.
Nobody knows which statistical construct to use
Nobody knows the optimum reduction amount.
Further, nobody has ever defined the optimum amount of CO2 in the atmosphere and nobody has ever defined the optimum global temperature anomaly.
When governments make plans to spend your money, its usually for a pre-determined reason that is deliverable in a reasonable time. To change the global climate, one first has to change the global weather for 30 years. Good luck with that. Its as if they never heard of the butterfly effect.
Australia is doomed with the policies the current rash of dimwit politicians are dreaming up. Fortunately, I won’t be around to see the full effects of the economic implosion it will cause.
But, but… Australia will become the “world leader in renewables technology”.
If we were to go nuclear – which will never happen because of the politics, there would be no need for wind and solar. All they do is add instability to an otherwise stable grid. Other technologies such as pumped hydro can be used to match supply and demand.
Over to Griff….