Reposted from The Cliff Mass Weather Blog
Monday, July 13, 2020
The headlines are screaming about recent increases in coronavirus cases, with some suggesting that the essential problem is the loosening of the lockdowns and restrictions. A number of media sources note that many of the problematic locations are “red” states with Republican leadership.
It is not surprising that moving out of lockdown resulted in more COVID-19 cases. In addition, the increasing number of tests undoubtedly increases the number of known infected.

But could there be something else going on?
Could increased use of air conditioning, particularly in the southern tier of states, be a significant driver of increasing number of COVID-19 cases?
This blog will attempt to help answer this question.
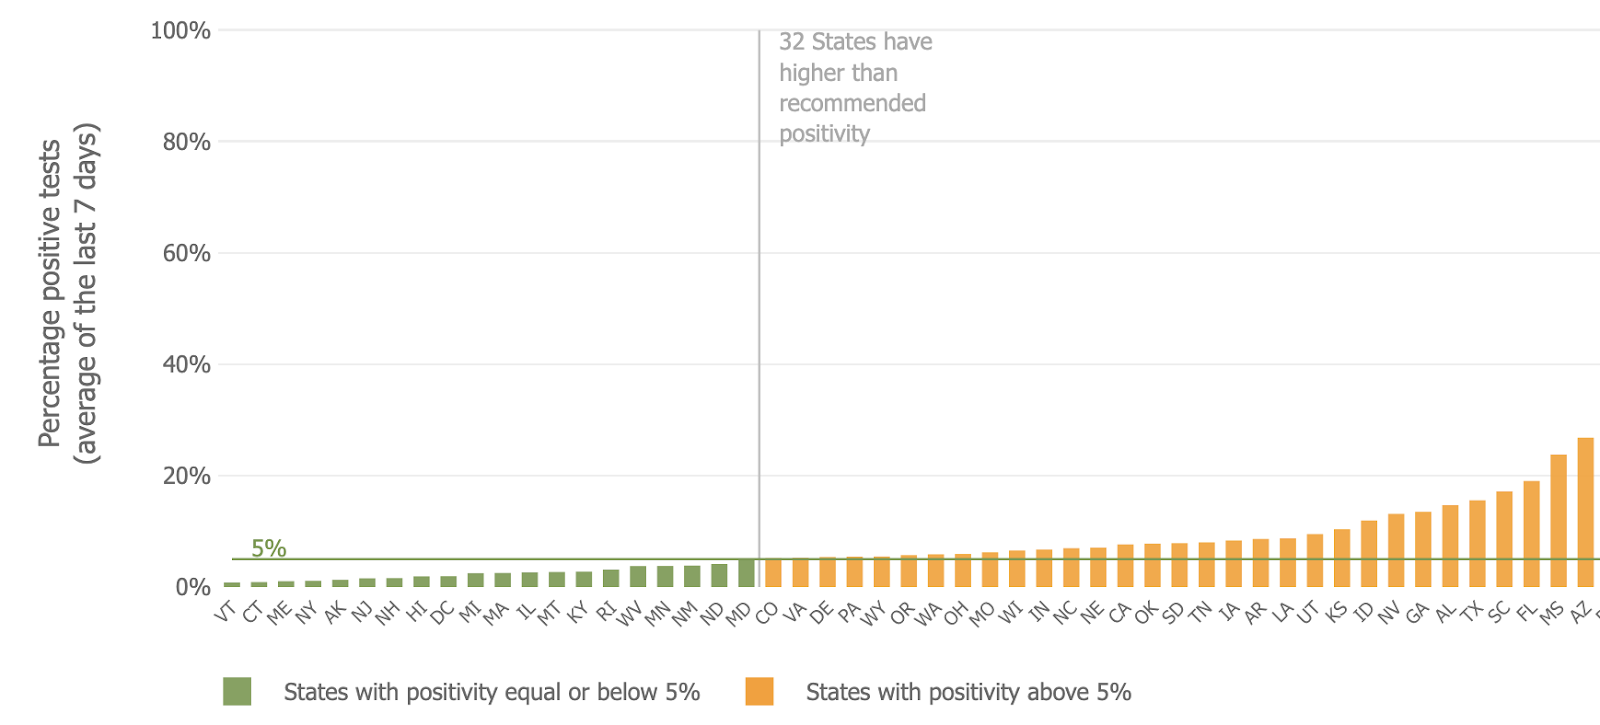
So where is the virus really spreading? A good way to see the problem locations is to view the percentage of positive tests. A worsening epidemic is signaled by a higher percentage of positives, assuming there is widespread testing. Positive percentage is far better than number of positive tests, which, of course, varies by the amount of testing.
Here is a plot of the positive percentage on July 7th. The big problem states were Arizona, followed Mississippi, Florida, South Carolina, Texas, Georgia, Alabama, Nevada, and finally Idaho.

Below is a different type of plot that shows the same thing, but provides the actual numerical values. The bottom line: the situation is far worse for states along the southern tier of the U.S. Arizona is the worst, with Mississippi and Florida right behind. These are states with very different demographics.
But what do these states have in common? Some media outlets are pushing the fact that most of these states are dominated by the Republican party and have been quicker to open up. But they have something else in common: these states have had high temperatures with a lot of air conditioning use. (And no, there is no reason to think that heat turns people into Republicans).
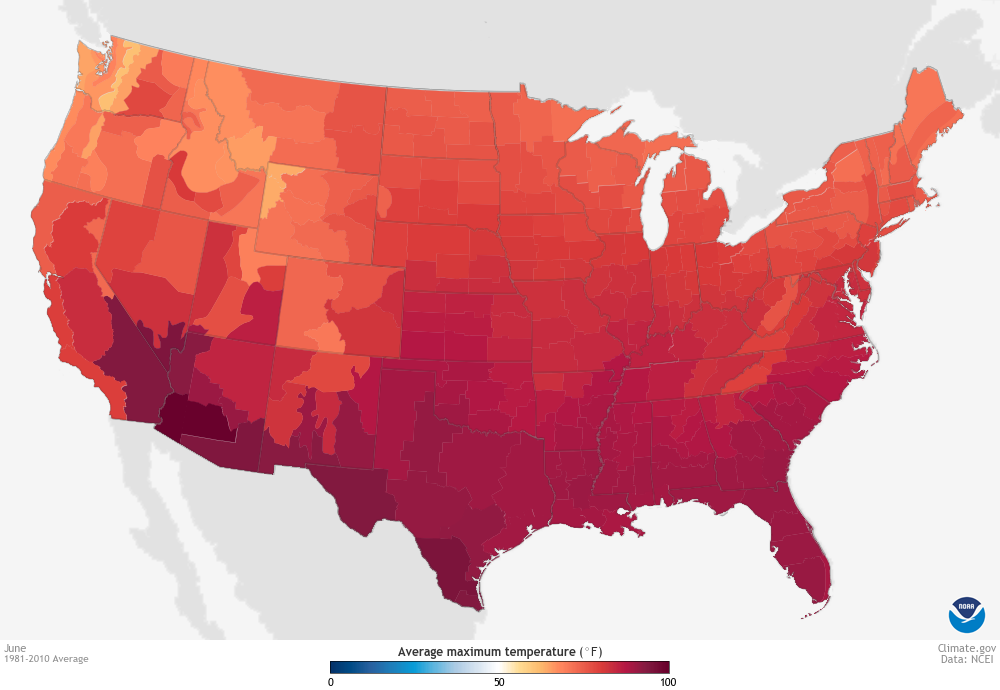
If we look at the high temperatures in June (shown below, NOAA division dataset), southern Arizona (including Tucson) is the nation’s hot spot–and yes, it is the hot spot for COVID-19 as well. Mississippi, South Caroline, Florida, Texas are all very hot. And according to U.S. Census data nearly all homes and most restaurants in these states have AC.
And an independent graphic, showing the high temperatures averaged over the 30 days ending July 7th (Climate Prediction Center), has a similar pattern. Arizona has the highest temperatures.

So let us consider a hypothesis: the rapid warming in late spring led to greatly increased use of air conditioning in homes, stores and restaurants in the warm, southern tier states. More people are thrust into interior spaces with recycled, recirculating air that increases COVID-19 spread, something described in several research papers. And the cooler, drier conditions associated with air conditioned spaces are favorable for COVID-19, and the blowing air spreading COVID-19 containing droplets and aerosols.
Now is this hypothesis consistent with observations? We can begin by looking at the total tests and percent of positive tests in Arizona (see below). Tests went up substantially in May and June, but so did the percentage of positive tests, which has progressively risen since mid-May (the largest increase was in mid-June)
So what happened in Tucson, located in southern Arizona during June? Temperatures exceeded 100F on many days and over half of the month was above normal (green shows the normal range). Some days were way above normal. June is the worst month in southern Arizona–very, very hot without the relief of the southwest monsoon in July. Air conditioning was a necessity and this miserable period is exactly when the virus surged.

Florida had a similar story. Positive percentages surged in middle and late June.

And this is exactly when temperatures surged to way above normal in southern Florida (see below). And Florida has terrible humidity as well. Folks were forced to flock to air conditioned spaces.

You want something more rigorous? No problem.
If I was writing a paper on this topic, I would present a scatter diagram plotting the temperatures against positive percentages of COVID-10. And I have done exactly that below. Specifically, I found the June average maximum temperature for every state in the continental U.S. and its corresponding positive percentage for COVID-19 (Y-axis percentage, X-axis is average high temperature). Each state is shown by a blue dot. I only plotted states with max temperatures in June of 75F or more, which excluded a handful of states that are very cool and have very few air conditioners (e.g., WA, OR, and Montana).
I also plotted a best-fit line (red). There DOES appear to be a relationship between COVID-19 infection rates and temperature. The correlation coefficient is .69, which suggests this relationship explains about 48% of the variability. That is quite a bit. The point in the upper right corner?–Arizona.

Now certainly there are a number of factors that help explain the variability of COVID-19 infection rates around the U.S. But I do think the above results are very, very suggestive that very warm temperatures result in increasing infection rate. Not because the virus likes warm temperatures (it does not, as shown by a number of studies), but because warm temperatures push people indoors into air conditioned spaces in which spread is greatly enhanced. Restaurants and bars are probably key here.
In warmer climates, summer is the time when folks huddle together in confined spaces and thus the greatest potential for COVID spread. The implication of all this is that the situation might be expected to worsen over the southern tier states and into the warm/humid areas of the southeast over the next month or so, but improve during the fall. Clearly, there is reason to avoid air conditioned interior spaces during a COVID epidemic, and dining should mainly limited to outdoor spaces, which should be quite safe.
I agree with the premise of more A|C as one of the major causes of increased spread especially in the Southern hot States.
However, one big potential cause not often discussed is the an migrant worker influx that is estimated at 3 million. Florida, Texas, California are all big destinations for migrant worker. In my home State of Washington, the major outbreak here is in Yakima, Benton, and Franklin Counties, all lower population farming communities. Add in the cramped quarters and you have a recipe for Covid spread.
You only have to view Worldometer COVID-19Tracker to see Mexico, Central and South America have a major Covid outbreak. Hence my theory that migrant workers brought it North and A/C helped it’s spread. Add in reopening, protests for weeks with massive crowds and combined these all result a massive increase in Covid-19.
Flagstaff, in northern Arizona, is at a higher altitude than most other populated areas of AZ, and therefore cooler:
https://weatherspark.com/y/2636/Average-Weather-in-Flagstaff-Arizona-United-States-Year-Round
(or look at recent weather reports for Flagstaff). If the spread is due to the use of A/C, then cases should be lower there. As you can see here, that’s not true:
https://adhsgis.maps.arcgis.com/apps/opsdashboard/index.html#/84b7f701060641ca8bd9ea0717790906
I conclude that it’s not A/C, it’s the stupid people who run around in public without masks.
If for some reason that URL for Arizona cases by zip code doesn’t work, then use this one:
https://azdhs.gov/preparedness/epidemiology-disease-control/infectious-disease-epidemiology/covid-19/dashboards/index.php
and click on “zip code”. It’ll open in a new browser tab.
IF you think a mask will protect you and prevent the spread, do you want to by a bridge in Brooklyn? Show me the science.
GIYF, but since you’re too lazy, try this: https://www.cambridge.org/core/journals/disaster-medicine-and-public-health-preparedness/article/testing-the-efficacy-of-homemade-masks-would-they-protect-in-an-flu-pandemic/0921A05A69A9419C862FA2F35F819D55
(and note that the study was done long before anyone heard of covid-19)
If you want more science, I suggest you do a web search.
BTW, wearing a mask may not protect me much, but it does help prevent the spread.
You are forgetting that most people in Phoenix go north in on the weekends and holiday and vacation to get away from the heat in Phoenix. And with these people comes covid 19 .Right now the virus is spreading from city to city due to road travel. In february the virus was mainly spreading due to air travel. But today very few people are traveling by air.
Certainly a plausible hypothesis and makes a lot of sense, but on the moving from correlation to causation point, this study from 2006 found no live virus on HVAC filters. Is it conceivable that live virus particles were passing through the filters and never deposited or that once deposited they break down quickly but live virust that passes the filters is still being ciruclated? And of course this doesn’t account for what circulated air is doing regarding moving droplets/aerosols around in the space by the force of its discharge from outlets.
Bacteria different story in this study, and see legionella, albeit it was hardly praticle to shut down all the HVAC in the US for the very occasional outbreak.
Indeed, my greatest awareness of work on legionella from within the HVA industry where I sit is the flushing of domestic hot water systems in institutional settings, usually with very hot water. Pretty crazy expense going into this at the moment and i’m not sure what success. Over the long hall it favors forward located hot water systems that make it on demand close to the outlet where it will be used. Although the research on legionella has found that lukewarm closed water systems are good breeding grounds, it hasn’t confirmed a spread mechanism. Research on showering in hospitals for instance came up empty in this regard. Unlike corona virus, legionella is just everywhere but its pathogenic qualities emergence on amplification in numbers and spread mechanism (ironically this greatly implicated outdoor air conditioner condensors with open water cooling and building air intakes that pulled in aersolized legionella from those sources IIRC, and moving intakes and treating the water were low hanging fruit).
https://www.ncbi.nlm.nih.gov/pmc/articles/PMC7132662/
It’s hot, the mask is uncomfortable and the heat makes it worse….
I have to wonder if the condensation on the cooling coil might wash the virus out of the air. though there is a large bypass factor…
need to make sure we are talking about large buildings with A/C, I would doubt that home A/C is a factor, you are already infected or someone in your family, a lot of ways other that airborne to spread the virus.
The connection between the spread of Wuhan and indoor a/c was suggested by one of our AK outdoors reporters (Craig Medred) a month ago. https://craigmedred.news/
There is a possible solution – UVC is used to sterilize both surfaces and volumes of air (medical settings, aircraft interiors, subway interiors). Might be time to look at installing UVC in ceilings of high rooms, pointing the lights sideways and using a ceiling fan to blow air thru the light. Also possible to install the lights in a duct not unlike we do with humidifiers.
Too much hand-wringing these days and not enough creative thinking. Fun part about installing UVC is that it will work against airborne transmission of any other virus or bacteria.
Only thing I don’t understand are costs. Medical grade units are in the thousands of $ (US). Commercial units are in the tens of $ (US). Cheers –
The Chinese study of a restaurant with air conditioning showed that it was the flow of air from the air conditioning blower – over an infected person that carried on over two more tables where most diners became infected. A table with diners that was out of the flow of air from the infected no-one was infected.
You would probably get a similar effect from overhead fans except that the air conditioned air is cold and dry which is more likely to spread the virus than blown room temperature/humidity air. Also a ceiling fan is blowing down and not across diners.
Isn’t humidity the key driver of water droplet borne illness?
Wouldn’t the relative humidity change by AC be responsible?
Maybe just turn the AC down to raise the humidity
NY and NJ are still having almost as many deaths per day as Texas and Florida. Texas has about a 50% higher population than NY and about 10% the number of deaths that NY does. Maybe that will change but i don’t think by that much.
If I wanted to test this hypothesis, I would not make a graph. I would set up an experiment and test the AC filters for virus particles.
Jan
The filters most likely would show nothing. They’re too coarse to stop virons, let alone particles.
Air filters are already rated for their filtering effectiveness against many different things including smoke and virus carrying particles. Read the label.
its been done. posted the study above:
https://wattsupwiththat.com/2020/07/14/is-air-conditioning-contributing-to-coronavirus-spread/#comment-3034707
@Bob Bodor, not sure where you’re getting your numbers from, but if you look at the charts here: https://ycharts.com/indicators/florida_coronavirus_deaths_per_day (you can substitute ‘new_york’ etc. for ‘florida’), you’ll see that in the past week, deaths per day in Florida have been between 35 and 120, while deaths per day in New York (state) have been 5 and 20. Texas: between 43 and 105. New Jersey has been higher than New York, a little less than Florida, Texas and Arizona (and a smaller population than those states, so the death rate is pretty high there).
At any rate, NY is NOT “still having almost as many deaths per day as Texas and Florida.”
The Southern states are still way behind NY and NJ in terms of death rates. They will catch up to some extent unfortunately, but likely will end up much better because susceptible people are being better protected.
Possibly that, but doctors not rushing to intubation is certainly lowering mortality. It’s really turning into a movement. There are still holdouts stuck in the obsolete paradigm, though, unfortunately.
The exhaled human air when it comes out of the mouth is approximately characterized by T = 35 ° C (temperature T in ° Celsius) and Ur = 80% (Ur=relative humidity).
If the exhaled air finds an external environment with the same temperature and humidity conditions, the virus has a 1 chance of infecting a person.
In fact 4.42-2.24-1.91+0.84 is about 1. See equation DX=4.42-T/15.6-Ur/41.9+(T*Ur)/3320 that you find in https://valedo.com/contagio-da-coronavirus-e-safety-distance/ .
In a room with air conditioner we can to measure T=20°C and Ur=30%; applying the previous equation, DX=2.6, that is, the possibility of infecting a person at a distance of 2.6 times greater.
That’s why air conditioning increases the chance of getting infected.
In order for any of these comparisons to have any validity, would it not be necessary for there to be uniformity of testing?
A confounding variable, which we see here in Northern Virginia, is the spread among Hispanics far out of proportion to their fraction of the population. One hypothesis I heard about this is that Hispanics are more likely to live in multigenerational households (kids, parents, grandparents, even great-grandparents) than whites, blacks, or Asians. These living arrangements are the prime suspect for why the fraction of positive cases in NoVA that are among Hispanics is >60%, while they only make up about 15% of the population here. What else does Arizona, Florida, and even Mississippi have as well as A/C? That’s right, lots of Hispanic households. So a proper analysis would control for this aspect as well as just temperature and humidity.
I live in GA and I believe that a reason for much of the increased cases is due to migrant farm workers as case growth has been highly localized and is not uniform across the state. Georgia is at peak harvest right now for many of its most important food crops- peaches, onions, blueberries – and cases have grown substantially in the areas where those foods are grown. The state also reports cases by county of residence and the number 3 county for cases and number one for case growth is “non-Georgia resident”, as well as cases growing most in the 18-40 age group. GA is also by far the largest poultry producer in the US and cases have grown substantially in those plants as was seen earlier in meat processing plants in the Midwest. As harvests began and these workers (mainly from Mexico) moved into the these areas cases began to rise. I also have a home in East TN and we had a similar situation in early June when our largest strawberry producer had to shut down harvest and sales when it was found his entire crew of migrant workers were infected (most asymptomatic). Their 2-week quarantine caused him to lose most of his crop.
That makes sense.
well if you did contact tracing you would know.
and not have to speculate
duh
Hypothesis is that low mortality strains are becoming dominant. The high mortality strains make people ill with symptoms, many end up in hospital or at least isolate at home which reduces chance that the strain spreads. With low mortality strains there is little isolation as many are asymptotic or have mild symptoms thus they spread easier. The low mortality strains effectively then become vaccine for high mortality strains.
I read the test criteria for COVID-19 was derived from a dataset of 8-10 victims who were already very ill. The other risk groups were not included.
Aircon has been posited for the difference in infection rates of Singapore versus say the Philippines in SEA. In the Phils most people don’t have aircon at home because of the expensive power.
There’s such a thing as an “all year” virus you know. Present and spreads all year. COVID-19 is apparently one of those viruses. Why keep pretending your pet falsified theory about why COVID-19 should go away with Summer isn’t really wrong? Clearly that theory should have been abandoned last month. I confirmed by early to mid April that the data available showed that spreading was faster in warmer counties in the southern hemisphere. It was about 25% faster spread than in the colder northern hemisphere countries, within 14 days of data.
Did no one else even bother to check the actual spreading rate numbers for both hotter and colder countries?
Why didn’t you, if you feel so confident your theory is correct? Well it isn’t correct, I found from analyzing the daily spreading data that the opposite was true, it actually spread about 25% FASTER in the hotter conditions, in poorer (non western) countries.
Here’s the tabulation of results from March 29th through to April 11th 2020, showing the ~25% faster spreading within the (then) hotter countries, as compared to the spreading observed in the colder counties:
The only reason it took longer to build the numbers up from a very low level in those developing countries is because they had far fewer large-scale links to the industrial production heartland of central China, early on in the disease. And by the time this data was being gathered a global isolation process had already begun in almost all countries.
But the West had extensive direct links to the area, so the virus spread quickly in the colder western countries, from a lot more carriers being present. Which resulted in the growth in the west in colder conditions becoming extremely quick.
But despite the global isolation policies, the spreading was still about 25% faster anyway in the hotter countries. There was ZERO EVIDENCE that heat or humidity were suppressing it, quite the opposite.
But this falsified theory that Summer SHOULD slow it down, persists all the way into July, in some people’s minds.
BTW, the hotter southern hemisphere countries listed were generally poorer countries where copious air conditioning was unlikely to be present or affordable, let alone a credible cheap electricity network, needed to feed such air cons with the necessary extra electron production and transmission load.
Time to let this go, and look at the actual numbers themselves, and stop just slagging them off as “irrelevant”, and tell us nothing. Well if that’s your attitude, and you don’t look at the numbers, yeah, they can tell you nothing, so you’ll chase your tail around for 3 months.
Is the death rate increasing too?
Whilst the spread of the virus since opening up has been most active in Republican states they are still way below the deaths per million in Democrat states. I feel physically ill when I hear Cuomo from New York giving advice to the Republican states about how to handle the rising number of cases. The media and the democrats are spinning the circumstances for purely political purposes and there is no doubts the Democrats hope that the Corona virus will achieve what the hoax Russian collusion story couldn’t.
Cuomo should be charged for killing the elderly in NY.
Only one mention of mosquito in the comments ?!?
Of course, it’s the mosquitoes and or the fleas!
https://www.cdc.gov/plague/maps/index.html
Interesting video.
I have been following a site called worldometer as a source of global, national, state and county covid data. The charts on state level daily new cases (positive test results) are informative.
Months ago, New York, New Jersey, and Illinois were hit by sky-high numbers of new cases. The virus had spread through the state population before public health measures had been taken and was in community spread. Nevertheless, cases peaked and then went into a precipitous decline. These states have not had an issue since. Why? I have come to the conclusion that preventive measures are simple and effective. Masks, handwashing, social distancing, avoiding crowds, so that compliant people are not in the population available to the virus. The real “herd” for herd immunity consists mainly of stubbornly non-compliant people who won’t wear a mask, insist on hanging out in crowds, and don’t wash their hands. We know the actual cases are 6 to 24 times greater than reported. That is a lot of non-compliant people. NY NJ IL have a kind of herd immunity. But other states, CA, FL, TX, AZ, launched very effective shutdowns early on. This meant people didn’t get sick and herd immunity did not build. Since the reopening, the predictable occurred. The infection curves for these states now look just like New York, at least on the upside. Arizona new cases are beginning to decline, steeply. Texas and Florida are close behind. California, of course, remains a mess. My prediction is that if we just go back to work and let non-compliant people get sick, new cases will fall off dramatically nation-wide within weeks. An FDA approved vaccine is six months to never away. It costs $2 trillion a month to shut down. Better to just wear a mask, protect the sick and elderly, and get on with life.
California has a special problem in that it has been reported that large numbers of Mexicans with covid are entering southern California illegally for medical treatment at state taxpayer expense. If so California can be expected to have the problem longer.
Otherwise I think the story here is that shutdowns only delay the inevitable. The best course of action is to take public health protective measures and let the virus spread among the unwilling until it burns itself out.
Let it spread among everyone, protect high risk groups, elderly and sickly chi’drens, and the rest of us move on with our lives. Oh, and this flu strain was spreading LONG before any “experts” started spewing the idiocy.