By Christopher Monckton of Brenchley
In recent weeks, behind the scenes, a battle royal has been raging among the epidemiologists advising governments. On one side are the activists, who argue that the Chinese virus is both more infectious and likely to prove more fatal than influenza, a deadly combination.
The activists’ strongest arguments are that in the early stages of a pandemic the daily growth rate is exponential; that in the absence of determined control measures a quarter of the global population would be infected by the end of May; and that continued exponential growth at the daily compound rate of almost 20% (entailing a doubling every 3.8 days) that prevailed until mid-March would rapidly overwhelm not only the hospitals but also the morgues, as has already happened in Spain and northern Italy.
On the other side are the passivists, who argue that after a few weeks in lockdown people will cease to observe the restrictions, introducing a second wave of infection. They hold that the best thing to do is let everyone become infected, let the old and the sick die, let the health services collapse, and leave the population to acquire what the lamentable Chief Officer of Health in London described at a press conference some weeks ago as “herd immunity”. The international outcry at this crass remark led the British government to backtrack at once.
I declare an interest. When it comes to preventing pandemics, I am an activist. The earlier one interferes with the exponential growth of a pathogen as infectious as the Chinese virus, the less the cost in lives and treasure. When HIV first emerged, I minuted the Cabinet to the effect that there should be universal testing, followed by immediate, compulsory and permanent isolation of carriers. No such action was taken, unfortunately. The result is that some 50 million have died of HIV, another 500,000 a year die of it, and the cost of treating those who are HIV-positive is heavy. Nearly all those deaths were preventable.
The Chinese virus is considerably more infectious and more fatal than HIV. Realizing this, the British Prime Minister, after weeks of listening to the internal wranglings between the activist and passivist public-health scientists, who were unable to agree among themselves, took a command decision to lock down the United Kingdom firmly, completely and for as long as might be necessary. He was persuaded by modeling from Imperial College, London, showing just how rapidly the National Health Service would be overwhelmed if things went on as the passivists wished. It was clear to the Prime Minister that patients suffering from diseases other than the Chinese virus would be placed at risk as the health system collapsed.
Mr Trump, who, like Mr Johnson (and me) was by instinct reluctant to subject the entire population to house arrest and to cause dislocation and damage to the economy, eventually came to a similar view. The situation is more complicated in the United States, where the individual states rather than the Federal administration are chiefly responsible for public-health measures. But in many states, as in many nations round the world, lockdowns of varying severity have been introduced. The activists have thus far prevailed.
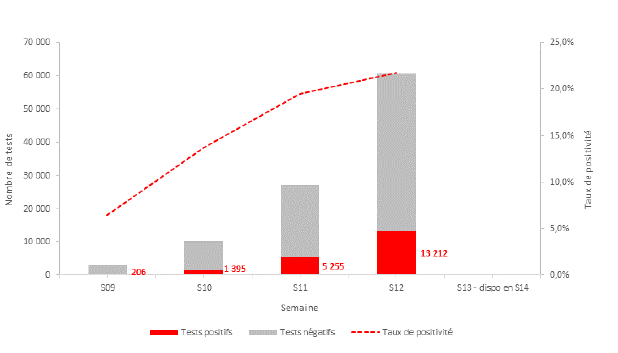
But are the lockdowns working? A simple performance indicator, clear enough to show people whether or not the house arrest and related measures to which they are being subjected should be persisted in, is necessary. Remarkably, however, no such benchmark test is yet available. Therefore, I have been researching the statistics and propose the following test. The reference period for the test is the three weeks from January 22 to 14 March 2020, the date on which Mr Trump declared a national emergency. During the reference period, the mean compound daily growth rate in confirmed cases was 19.8%. Confirmed cases were thus doubling worldwide every 3.8 days.
To demonstrate the extent to which mitigation measures are or are not working, the benchmark test calculates the mean daily compound growth rate in confirmed cases of infection for successive seven-day periods ending on every day from March 14 to the present. Here is the test for the world excluding China and occupied Tibet (whose Communist regime cannot be trusted to tell the truth about case numbers, or about anything else much); for the United States, and for the two worst-affected European nations, Italy and Spain:

All four nations show an inexorable reduction in the daily rate of growth (though it remains dangerously high). The most impressive results are those for Italy, the first country in Europe to impose a strictish lockdown. During the reference period, the Italian growth rate was more than 30% per day, and cases were doubling every 2.6 days. But the lockdown is beginning to work. In the week to April 2, the daily growth rate in Italy was down to 5.2%. Even that is an alarming value: it would lead to a doubling of cases every two weeks. But the trend in the daily growth rate is firmly downward, and it will probably continue that way – provided, that is, that people can see, as they can from this test, that the lockdown is indeed working. In the world outside China, as more and more countries introduce lockdowns, the daily growth rate has declined from 19.8% in the reference period to 11% in the week to April 2. In the United States, the daily growth rate has declined a little, from 23.1% in the reference period to 16.2% in the week to April 1.
Here is the benchmark test for four more countries: three in Europe and one for South Korea. All four countries show declines in the daily growth rate of confirmed cases. But in South Korea the pandemic is almost under control:

The reason for the success in South Korea is that, following the SARS epidemic, the public health authorities fully understood the paramount importance of very widespread testing, immediate isolation of carriers and vigorous contact-tracing, including use of the cellphone network to identify where the carriers had been and whom they had met. The EU has picked up this idea, though the UK – in this as in much else – lags behind.
In particular, ever since the SARS epidemic the Korean public health authorities have maintained a very large testing capacity. They activated it as soon as they realized that the director of the World Health Organization, who has close links to the Peking regime and had as recently as January been parroting Chinese propaganda to the effect that the virus could not be transmitted from human to human, could not be relied upon.
Britain will be calling for an independent investigation of the WHO’s gross misconduct in this affair as soon as the pandemic is under control.
South Korea also adopted national lockdown. The public health authorities also recommend use of personal protective equipment (notably face-masks) not only by health professionals but also by the general public when outdoors. In this respect, too, the South Korean public health authorities disagree with the WHO, which has today announced it is reconsidering its notion that masks are valueless. The director of Korea’s public health authority bluntly says that the evidence that masks work is overwhelming.
Following his advice rather than that of the useless WHO, I wear a full-face motorcycle helmet and gauntlets whenever I leave our own grounds. Full-face protection is useful, according to the South Koreans, because the Chinese virus can enter the body not only through the nose and mouth but also through the mucous membranes of the eyes. Even wearing spectacles provides some measure of additional protection. As South Korea’s expert made clear in an excellent recent interview, it is necessary to obtain every advantage one can, because each additional barrier to transmission helps to bring the pandemic under control.
It is South Korea, then, that provides the clearest evidence that prompt, determined and vigorous control measures work, and work well.
Both Germany and France have done quite well in beginning to control the pandemic. Their mean daily growth rates were down from more than 30% in the benchmark period to around 10% in the week to April 2. The United Kingdom, however, had a daily growth rate of 16.4% in that week: a value scarcely better than the global 19.8% during the reference period from January 22 to March 14. The UK is the worst-performing of the 12 territories tracked here.
Germany and France both took advantage of the EU’s system for supplying both testing kits and personal protective equipment for health professionals. The UK, however, failed to respond to the EU’s email in time. Worse, British civil servants are so used to acting simply as passive agents for the Brussels tyranny-by-clerk that they were more or less completely unprepared for a pandemic, and the flapping-around is saddening to watch.
The former director of “Public Health England”, a grim but useless bureaucracy, was asked four times yesterday why it was that Germany had tested more than 500,000 of its citizens in all, while Britain had not yet managed to test 10,000 in any one day. He could not answer.
Here are benchmark tests for four more countries: Canada, Australia, Sweden and Ireland. Note that for Ireland the benchmark period is the two weeks to March 14 rather than three weeks, because Ireland began to report cases later than other countries.

From the point of view of the passivists, Sweden is the most interesting result. For its public health authorities are passivists: they have not introduced a lockdown. Yet their daily growth rate has fallen to 10%, among the lowest anywhere. Nevertheless, there is growing concern among health professionals in Sweden that the do-little option may yet prove fatal. It is possible, then, that Sweden will follow other European countries in imposing a strict lockdown in the near future. In the past ten days, other countries have seen a decline in the daily growth rate of confirmed cases, but Sweden, uniquely, has not.
Overall, the benchmark test show – at this early stage – that the lockdowns are beginning to work. The daily growth rate in confirmed cases is falling in those countries that have been locked down, and is tending to fall fastest in countries with the most determined control measures.
The next few weeks will be particularly interesting, because it is in the nature of exponential growth curves that, just as the growth is very rapid if control measures are not tough enough, the slowing of growth is just as rapid when the measures really begin to bite.
Over the next few weeks, the extent of the lockdowns’ success or failure will become evident. For this reason, I propose to update the benchmark tables daily until further notice.
It should be made clear that the benchmark test is not policy-prescriptive. It merely shows, in a dispassionate fashion based on the available data (warts and all) the extent to which control measures are or are not working, territory by territory and for the world excluding China.
Finally, the question arises whether the official data on which I have relied are trustworthy. The answer is that they are not, for the lack of widespread testing has entailed a very substantial understatement of the numbers infected.
Take the United States as an illustration. On average the Chinese virus takes five days to incubate and a further 16 days to kill those to whom it proves fatal. The least unreliable of the official statistics are those for deaths caused by the virus. On February 29 the United States reported its first death from the virus. The World Health Organization, which had originally estimated a death rate of 2% (as it had with SARS, whose death rate was actually 9.6%), now estimates it at 3.4%. In that event, 21 days previously, on February 8, there must have been 1 / 3.4%, or 29 cases. However, only five cases were reported. But if there were 29 cases on February 8, and if the growth rate for unreported cases is the same as for reported cases, the true number of cases by February 29 was not 5, as reported, but more than 2300.
Performing a similar calculation for each day until April 2 would lead us to conclude that there were not 26,500 cases of infection in total by that day, as reported by the U.S. administration, but 36 million. Curiously, if this were true it would not be all bad news. For the death rate would then be less than 0.02%, rather than the WHO’s 3.4%.
What is more, since only 6000 deaths have been reported in the U.S., the vast majority of those infected would have suffered symptoms little worse than those of the common cold and have recovered, in which event the “herd immunity” of which the British public health commissar spoke is being built up at a rapid rate.
If the death rate is only 1%, it is possible that 123 million people – more than one-third of the U.S. population – are already infected. If, however, it is 10%, as for SARS, then about 12 million U.S. citizens are infected.
What, then, is the true death rate? This early in the pandemic, the answer is that nobody really knows, even to within an order of magnitude. The standard method of obtaining a preliminary assessment of the death rate in the early stages of a pandemic is to consider the closed cases – those who, having been infected, have either recovered or died. Until April 2, 135,447 people outside China and occupied Tibet were reported as recovered from the infection, while 49,845 had died. Therefore, 185,252 had either recovered or died, and the deaths represented not 2% nor 3.4% but almost 27% of all these closed cases. I have not seen that figure reported anywhere, but that is the figure.
If the death rate is indeed 27%, then only 4.6 million U.S. citizens are infected, compared with the reported. However, the 27% figure should be regarded with some caution, since it takes no account of the under-reporting of cases, many of which will have been recoveries or asymptomatic. But it does suggest that of the currently-active 748,153 confirmed cases outside China more than 200,000 will be likely to die worldwide.
The Chinese virus, then, will be a biggish killer, either because far more are infected than are being reported or because the death rate is higher than the WHO imagines, or both. At this stage, we do not know: but no responsible government, seeing figures such as these, would consider itself as acting responsibly if it were to fail to ensure that energetic control measures were put in place.
In all this mishmash of competing statistics, the one certainty is the daily mean rate at which reported cases have been increasing. That is why I have chosen this measure as the basis for the benchmark test.
My hypothesis is that, thanks to the decisive measures taken by most governments, the daily growth rate of total confirmed cases will continue to fall, and that about 1-2 weeks from now the fall will become quite rapid, perhaps buying enough time for health services to increase their capacity to handle intensive-care patients on ventilators, and to perform antigen tests for the presence of the virus and, no less importantly, antibody tests to demonstrate that those who have recovered are immune.
If the daily growth rates do not fall very quickly to South Korean values, then the capacity of health services will be overwhelmed. As of yesterday, the hospital ship sent by President Trump to New York had just three patients on board. Expect the ship to be filled to capacity within days.
Keep safe. And come back here daily for the updated benchmark test.
The former mathematician in me decided it was about time to use the data we have to make a direct assessment of Christopher Monckton’s hypothesis that the lockdowns are working.
What I did was look, not at comparisons between countries, but at the graphs of total cases and daily new cases which are readily available on worldometers.info. As long as the reporting of cases within a country is done in the same way each day, I should be able to make reasonably reliable comparisons between the numbers of cases in a country at different stages of the epidemic. I simply picked the top 12 European countries in terms of total number of cases, and looked at the graphs for each.
First up was Spain. Something interesting jumped right out of the paper at me when I looked at the total cases graph. The curve comes in two parts; an exponential part, followed by a pretty much linear part. The transition in Spain was quite sharp, around March 24th. The daily new cases graph shows it, too; new cases were increasing exponentially up to about that date, and since then have been increasing far less, or even static. The Spaniards seem to have brought in their lockdown very quickly on March 13th and 14th, so the change in the regime came about 10 days after lockdown. Not at all far from the incubation period of the virus, of which the best estimate I have heard is 6 to 14 days.
Next, Italy. Here, you see the same thing. An exponential phase, followed by a linear phase. The transition came somewhere around the peak of March 20th. When did the Italians go into full lockdown? March 8th, says Wikipedia. 12 days.
You can also see a wobble in the total cases line since 20th March. This shows up as an oscillation in the daily new cases, with a period which looks to be around 5 to 6 days. And the Italian daily cases now look as if they’re on a downward trend. Furthermore, you can see a similar wobble in the data before 20th March – there are often peaks 5 or 6 days apart. I don’t know what it is about the virus that causes this effect, but I’m not an epidemiologist.
Looking again more closely at the Spanish data, you can see the wobble there too, though it’s easier to see if you look at the minima rather than the maxima.
To Germany. Again, an exponential part followed by a linear part with a wobble. The wobble seems to have a bit longer period here, 6 to 7 days. The peak day so far was March 27th, only 5 days after Germany went into full lockdown. But equally, the effect may have come near the mid-point of the cycle. It’s not yet clear whether the overall trend in new cases in Germany now is up as in Spain, or down as in Italy. Time will tell.
The French problems with nursing home deaths data seem also to have applied to case data from those sources, so I’ll skip France.
UK data is inconclusive, but you surely can see that wobble between March 27th and April 1st! We’ll have to wait another week to see on this one. My best guess is a graph similar to Germany’s, with the transition to linear coming in the middle of the next cycle, since full lockdown began on March 24th.
Switzerland follows the Italian model of peaking, then starting to go down gradually. The wobble is a lot less obvious here. The peak on March 20th was only 4 days after the Swiss went into full lockdown, but they did start a partial lockdown on February 28th, and the Swiss are very law-abiding people.
Belgium started lockdown on March 18th, and the transition to linear may well have come around March 28th. Again, time will tell.
The Netherlands has a similar pattern to Spain, though with far less cases per million.
Austria looks to be the country which is ahead of the game – there is a clear flattening out of the total cases curve, and a very significant drop in daily new cases since that mighty peak on March 26th. I suspect the peak is higher than it ought to be because of late reporting of cases which actually happened on March 25th; but they went into lockdown on March 16th, which is… 10 days before the peak.
Portugal is another inconclusive one, like the UK. If that big bar on March 31st does turn out to have been the peak, it will have been 12 days after start of lockdown.
Sweden… ah, Sweden. This is the one which, I expect, will prove the matter one way or another. Looking at the total cases graph, what I see is not an exponential followed by a linear part with wobbles, but an exponential with wobbles. Yesterday’s low number notwithstanding, I don’t see anything in the daily cases yet to suggest any transition to linearity. And the Swedish semi-lockdown began on March 17th. If the Swedes are in big trouble at the top of the next wobble cycle, probably around April 8th, we’ll have some good evidence to support Christopher Monckton’s contention that the hard lockdowns are working.
Lastly, Norway is a really odd one. That March 27th figure looks suspicious to me; unless the wobble has a far longer period in Norway than anywhere else. Moreover, if there has been a transition to linear, it seems to have happened on March 12th – the precise day they locked down!
All in all, I think the prognosis is quite good for Christopher Monckton’s hypothesis that the lockdowns are working; but maybe not so good for our Swedish friends.
For cases and deaths the chart you want to do is as follows
x axis = log(cumulative cases)
y axis = log(new cases)
Now, daily cases may be a bit noisy, so you probably want to plot log(weekly cases)
versus the corresponding log( cumulative cases)
For an exponential this will give you a straight line, such that a deviation from the straight line
will be obvious.
This works for deaths as well, But the issue is that death data since the lockdown has not accumulated enough data yet. people dying today were admitted ~18 days ago.
if you fo this for Korea, for example, yu will see that the death curve is just starting to deviate from
exponential.
( this is kinda like a process control chart)
This would also apply to log( daily cases ) against time. Why plot against cumulative total , not time ?
I generally only do log-log plots as a last resort since they turn nearly anything into a straight line and are not very sensitive to change and thus detecting change, at a specific point.
What does the slope of the graph you suggested represent in the model?
This would also apply to log( daily cases ) against time. Why plot against cumulative total , not time ?
Time is implicit , since the x axis runs from zero cases cumulative to the maximum.
do the plot you’ll see
Example
Thanks for the reply and the example.
Of course time is implicit but you are a) distorting time by using the S-surve instead and log compressing it. This effectively stretches the early data and compresses later data.
What I am asking is why you would want to do that. If there is a reason that this brings out something which would otherwise be less visible fine. I’m asking if you have such a reason.
Also cumulative totals are an integral which is a low pass filter. If we are looking for the earliest sign of change in order do something more informed than “bang,bang, weld it shut”, then that would seem to less use than plotting daily changes.
What you are suggesting seems to be about the least enlightening way to visualise the available data.
Steven: I’m a simple-minded guy (even if I was once a Cambridge mathematician), so I prefer to use data I can directly relate to. Also, the derivative of an exponential is itself an exponential, so during the exponential phase of an epidemic, the new cases and the totals will follow the same curve (on different scales, of course). You’re right that a deviation from a straight line will be obvious on the plot you suggest; but the change from an exponential to something much straighter in, say, the Spanish total cases since around March 24th is obvious to me. And even more obvious when you look at the daily new cases.
If looking at this over a longer period, I can see the point of weekly smoothing because of what I call the “wobble.” But on something like this where individual days matter, you’ll miss potentially important repeated patterns. Like a peak, then down, then up in a big way. Examples: Spain from March 21 to 26. UK from March 21 to 27, and again from March 27 to April 1. Switzerland from March 16 to 21. Belgium from March 22 to 28. Netherlands for exactly the same time period. Portugal from March 23 to 28. Sweden from March 20 to 28, and again from March 28 to April 2. That last is why I am starting to fear (a little) for my Swedish friends. My approach is (paraphrased) to look at the data, the whole data, and nothing but the data.
But for deaths, as you say, not enough data has accumulated yet. That’s why Christopher Monckton is looking at cases data, even with all its known (and unknown) faults; and I agree with him.
“f looking at this over a longer period, I can see the point of weekly smoothing because of what I call the “wobble.” But on something like this where individual days matter, you’ll miss potentially important repeated patterns. Like a peak, then down, then up in a big way. Examples: Spain from March 21 to 26. UK from March 21 to 27, and again from March 27 to April 1. Switzerland from March 16 to 21. Belgium from March 22 to 28. Netherlands for exactly the same time period. Portugal from March 23 to 28. Sweden from March 20 to 28, and again from March 28 to April 2. That last is why I am starting to fear (a little) for my Swedish friends. My approach is (paraphrased) to look at the data, the whole data, and nothing but the data.”
just some things.
1. Daily case data and daily Death data is typically lagged from the actual date on which it occurred. call this reporting delay. So Fred died on April 1, it might not get reported until
April 4, 5 or 6. so some smoothing is in order. how much? no clue.
2. trying to interpret daily wobbles is fraught with danger, same thing for climate data.
testing delays, hospital delays, slow reporting. how real is that wobble?
3. Finally looking at national data is going to potentially mislead lead you. There is a reason why planners look at county level and city level data.
Bottom line: reducing contact between people will slow the transmission of a communicable disease. kinda by definition. BUT, there is No engineering this curve. There is no calibrated knob of how much distancing leads to how much rate decrease. I know folks want to engineer this curve.. their tendency is to negotiate, try to optimize, change system views, etc ect
but it can’t be engineered.
whats that leave you with? bang bang control, crude but effective. and I’m not so sure we will go “bang” and remove all restrictions. Anyway weld it shut works.
leaks can be a bitch. R0 is a crazy variable..
What is the equivalent of R0 for the economy? We know what bang, bang, “weld it shut” does there and it will destroy our current concept of modern society. You pretty soon end up with CentCom operatating out of somewhere like Iron Mountain and Mad Max on the outside.
Even if you can’t “engineer” the curve as you would like, you are going to have to engineer to curve.
Making stupid comments like “bang bang control, crude but effective” is really not an option.
“All in all, I think the prognosis is quite good for Christopher Monckton’s hypothesis that the lockdowns are working; but maybe not so good for our Swedish friends.”
There is no denying that placing a population under house arrest will reduce the spread of an infectious disease. The question is whether the disease is dangerous enough to warrant such a catastrophically extreme measure.
It’s also the case that this being a coronavirus, it will be likely to decline naturally at this time of year (viral pandemics are rare in Europe in the summer months). Monckton of Brenchley suggested above that “we still have some weeks of near-exponential increase in deaths to come before the lockdowns begin to bite.” And yet the rate of increase in deaths is already declining. It’s too soon for the lockdowns, so are we looking at a natural petering out?
There is no denying the EXPECTATION that … does not make it a fact. It was not actually house arrest: still a lot of “essential” movement and those not strictly obeying the govt diktat. What is the efficacy of such efforts? Still a valid question.
Seasonal dependency is questionable, this NOT influenza and biological studies on sensitivity to rel. humidity and temperature have shown the two are NOT the same. Be careful not to make careless assumptions.
Undoubtedly there has been a gradual bending over of the log plots in all EU countries. Unless some point of inflection can be found rather than a continual fade it is hard to justify any attribution to confinement measures. ( This is of course what CofB is doing because he has an authoritarian agenda to push and is not objectively examining the data ).
PJF: Deaths from this thing tend to peak two or three weeks after cases. So, in those countries which haven’t yet reached the declining stage (Sweden; arguably Spain, Germany, UK and Portugal; and perhaps Belgium and Netherlands) you would expect deaths to continue to rise for a while. I haven’t looked into death stats yet, though I may do a “post-mortem” later!
As to whether the disease is dangerous enough to warrant the extreme measures taken, that’s a matter of “social cost” – something I’ve discussed in several of my half dozen or so headpost articles on this site. I suspect that won’t be calculable until “is dangerous” had become “was dangerous.” More important now, for me, is the data which determines when it’s right to lift the restrictions.
Two weeks is generally about right. However there is a lag of just 5d in italian data. This probably reflects their inability to keep anyone alive long enough rather than a property of the viral infection.
France lags 13 days.
Due to the bumpy noisy nature of the data the deaths are nearly flat ( on log plot ) before you have clearly identifiable down turn in cases. France has just screwed up any hope of detecting peak COVID by dumping a new source of bodies into the dataset just when it was about to peak.
the other countries you mentioned, with the obvious exception of Sweden, have peaked in new cases.
EU needs to move NOW on unwinding this mess.
There is another example that will be interesting to look at on the other side of this: Belarus.
There will be little to no useful data on infections and deaths. Belarus is a bizarre and nastyish dictatorship, and any data will come from some combination of book-cooking and total denial. But we will get a picture of whether the disease leaves the country ravaged or functional (in its already dysfunctional way). I would expect to see the latter. They’ll lose plenty of their old and infirm (maybe relatively fewer because there won’t be as many feeble cases in the first place) but the rest of the country will be largely unscathed and continuing on as normal.
If its western neighbours and near neighbours destroy their economies over this, they may end up in worse shape.
Sadly that’s not the case , testing in France has been rising exponentially, which is medically good but messes with any analysis of the progress of infections.
I’ll bear with you but be aware of impact of such assumptions.
Figures I read were 2-12 days ( single case of 14d ! ) with a median of 5d.
I’m very wary of this kind of verbal resume of a visual impression. I’d like to see a graph , since you can produce them, preferably with fitted exp and linear, rather than a subjective personal interpretation.
Just for the sake of comparison , here is the Italian data ( deaths and cases ) , could you indicate where exponential and linear bits start and finish?
NB that is a log plot to the exp is a linear rise, linear is leveling off logarithm.

Like most people , I would assume that confinement should produce a clear effect. Probably still exponential but with a longer time const than before measures came in + about 5d lag. Trouble is I’m having trouble finding anything but a gentle roll-over to slower growth, with is thus not attributable to the measures introduced.
Agreed, see my posts and graph with regression fits above. 7.9 d doubling time is noteworthy however, most other countries have cut off their right arm to get that low. Sweden has been consistently low.
I’m waiting for proof that shutdowns are the cause of other countries flattening the curve being attributable in some kind of scientific way ( rather than just expectations an adjusting to delays and breakpoints as required ).
Maybe I’m missing some subtle feature which your are able to spot but eyeballing “exp” lin + wobbles seem fraught with dangers of seeing what you expect or want to see.
Greg: I was using the graphs published on https://www.worldometers.info/coronavirus/country/spain/ and similarly for the other countries. I am one of those for whom a thousand words are better than 24 pictures.
I don’t see any point in talking about “doubling time” once the curve has gone away from the exponential. (On that, I disagree with Christopher Monckton, although my researches suggest he may well be right in his fundamental points). But the Gompertz curve does become very nearly linear for quite a way in its middle reaches. It is indeed possible, as you suggest, that the flattening or even decrease of new cases we are seeing in many countries is not due to lockdowns, but simply because of the herd immunity curve. That is why I am muted in my support for Christopher’s hypothesis. Time will tell. The first country to lift restrictions (Austria?) will tell even more.
thanks for the clarification Neil. I did not realise that you were looking at cumulative totals . They are very uninformative since they are basically integrals which drown out any short term change: the bits we are actually trying to spot.
In all my comments involving doubling time I’m referring to daily changes in either cases or fatalities. since both the build-up and fade off are essentially exponential in nature it is a useful way to follow the data. Doing log plots is a convenient way to look at such data.
In a log plot the doubling time is the essentially a measure of the slope at any point, it’s linear regression to this behaviour which you would not want to do at fitting an exponential on a linear graph because the errors would be swamped by the larger data values and ignore the smaller ones.
So doubling time is just like talking about the slope of a section of the graph.
Also if you have the typically exp rise and you apply confinement in an attempt to reduce the R0 of the viral infection you are still going to get an exponential you are just playing with the time constant.
If the measures work what you would expect to find is the initial ( allegedly pure exponential ) rise is a straight line and its slope will be reduced in a fairly clear inflections a few days after you shutdown the population.
If you see a general curving over that is not consistent with the expected result you are trying to detect.
That’s my 1000 works, not go back on click of the 24 graph’s I’ve posted to see what I mean 🙂
Greg: As you will see if you re-read my original comment, I looked at both the cumulative totals and the daily new cases. The former, we should expect to match the Gompertz curve. The latter represents the slope of that curve at the time. They are merely different ways of looking at the same data.
Christopher Monckton became annoyed with you earlier in the thread, and I understand why. He and I are very different (though we studied at Cambridge at much the same time), but now I’m going to follow him in not responding to you any more.
Neil, the Gompertz curve is a simple idealise model and does not take account of things like lockdown halfway though. It is also a very featureless S curve. This is fine for epidemiology 101 to explain how things work but is not very helpful as a diagnostic at this stage.
Your description of exp+lin+wobble was clearly referring to totals, that is why I did not understand at first. That is the last place you will see any sign of a break point.
If get annoyed by someone making calm analytical comments and discussing the data you should ask yourself why that is. I’m quite open to being challenged on any comment or interpretation and discussing it.
If you prefer to “follow” an macheavelian, authoritarian member of the British aristocracy you are obviously welcome to do so. Enjoy your house arrest and the imploding economy which is coming. I hope you are as wealthy as “his Lordship” , those with the wealth, means and large real estate portfolios are the ones which will come out on top of the impending collapse.
They will require the rest of us on house arrest to control the ensuing mayhem. I can fully understand why he is doing his best to promote it.
“But the Gompertz curve does become very nearly linear for quite a way in its middle reaches. It is indeed possible, as you suggest, that the flattening or even decrease of new cases we are seeing in many countries is not due to lockdowns, but simply because of the herd immunity curve.”
last time Willis posted a Gompertz for Korea I should have taken more time to explain why these non mechanistic curve fits are bound to get you in trouble, as they have for his Korean Projections.
The flattening is due to isolation, when you lift the isolation it starts up again.
see Korea, See hong kong, See Singapore, See Beijing, See Shanghai,
To detect any change as early as possible and to attempt attribution, rather than ASSUMING it, you need something sensitive to change. The Gompertz curve is not it.
You are looking for variations in the rate of change so you need to plot rate of change ( new cases per day ) and NOT the cumulative integral which acts as a low-pass filter, actually masking what you seek to know.
It’s not a question of “Do lockdowns work?” The question is, at what level of restriction do the benefits outweigh the costs?
$2 Trillion can buy a lot of temporary hospitals
Unless you wish to arbitrarily assume the answer to the first one it is kinda necessary but not sufficient to answering the second. If the answer to the first is : it’s not detectable, you can save a lot of effort trying to answer the second.
I will point you all at some resources to understand how Hong Kong does this.
This isn’t rocket science.
why Hong kong?
well hong Kong suffered though SARS, like Korea suffered through MERS. we should learn lessons
from them.
First Some history, stuff you should read.
https://www.straitstimes.com/asia/east-asia/exclusive-qa-with-hong-kong-microbiologist-yuen-kwok-yung-who-helped-confirm
My first choice to flee to was Korea, and after that HK. but HK is now closed.
why HK?
https://www.coronavirus.gov.hk/eng/index.html
https://chp-dashboard.geodata.gov.hk/covid-19/en.html
What buildings are infected
https://www.chp.gov.hk/files/pdf/building_list_eng.pdf
What plane seats did infected people sit in?
https://www.chp.gov.hk/files/pdf/flights_trains_en.pdf
Where are infected people quarantined
https://www.chp.gov.hk/files/pdf/599c_en.pdf
Every case listed
https://www.chp.gov.hk/files/pdf/local_situation_covid19_en.pdf
Monckton missed my point earlier.
“Steve Oregon appears to imagine that responsible governments have not considered the economic cost of lockdowns. Of course they have: that is why so many of them took so long to realize that there was no other option.”
My point was that reckless insufficient consideration has been given.
It’s exceeding obvious, to me, that there has not been the kind of careful analysis needed to avoid the catastrophic blunder I am very close to being convinced has occurred.
Instead there have simply been some vague presumptions of un-described level economic difficulty without any interest in the likely scale or proportionality.
To me that is stunningly irresponsible.
So now as the calamity of the shut down (governmental economic suicide) weaves it’s way though the populous and the entire public/private system we’re supposed to trust in a simple thought that the world will “eventually restart”?
Look I respect Monckton. But he thoroughly ignored my queries about what 30% + unemployment looks like etc. What a collapsed system looks like in real effect. Instead he restated the weight on the other side of the scale getting all of the attention.
“The cost in the interim is undeniably heavy. But the cost of failing to act, according to the analyses done for the British Government, would have been many times greater.”
Sorry I don’t buy that. There is no basis for the “many times greater” claim because I don’t believe that an assessment of what is to come from the shut downs was ever truly completed by anyone.
And I never suggested the opposite extreme of no action was the alternative.
But far form the total shut down are many alternatives. Isolate the senior facilities, halt transit use, reduce close groups contacts etc.
While of course accelerating the healthcare demands which would be overwhelmed in disastrous ways.
I can make the same assertion that the cost of lives would be undeniably heavy. But necessary because that a shut down would be many times greater.
It is horribly flawed logic to assert that the potential for the loss of 1 million lives means we must shut down all things.
75 million people died during WWII. 3% of the 2.5 billion global population. They were sacrificed (Many of our young adults) to save modern civilization as we knew it.
There was no surrender and nothing shut down. Unless it was bombed into a shut down.
That 3% of today’s 7.8 Billion would mean 234 million deaths today.
Today we are being told saving 1-2 millions lives requires a surrender of our entire, complex system?
According to what?
We are watching a massive ruination of business, commerce, education and people’s lives. While at the same time every municipal, country and state budget is being vanquished. Who is supposed to fund basic services while we wait for whatever it is no one imagined.
Monckton says this will all “eventually restart”?
What does the restart look like? No one knows because no one has truly envisioned the shut down itself.
Had officials done so it is more than likely they wold have concluded a massive loss of life was necessary.
That the current surrender was not an option. That it would be many times worse.
Of course this is not “the same as a war, which destroys much of the capital stock.”
The shut down is more like a 911 shut down happening every day week after week. Deliberately with months more ahead? Nuts.
The carnage cannot be cast as merely “economic damage”.
It is closer to the “complete societal collapse” than a swamping of our healthcare systems could ever be.
We can handle the storm of healthcare demand. It will be tragic.
Yes a million or two million or more deaths is acceptable. Using refrigerator trucks for corpses will be needed too.
Many strict measures are needed to both contain the virus and keep civilization running.
Steve
You remarked, “But he thoroughly ignored my queries about what 30% + unemployment looks like etc.” It is my understanding from my readings that during the Great Depression, the US unemployment rate was about 25%. Now the fundamentals are different for the causes of these two events, but we shouldn’t treat this like hitting the button and expect to come back and pick up where we stopped the recording.
The lockdowns might be working in the sense they’re slowing the spread, but that rather begs the question whether slowing the spread is desirable.
What’s the endgame? I’m hearing talk of continuing this through the Fall, because of the inevitable ‘second wave’.
For the survivors, a fast deep cut would be preferable to a long, protracted, debt-ridden, debt-imploding, depressing slow burn misery.
Those talking of a second wave in the autumn are simply uninformed and assuming everything like seasonal flu and will thus end when it warms and come back with the flu in winter.
They should do a little more reading about the type of virus this is before suggesting policy based on a thought bubble.
Whatever, if this shut down goes on for more than a month the effects will make a few weeks stuck at home watching Netflix seem like Utopia.
We need to be planning the way out NOW. Europe needs to be activating that NOW. Looks like Italy at least understands that they are now talking about “phase 2”.
Strangely, the word “Pause” got stripped out by WordPress, apparently because it was bracketed by ‘carrots’ (<).
Yes, unrecognised HTML tags disappear 😉
Greg
I don’t know if you are still angling round his old thread but if so thought you might be interested in this
http://inproportion2.talkigy.com/
It’s been a light year for deaths in the UK and Europe in 2020 due to mild weather, limited flu infections etc. Not that you would know that from the hysteria. If our economy is blown to pieces there won’t be money to spend on health in future and deaths and illnesses will surely rocket
Wow, that is f’in crazy. Thanks for the link.
Consider what a doubly false dichotomy this is.
“Over-reacting is better than non-reacting”
There has been no definition of how harmful “over-reaction” can be and there is no such choice as “non-reacting”.
https://www.weforum.org/agenda/2020/03/coronavirus-covid19-global-academics-insights-pandemic/
So lets give Mockton An exagerrated Death rate OF 100,000 of coronavirus worlwide to date (Its only 80000 as of today and falling) SO 170,000 Normally die every day, again we divide deaths from this normal flu now 5 months so 100000 divided by 150 days = ?
Dear Lord Monckton of Brenchley, well for the first time I disagree with you. Even on your way to solve your Diabete I was agreeing with you but here I cannot agree. First it is nearly impossible to make sense of the stats and numbers given by countries. Netherlands has so few people out of coronavirus without being dead. Same for Sweden, Norway and the UK. Germany has the same numbers in UCI for several days, as South Korea (which is very good in detailed information given), France some times, UK (except for today, the 5th, Denmark, Switzerland and Netherlands (I am following for 1 month now some 14 countries).
You mentioned a death rate of 27%. I agree with your approach, counting death people to death and cured people, however, how could you compare Italian rate of 42% currently, Spanish of 25%, French of 33% with Korean of 3% and Iceland of 1%… didn’t know that a virus choose its nationality ? Clearly the way we count the death and or time is not the same. The curious thing is that on the 3rd of March Korea rate was at 50% and still above 10% until the 13th of March. Cleary we cannot make any sense of the data.
Then as a friend mentioned, amongst the top cause of death we find 1) Heart disease, 2) stroke, 3) pulmonary disease, 7) diabetes. Suicide is also important as well as alcohol. But by confining people all these factors are increasing because people have more stressed, do less sport, smoke and drink more and are more prone to suicide even without mentioning the financial impact. And so far no any particular death rate on the EuMOMO indicator, nothing as bad as flu for some years ago….
As John P.A. Ioannidis, an epidemiologist and professor of medicine at Stanford University wrote recently “The data collected so far on how many people are infected and how the epidemic is evolving are utterly unreliable,”
I believe that masks and tests are the solution. Korea and Iceland have done so many tests that their positive ratio is less than 10%, ( Iceland 6% of the total and 4% daily, Korea 2.3% in total and around 1% daily). I am in Belgium and they are still talking about that very soon we should do 10.000 tests/ day and they wonder if masks are a solution! What we have learned from Diamond Princess and Iceland is that roughly 50% of people who are positive have no symptoms but so they can spread the virus without knowing that they are positive… this is the way that Taiwan, Honk Kong, Singapour, China and Korea control the disease. Korea doing test to bring the epidemy in control.
Finally it is interesting to see that UK and USA have move to confinment following Professor Ferguson of Imperial College model, model which had not been reviewed and which Ferguson has now recognised that the high level given of these deaths would not be in addition to, but rather part of the normal annual mortality rate … will the USA and the UK would have taken the same decision knowing this ? I am not sure. Then as you perfectly know, once governments have taken more power or tax following a particular situation it is very hard to take out those power or tax!
I will of course be happy to read you again on global warming !
{I start this at bottom instead part of an above thread}
—Monckton of Brenchley April 5, 2020 at 3:57 am
…snip…
“What can be said is that at present the daily deaths from the virus are twice that for flu, and the death rates are likely to increase for at least another two or three weeks even in those countries with reasonably effective lockdowns.—
At present it can’t said that AVERAGE daily deaths per year is more than the flu {and “flu” is 4 different flu {viruses] which commonly happen yearly.
But because the Chinese flu {some want to call it the CCP virus, but the virus given name is SARS-CoV-2 and SARS-CoV-1 is one of the four} is new virus and has unusual {and probably still unknown} characteristics, it spreads quickly {and probably spreads faster in cool air}. And such aspects will cause a spike in number of people at “one time” to get the illness. Whereas “common Flu” which will have population which has some degree of immunity, and just having 1/4 population with immunity will slow the spread. And more serious {causes more death] flu of the four flu viruses does not transmit quickly. And one get the flu any time of year, but much more likely to get it during the flu season with winter in the middle of this season. So different places have different number and times. But with US, on average during flu season one get about 6000 deaths per month over about 6 month and yearly have about 50,000 deaths per year.
So if you had 6000 deaths in month, divide 30 and got 200 per day for population of 330 million. And for some context, you have about 10,000 births per day. Or 200 per day is small portion of deaths per day. But it’s not even, you get daily and monthly and regional spikes. And it can overload hospitals- in sense that health workers have to do overtime or it’s question of how much overtime and if it’s too much, healthcares providers will force there to be more permanent or temporary workers to be hired {and also it can encourage them to quit if it’s an untenable situation for them].
The total deaths per year or per 6 months, is quite different than having a big spike that lasts for week or months. Such spikes particularly if not small region but nationally {or globally} will kill medical workers and remove hospital services
for every other medical need- just it has already done in Italy and Spain.
But with the CCP virus {largely because Chinese government unwillingness to deal with reality, and perhaps other significant reasons} there is a lot unknown about it.
And we getting the estimate that even we everything we can, the US will peak with 100,000 or much more US deaths.
I don’t think this is correct, but if I was in a leadership position, there would various reasons, and basically I might say the same thing. But quitting is another option. Or last thing needed is endless argument in what has been and could be a even worst crisis. Or I might be more comfortable giving 40,000 to 50,000 in terms of say, next 4 months. And would say that because what you really don’t need is an overly optimistic guess as public statement from a government. And as world superpower, will have to get serious about this, because there is lot incompetent governments in world- AND is there any reason to assume we can’t get some other pandemic or the virus mutating or something else happening {volcanic eruption or whatever}.
So, focus is get it done as quickly as possible- and don’t kill medical workers.
And only option {at moment} is to flatten the curve. Wash your hands. Wear a mask.
Spain has population of 46.66 million
Italy has pop: 60.48 million
France has pop: 66.99 million
Germany has pop: 82.79 million
Total pop of four of these European States is: 256.92 million people
US has pop: 331 million
US has 311,637 total cases. Total of 8,454 deaths.
Active cases: 288,355 and serious critical cases 8,206
Totaling the 4 EU states:
Total cases: 436,845
Total Death: 36,313
Total Active cases: 303,479
Total serious critical cases: 21,300
Numbers From:
https://www.worldometers.info/coronavirus/#countries
Yesterday deaths of US: + 1,331
Yesterday deaths of 4 EU states: 2,652
And one could ask question when will US reach the current stats of these four EU state at
the above values? Or either of them: Total cases, Total Death, Total Active cases, or Total serious critical cases?
It very unlike US will exceed any of 4 catogories, tommorrow. Or terms of active cases, US yesterday, added, 34,196
And 436,845 – 311,637 = 125,208. Or if all US serious critical cases of 8,206 died tommorrw is not more than the 4 EU
state’s total death of 36,313 deaths.
It seems adding up to 125,208 active cases over next few days seems like the easiest yesterday 4 EU state stat to get to, and it might
take 2 to 4 days to do this.
If look at all the states of US, where would most of these active cases be found?
https://www.worldometers.info/coronavirus/country/us/
Yesterday New York at a large portion of of added 34,196 active cases:
New York: +11,299 and followed by New Jersey: +4,229 which fairly close to 1/2 US total active cases added.
It seems if going get 125,208 added in only 2 or 3 days, it’s most likely a much large amount of active case would be added by
the other 48 states. Or New York and new Jersey get 20 K and other 48 state get 40 K.
But then of course in two days the 4 EU state would some more active cases. Yesterday EU added 24,495 new case or quite a bit
less then what US added yesterday. And EU states could have even less per day in comming week.
(( I don’t post this about 12 hours and getting new data {though not complete, yet, or will be in few hours, but:
The 4 EU states:
Total cases: 453,553
Total death: 38,390
Total active cases: 310,588
Total serious cases: 21,612
Today EU total death: 1,877
{a significant decease of death in a day as is currently reported}
Today US death: +1,151
[a small decrease in US and could add significant amount before “day” ends {couple hours- particularly from West Coast or
from hotspots which are backlogged}
US total cases: 309,238
Total serious cases: 8,702
{which is up a bit, might indicate more likely to be backlogged}
And new cases US: +24,728 today and yesterday +34,196. If number are somwhere close, then
it seems US and Europe are bending curve, Europe ahead of US in this regard, but will need
a few more days to have more certainity about this Or there has been fluctuations and will have
fluctuations in terms of days or even weeks}. Or South Korea seems to have fluctuations in terms
of weeks after they bent there curve. hmm, actuall not really:
https://www.worldometers.info/coronavirus/country/south-korea/
But seemed could bee have trends that might be starting, but were one day jumps.
In terms of conclusion/summary:
It always worst than I hope or expect, but it seems a lot better than
what some might fear. And one fear I have is what happening in South America?
And if look at it… nothing yet, changing it, but it could been worse.
I could wait hour to get better numbers on US. But in terms of US getting back
to work, at moment it seems it depends on New York city- we need a good random sample of NYC immunity in general population.
So Germany has 29 deaths per million
And Ecuador has 10 deaths per million {or reported as case}
Germany is well controlled
Ecuador is not well controlled
Brazil {population 209 million} has 2 deaths per million.
China also has 2 deaths per million {as reported}
India has .08 deaths per million {about same pop as China}
Chile has 2 deaths per million.
S. Korea has 4 deaths per million.
Japan has 0.7 deaths per million
The idea of measuring the decline in doubling time is good, but there is a significant confounding factor if you use confirmed cases. The rapid expansion of the (initially pathetically low) rate of testing in the US will make the growth rate higher than the actual case rate. We are just detecting more of them. We are still not detecting them all, because some are symptomatic, and as hospitals get overloaded people with mild symptoms are being told to stay at home and not go to the hospital (where if they didn’t have it going in, they surely would acquire it there).
The better measure is deaths. They are (usually) well recorded, and I disagree with the argument that these are all just people who would die soon anyway. The immediate cause of death with COVID-19 is pretty obvious. Inability to breathe is not a long-term issue like high blood pressure or diabetes.
And once the hospital are flooded, you start undercounting deaths. People die at home and are never counted as dying from the virus. A recent WSJ article documents this for some towns in northern Italy which experienced a big increase in deaths over the historical average. WSJ estimated that the real Italian death toll might be near double the official numbers.
So all in all, I am firmly in Monckton’s camp, on this as well as climate. 🙂
Sorry, should be “only some are symptomatic.”
Sorry, but if someone with a severely depressed immune system due to cancer dies from inability to breath properly, having contracted a coronavirus, is the “immediate” cause of death respiratory failure, coronavirus, or the existing cancer that caused this patient to be particularly vulnerable to begin with? Saying that “immediate cause of death with COVID-19 is pretty obvious” is merely weasel wording it! “Immediate cause”, who decides? What I’d like to be enformed of for this end of things is to see some analysis of the major causes of these mortalities, even if those causes are multiple in many cases. What percentage of reported COVID deaths, say, are truly ‘from’ the virus versus deaths that would likely have come about in under 6 months in any case?
The thing is, I don’t want to prejudge what percentage of deaths are expressly “from” COVID, and I wouldn’t want to just lower that number in some arbitrary way. It’s just that I see the media reporting death numbers with no insight as to the difficulties on this particular end of things. For instance, if half of the deaths are connected with asthma as well as COVID, I’d sure say that those *are* COVID caused deaths, and that they *should* be included in announced numbers (given asthma as a common ‘live with it’ condition that shouldn’t be fatal). However, it would still be worth noting that it is that particular group of people who need special isolation, protection, treatment, etc., the cause is not all down to the virus then, even in cases like that.
Now French hospital have entry signs “Covid patients this way non-Covid patient this way” to avoid mixing in the waiting room and getting more people contaminated.
In Australia, after two weeks of level 3 restrictions, one week ago the number of new daily cases of Covid19 reported using a 7 day rolling average peaked at 376 cases per day from zero at the start of March. The latest 7 day rolling average is 244 cases per day. And better still the last three days have reported 225, 190, 140. So good signs that isolation can eliminate this virus in just few weeks.
Aussie hit a plateau about 12 days ago (25th March reported cases).
97 57 2
96 139 4
95 324 7
94 248 2
93 269 1
92 150 1
91 464 3
90 284 2
89 431 1
88 212 0
87 367 2
86 376 3
85 600 1 # 25th March.
84 114 0
83 611 0 # 23rd March
82 224 0
It seems restrictions came into force on 23rd and 26th March.
Doesn’t really leave time for any incubation period, maybe people were self-restricting before that.
Good news is it looks like a strong downturn in the last few days.
Other models are available:
‘A large number of pneumonia cases alarms authorities in northern Italy’
Aerzteblatt.de, September 10, 2018
‘Adriano Decarli, an epidemiologist and medical statistics professor at the University of Milan, said there had been a “significant” increase in the number of people hospitalized for pneumonia and flu in the areas of Milan and Lodi between October and December last year (2019).’
Reuters Mar 26 2020
‘Coronavirus cases “are probably at least a hundred times higher than the official bulletin numbers.” So say the researchers of the State University of Milan: the group of scholars headed by the epidemiologist Carlo La Vecchia. The researchers constructed a model to hypothesize the number of submerged cases of Covid-19 throughout the national territory. At least 5 million people could be infected in Italy. One million just in Lombardy……..’
La Repubblicca (centre left newspaper…) 03 April 2020
For those using Worldometer for their models:
‘Worldometer reported the following based on Italian language sources:
“(In Italy) the real number of COVID-19 cases in the country could be 5,000,0000 (compared to the 119,827 confirmed ones) according to a study which polled people with symptoms who have not been tested, and up to 10,000,000 or even 20,0000,000 after taking into account asymptomatic cases, according to Carlo La Vecchia, a Professor of Medical Statistics and Epidemiology at the Statale di Milano University.’
The Commentator 04 April 2020 (centre right publication)
Hmmmm…….in 2018, the Chinese Qixi Festival, often regarded as the Chinese equivalent of ‘Valentine’s Day’, occurred on 17 August. So a 14 day incubation period would take symptoms into September 2018….
watch
Patient 31.
God work in wondrous ways …
Apparently France has just announce that the administrative region of Brittany will be the first to have confinement restrictions eased. I don’t have more details now. But at least it shows they are moving to undo this mess actively now.
Despite the inflationary effect an exponential increase in testing new cases have been declining for 5 days according to ECDC.
Apparently you get fake news.
Much ado about nothing, a tribute to the power of controlled media to introduce fear and call it a virus. I’ve long kept my distance from Monckton, suspecting that like goofy Prince Charles, anyone descending from above from the aristocracy is either controlled or controlled opposition. With global warming I stick my head out the window, and see nothing had changed. With this “pandemic” I know no one sick, see that news reports are fabricated, And that Monckton is part of those stampeding the herd. Strange as it may appear, there is no testing mechanism for this virus, nor any guarantee that any numbers reported are honest as the PCR is highly unreliable, if the test is even being used in any real fashion. But don’t trust me or Monckton. Violate these draconian stay at home orders, go to your local health facilities, find [crickets]. The guy from Benchley is a fraud. He should be counseling Cercei Lannister, not us. Stay-at-home is designed to quarantine knowledge, not disease.
Swedish 7 day average new case rate is today down to 8.7%, corresponding to a 8.31 day doubling time. Looks like their new case rate might be breaking out to the downside. Their figures are released at 14:00 CET (08:00 EST) here: https://experience.arcgis.com/experience/09f821667ce64bf7be6f9f87457ed9aa
Meanwhile the 7 day average new case rate for Sweden’s locked down neighbour Denmark is still stuck in its slow exponential around 9%. Although the daily numbers there look like they may have turned downwards too.
Strange, those figures are a lower than what ECDC is reporting for Sweden. Seems like there’s a one day lag. Maybe time of day accounts for the rest of the difference.
97 387 28 # 6th April
96 365 40
95 612 51
94 519 43
93 512 59
92 407 34
Anyway looking good for the Swedish approach.
It is the countries which do themselves the least harm which will come out of this best.
Interesting Article Monckton,
I see a potential problem with using the rate of reported cases that you haven’t adressed. the rate of reporting cases is very much influenced by the rate of tests performed, I argue that most of the decrees in infection rate, in Italy and Spain for example is due to this.
I myself live in Spain and I am certain that during the benchmark period the tests performed is Spain were minimal and heavily biased towards infected cases, since most tests where done to patients with severe symptoms. As time has elapsed a more accurate measurement of the real infection rate is obtain. This explains the case of Sweeden. The infection rate was never really 47%, that is just the rate at which measurements where done.
This has been discussed quite a lot if you read the thread. Generally increasing testing will inflate the rise in cases.
To attempt attribution to a particular cause ( such as confinement ) you need to show a marked change in growth rate with a timing about 5 days after measures were introduced. Just taking start figure and end figure and making spurious attribution does not work, that is what we’ve all been decrying in climatology for the last 20 years.
Suddenly CofB whose has been prominent critic of such practices finds it convenient to adopt them himself.
Nearly all european countries have growth rates which have just bent over progressively probably as care homes ran out of fragile octogenarians on ACEi treatment.
No one thus far has produced any data which directly supports attribution to confinement.
Saying it is “blindingly obvious ” seems to have replaced science.
The challenge now is to unwind the mess before we do a re-run on 1929 !
Regarding my quote from the British Medical Journal above that new data from China giving very high rates of asymptomatic patients amongst the infected, further data on subsequent days has backed up the early read out.
Roughly 70% of Coronavirus patients appear to be asymptomatic.
As the eminent doctor quoted in the BMJ said:
‘That means the virus is everywhere.’
‘What the hell are we locking down for?’
Meanwhile Stanford has conducted antibody tests over the weekend, 2500 people tested in Santa Clara County.
The results will be interesting. Antibody tests have been described as a ‘game changer’ in Britain although the United Kingdom’s own antibody tests may not be available for another four weeks.
We need a “game changer” now, not in 4 weeks. You will need +2 weeks of results to do any analysis.
Bang on! I hope he gets to the right ears. Maybe he needs to go and take BoJo’s temperature and whisper in his ear.
3200
https://www.stanforddaily.com/2020/04/04/stanford-researchers-test-3200-people-for-covid-19-antibodies/
any bets on the % Positive?
I bet 100 anyone want to take the over bet?
I ‘d say put your money where your mouth is, but thats probably not too healthy
if the virus was everywhere and you tested 1000 people for antibodies what would you expect?
would you expect to find 8 people of 1000? <1%
or maybe ~30? ~3%
My guess? is 3%
https://www.cpr.org/2020/04/02/telluride-coronavirus-testing-uncovers-some-positive-results-but-also-more-uncertainty/
Macron’s cronies, AKA the French media have been telling us that the French people are not following lock down, unlike Italians.
That’s because they expect the lock down to be a complete failure, as the Italian numbers shown to us by the same media proved to be.
Hong Kong view of things
https://www.nytimes.com/2020/04/06/opinion/coronavirus-end-social-distancing.html?referringSource=articleShare
real time R0
https://covid19.sph.hku.hk/dashboard
the math
https://repub.eur.nl/pub/119396/
one benefit is using octopus card data.
If you visit HK, I suggest getting one.
https://www.scmp.com/news/hong-kong/health-environment/article/3078191/coronavirus-octopus-provide-data-city-residents