Reposted from Dr. Roy Spencer’s blog
February 6th, 2020 by Roy W. Spencer, Ph. D.
Well, as I suspected (and warned everyone) in my blog post yesterday, a portion of my calculations were in error regarding how much CO2 is taken out of the atmosphere in the global carbon cycle models used for the RCP (Representative Concentration Pathway) scenarios. A few comments there said it was hard to believe such a discrepancy existed, and I said so myself.
The error occurred by using the wrong baseline number for the “excess” CO2 (atmospheric CO2 content above 295 ppm) that I divided by in the RCP scenarios.
Here is the corrected Fig. 1 from yesterday’s post. We see that during the overlap between Mauna Loa CO2 observations (through 2019) and the RCP scenarios (starting in 2000), the RCP scenarios do approximately match the observations for the fraction of atmospheric CO2 above 295 ppm.

But now, the RCP scenarios have a reduced rate of removal in the coming decades during which that same factor-of-4 discrepancy with the Mauna Loa observation period gradually develops. More on that in a minute.
First, I should point out that the CO2 sink (removal rate) in terms of ppm/yr in three of the four RCP scenarios does indeed increase in absolute terms from (for example ) the 2000-2005 period to the 2040-2050 period: from 1.46 ppm/year during 2000-2005 to 2.68 ppm/yr (RCP4.5), 3.07 ppm/yr (RCP6.0), and 3.56 ppm/yr (RCP8.5). RCP2.6 is difficult to compare to because it involves not only a reduction of emissions, but actual negative CO2 emissions in the future from enhanced CO2 uptake programs. So, the RCP curves in Fig.1 should not be used to infer a reduced rate of CO2 uptake; it is only a reduced uptake relative to the atmospheric CO2 “overburden” relative to more pre-Industrial levels of CO2.
How Realistic are the Future RCP CO2 Removal Fractions?
I have been emphasizing that the Mauna Loa data are extremely closely matched by a simple model (blue line in Fig. 1) that assumes CO2 is removed from the atmosphere at a constant rate of 2.3%/yr of the atmospheric excess over a baseline value of 295 ppm.
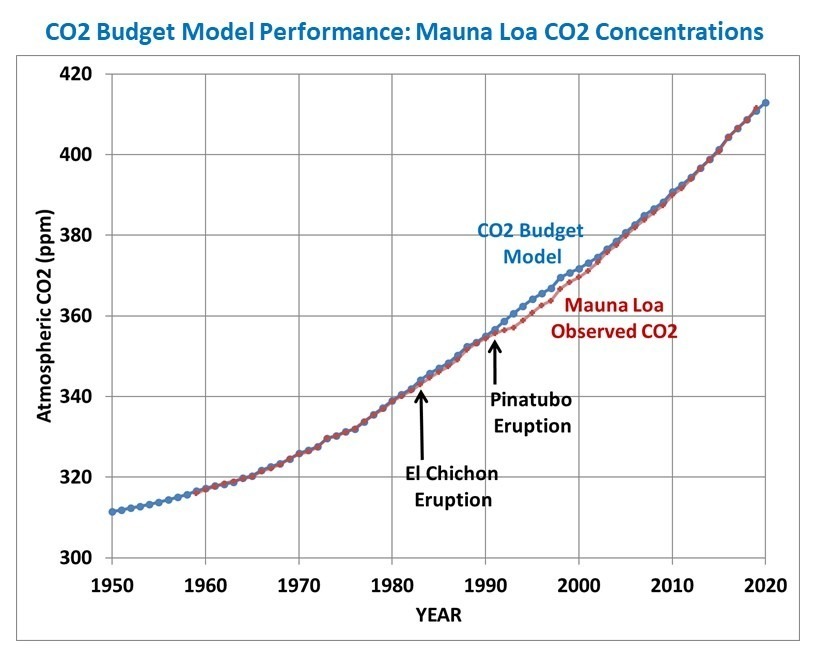
OK, now actually look at that figure I just linked to, because the fit is amazingly good. I’ll wait….
Now, if I reduce the model specified CO2 removal rate value from 2.3 to 2.0%/yr, I cannot match the Mauna Loa data. Yet the RCP scenarios insist that value will decrease markedly in the coming decades.
Who is correct? Will nature continue to remove 2.0-2.3%/yr of the CO2 excess above 295 ppm, or will that removal rate drop precipitously? If it stays fairly constant, then the future RCP scenarios are overestimating future atmospheric CO2 concentrations, and as a result climate models are predicting too much future warming.
Unfortunately, as far as I can tell, this situation can not be easily resolved. Since that removal fraction is MY metric (which seems physically reasonable to me), but is not how the carbon cycle models are built, it can be claimed that my model is too simple, and does not contain the physics necessary to address how CO2 sinks change in the future.
Which is true. All I can say is that there is no evidence from the past 60 years (1959-2019) of Mauna Loa data that the removal fraction is changing…yet.
There is no way for me to win that argument.
I can identify three reasons why the RCP scenarios show low yearly removal rates. I have carried out literature surveys before developing my own carbon cycle model 1DAOBM. The first reason is that scenario calculation must apply a carbon cycle model – typically Bern2.5CC. The basic feature of these models is that the removal rate of anthropogenic CO2 from the atmosphere into the deep ocean is buffer factor limited. It means that the sequestration rate can be in a maximum of only 2.2…2,3 GtC/yr. When the atmospheric CO2 content goes higher, more and more anthropogenic CO2 remains in the atmosphere. Also, the removal rate into the biosphere starts to decrease after a few tens of years because respiration rate – it is the CO2 flow back into the atmosphere- starts to increase.
The buffer factor approach seems not to take into account that there is almost a similar flow of natural CO2 from the ocean into the atmosphere. This error can be revealed that according to these carbon cycle models, the CO2 increase of 270 GtC in the atmosphere is totally anthropogenic. It cannot be because if it were true, the permille value of the present atmospheric CO2 would be about -13‰ but it is only -8,5‰ corresponding to 73 GtC anthropogenic CO2. You can ignore these figures but then you will never figure out, what is wrong with the carbon cycle models used by IPCC and the high CO2 concentrations of RCP scenarios.
And that’s the beauty of “future” predictions – the change is always coming, even if it never arrives.
And that’s why climate panicmongering statements for the past 20 years are important – are they showing any skill whatsoever?
If not, why should they be believed for the next 20 years? 40 years? 80 years?
Dr. Spencer;
I think you have the wrong perspective. Say rather, there is no supporting evidence for the models to claim a declining removal fraction. If they wish to depart from the current trend, they must defend that change from the status quo. The burden is not on you.
“There is no way for me to win that argument.”. I think there is a way – but it could require another 60 years. The big problem in climate science is that models keep predicting things, and predictions can never be disproved by empirical evidence while they are still predictions. By the time that empirical evidence has become available, the models have moved on to new predictions. You, and we, are on a merry-go-round.
But now, the RCP scenarios have a reduced rate of removal in the coming decades during which that same factor-of-4 discrepancy with the Mauna Loa observation period gradually develops.
Obviously, they’ve employed the same chimps for RGP as for the CMIP climate models.
I expect that the natural removal rate of CO2 from the atmosphere will be close to consistent with Dr. Spencer’s model and with a Bern model until man-made emissions take a great enough departure from exponential growth to cause the “excess” atmospheric CO2 above a “pre-industrial” baseline to depart substantially from exponential growth. As long as the “excess” is approximately growing exponentially, the natural removal rate will be consistent with both an exponential decay curve and with non-exponential decay curves (such as a Bern model) for each year’s man-made emissions.
It doesn’t all have to go into the oceans. More CO2 makes more vegetation plus there are no doubt many other processes in play https://ktwop.com/2014/10/07/carbon-dioxide-can-disassociate-to-form-oxygen-under-uv-in-upper-atmosphere/ , plus who knows what else.
Low solar also may cause it. Willis in 3, 2, 1 …..
“All I can say is that there is no evidence from the past 60 years (1959-2019) of Mauna Loa data that the removal fraction is changing…yet.”
The removal fraction is the complement of the airborne fraction. And there is a reason in terms of the dynamics why it has been quite constant, as I describe here. It is a consequence of the exponential growth of the CO2 excess. If the fraction is any kind of linear response (determined by a response function, of which the Bern model is just one possible kind), then convolving that with an exponential will give a constant fractional response (it’s like exponential smoothing). As soon as the rate of increase drops below the exponential rate, the removal fraction drops. The reason is basically that the diffusion pathway reflects the higher growth rate, and when the driving surface concentration slows, CO2 travels back up the path. That is why RCP2.6 descends earliest and fastest.
An empirical model based on observation and experiment doesn’t need to contain any physics. link
Suppose that I can model every electron in a simple electric circuit. Will the resulting model be more accurate than good ‘ole Ohm’s Law? Not bleeping likely.
What are they claiming? Their models are way off the mark now, but just you wait …
Yeah, right.
Anthropogenic nitrogen might be helping plants keep pace with removing rising CO2. I threw a few buckets of used dilute ammonia floor cleaner on my lime tree, after noticing what throwing it on the grass did to my lawn. The light green foliage is just two weeks worth of growth – a spectacular difference in growth rate. To be fair though this is the height of Summer, and plants like warm weather.
The 1963 14C Bomb Spike data make clear atmospheric CO2 entering at some T0 has a half-life of about 5 years. There is no fudge factor here. Many try to spin what that number means, but it is a hard fact. It is a fortunate accidental tracer experiment. The off rate has not changed for decades since 1963.
Reducing the total CO2 in the atmosphere is a different issue. That depends on the rate CO2 is injected into the atmosphere. The off rate constant is apparently not changing no matter what the amount of CO2 is in the atmosphere. So there is no apparent saturation of the reservoirs that take up CO2.
If you use the IPCC figures for global anthropogenic CO2 emissions, and you use the 5 yr half-life of CO2, there is no way to make ~280 ppmv in 1750 rise to meet the Mauna Loa CO2 curve. The conclusion is, the majority of CO2 emissions into the atmosphere are not from burning fossil fuel. They could be from methane released by the ocean or tundra, trapped in those reservoirs long enough for 14C to decay.
So relax, and enjoy burning whatever you like. We should enjoy an energy rich economy, and reject the power mad socialists trying to dismantle capitalism, while scaring people into chains of poverty, ignorance, dependence on government, poor health, almost constant misery, and short lives.
Greta the Troll go home, shut up, and stay in school.
The problem still remains CO2 has no influence on temperature–sorry to burst you balloon. If anything CO2 is a refrigerant as we used it last century (and continue to use it) and will never influence global warming.
Beating that dead horse is why we never made any progress with the public or the Politicos and the beat goes on.
Maybe not the MLO CO2 data, but the Barrow CO2 data indicates the high latitude sinks are increasing uptake. A repeat of the figure I posted in the previous post on this subject:
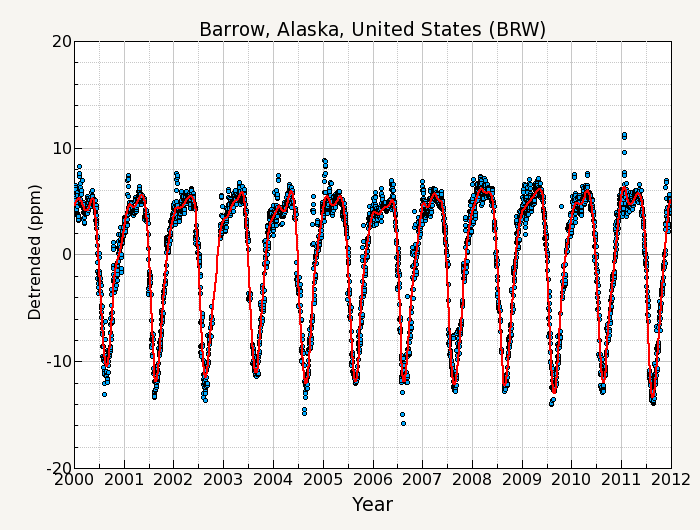
Much of this CO2 uptake is via increased primary production in the Barents Sea, Chukchi Sea, East Siberian Sea, Beaufort Sea where summer sea ice minimums have been greatest. The uptake is in the form of phytoplankton. Phytoplankton sits at the bottom of the food web, but only a small portion of this vast bounty is consumed by fish and marine mammals. Most of the increased phytoplankton blooms just sink to the ocean floor without entering the food chain. Phytoplankton increase in its biomass total then effects of CO2 drawdown of dissolved CO2 thus accelerating the Arctic Sea itself a major CO2 sink from the atomosphere, while producing oxygen with its chlorophyll-A bloom visible from polar orbiting satellites.
“Northward Expansion and Intensification of Phytoplankton Growth During the Early Ice‐Free Season in Arctic” (S. Renaut E. Devred M. Babin. 15 October 2018 https://doi.org/10.1029/2018GL078995)
https://agupubs.onlinelibrary.wiley.com/doi/full/10.1029/2018GL078995
The author’s figure 4. Here:

The green pixels (areas) depict areas with new phytoplankton blooms since 2010.
I find it strange that the removal should look anything like a constant, and I will take a wild guess that it has to be a coincidence. Nick mentions on possibility which seems reasonable from a purely math point of view…but nature is very complex and I imagine it still has some surprises in store for those of us that care who watch long enough.
Here is one scenario: Ocean plankton and algae uptake increases exponentially as CO2 rises, assuming it does not have any major nutrient barriers (a bad assumption I will address). These organisms grow and die, and much of it settles to the bottom of the ocean as now sequestered (well, mostly) carbon. We are basically building new oil reserves if its left alone long enough. So even though the ocean water is able to take up less CO2 because it is warming, it can take up more CO2 because organisms keep eating it.
The obvious problem with this scenario is that there can’t be a major bottleneck in the organism’s nutrients, and there are in many cases. Iron is one of these. Nitrogen used to be another, although pollution is taking care of that for now… But, if there is a sudden source of iron in the form of a magma release, there could be some spectacular blooms.
So while the chemistry might react in some fashion that resembles a constant, with life involved in the middle I find it difficult to believe it still resembles a constant. I actually expect uptake to increase (as a percentage), not stabilize or shrink.
Note that rain has a pH ranging from 5.0 to 5.7, due to the CO2 in it.
Mods,
My comment:
https://wattsupwiththat.com/2020/02/07/corrected-rcp-scenario-removal-fractions/#comment-2911572
lost in moderation.
Thanks for any assist.
Good catch, but the fundamental discrepancy remains. Regardless of how much CO2 accumulates or is removed from the atmosphere, the current temperature and sea level trends are squarely in the RCP2.6 range while the rate of CO2 accumulation is in the RCP8.5 range.
RCP8.5 assumes “business as usual” where CO2 continues to increase as the world does essentially nothing to curb emissions. RCP2.6 expects all countries to drastically curb emissions so that around 2020—this year!—CO2 emissions begin to decline. (Incidentally, that’s why all the screaming about “point of no return” and “we must get it done NOW!”)
BUT, even as emissions continue to increase, the measured temperature and sea level trends are in the RCP2.6 range. The CMIP computer models are as useful as sheep entrails for predicting the future.
With enough free parameters, any model can match past changes. This does not mean a model is correct or has predictive skill.
With respect, this model is defective for several reasons. Notably, it follows from circular reasoning which treats human CO2 and natural CO2 differently: The so-called “removal fraction” is defined from human carbon because the model presumes that changes of CO2 result only from CO2 emitted by humans. What about CO2 emitted by nature? Why, that part (which vastly exceeds the CO2 emitted by humans) is presumed to be fast asleep.
Empirically, this model is immediately falsified by carbon 14. Following the end of nuclear bomb testing, perturbed C14 was removed on the time scale of only a decade, not a century. Dr. Spencer’s argument (in his earlier post) as to why C14 does not apply is simply incorrect. The chemical and physical processes that act on CO2 to remove it from the atmosphere do not distinguish CO2 that is comprised of C14 from CO2 that is comprised of C12. The unrealistic removal time makes the model invalid and its output irrelevant.
The climate system uses CO2 as a negative feedback. The AMO is always warmer during a centennial solar minimum, and a warmer North Atlantic reduces CO2 uptake. The Beck chemical CO2 measurements are much higher during each warm AMO phase.
https://www.researchgate.net/publication/258807285_Atlantic_Ocean_CO2_uptake_reduced_by_weakening_of_the_Meridional_Overturning_Circulation
Wasn’t the Orbiting Carbon Observatory supposed to shed light on this? Has anything come out of the data other than colorful graphics?
They are right for those who say that it would be better to act on the advanced state of science. However, the reality is that we will be forced to act on the current state of science. We are like the man in the window of the burning apartment and if he pops out there is at least some chance of survival.
my model is too simple, and does not contain the physics necessary to address how CO2 sinks change in the future.
========
Newtons Law of Universal Gravitation is exactlyvthe same. It is too simple and does not contain the underlying physics. Newton himself said that instant action at infinite distance could not be correct.
Yet we use Newton because it is simple and fits the data. Not because it describes the underlying physics. Einstein describes the underlying physics but is so complicated that we rarely use it.
The same arguments apply here.
The best method and the industrial standard method to measure a fluid clearance rate is to use an isotope tracer. For CO2 in the atmosphere this has been done. In the 1950’s and 60’s the nuclear bomb tests released a n easily measurable pulse of 14C as CO2 into the atmosphere, transporting it to the top of the stratosphere thus enduring thorough atmospheric mixing. Scientists did straightforward and honest science in those days, instead conjuring tricks.
They measured the radiolabelled CO2 clearance rate and found it to have a half life of 16 years. Dividing this by ln 2 (0.693) this gives a mean lifetime of a CO2 of 23 years.
https://www.ncbi.nlm.nih.gov/pmc/articles/PMC2871409/
That is all there is to know about CO2 clearance. Anything beyond this, trying to eel out of this measured clearance by appealing to circulating compartments and forcing a long residence time by convoluted fabrication, is nothing but fraudulent politically motivated hogwash.
It looks like you do not understand that this tracer test is applicable only for anthropogenic CO2. The atmosphere has received natural CO2 from the oceans because its permille value is -8.5. The half-time or residence time for the total CO2 of the atmosphere is longer. Anyway, Bern2.5CC and other IPCC accepted models are wrong.
Willis’ assumptions (Willis’ assumption are the same as the IPCC Bern model) concerning atmospheric CO2 problem are physically incorrect as he and the authors of the Bern equation (whos who of the cult of CAGW) ignore observations that he/they cannot explain.
Here are a couple of observational anomalies that we are ignoring which disprove Willis’ conceptual idea of what is happening physically.
The atmospheric C13/C12 ratio is changing in a step wise manner where there is no change in the ratio for multiple years and then there is a drop in the ratio.
If you calculate the instantaneous change in the C13/C12 ratio (δ13 C, see Tom Quirk’s analysis in the attached link) and then plot that value against time it is found….
… that there is evidence of a massive natural low source of C13/C12 that is entering the biosphere at the times of El Ninos from the ocean.
http://ruby.fgcu.edu/courses/twimberley/EnviroPhilo/SourcesAndSinks.pdf
https://journals.sagepub.com/doi/10.1260/095830509787689123
“The correlation of changes in δ13 C with ENSO events and the comparison with a simple model of a series of cascades suggest that the changes in δ13 C in the atmosphere have little to do with the input of CO 2 emissions from the continuous use of fossil fuels.”
The change in the ratio of C13/C12 does not support the Bern Equation’s physical assumption that volcanic eruptions and anthropogenic CO2 emissions are the only new sources of CO2 into the biosphere.
Here is another paradox. The Bern equation assumes zero biological material is being sequestered in the ocean.
This recent observation that C14 is making to the deepest ocean with no delay is an observational fact that disproves the Bern model of CO2 sinks and sources and resident times.
This is important as if there is a large sink of CO2 in the biosphere that the Bern equation did not take into account there must be a large source of CO2, coming into the biosphere besides volcanic eruptions which the Bern equation did not take into account.
A large missing sink of CO2 and a large missing source of CO2, is exactly what Salby is saying must be physically true. to explain the fact that atmospheric CO2 is tracking planetary temperature change, not anthropogenic CO2 emissions.
The Bern model assumes that ocean circulation (with hundreds of years delay) is the only method for deep sequestration of CO2 in the ocean.
This assumption of zero particulate organic sequequetration in the ocean, is not in agreement with earlier studies and has been disproved with the C14 finding.
“The alleged long lifetime of 500 years for carbon diffusing to the deep ocean is of no relevance to the debate on the fate of anthropogenic CO2 and the “Greenhouse Effect”, because POC (particular organic carbon; carbon pool of about 1000 giga-tonnes; some 130% of the atmospheric carbon pool) can sink to the bottom of the ocean in less than a year (Toggweiler, 1990).”
https://www.livescience.com/65466-bomb-carbon-deepest-ocean-trenches.html
Bomb C14 Found in Ocean Deepest Trenches
If you use the Bern equation δ13 C to calculate the expected ratio in the atmosphere using the Bern equation assumptions and known anthropogenic emissions, calculated ratio is much higher than the calculate ratio, that and the fact that δ13 C is changing in a manner that has no correlation with anthropogenic CO2 emissions shows that there is a massive time varying source of low C13/C12 that is entering the biosphere via the oceans.
This a detailed explanation of this issue.
https://www.co2web.info/ESEF3VO2.pdf