Reposted from Dr. Roy Spencer’s website
October 25th, 2019 by Roy W. Spencer, Ph. D.
NOTE: I have written on this subject before, but it is important enough that we need to keep thinking about it. It is also related to the forcing-feedback paradigm of climate change, which I usually defend — but which I will here take a skeptical view toward in the context of long-term climate change.

The UN IPCC scientists who write the reports which guide international energy policy on fossil fuel use operate under the assumption that the climate system has a preferred, natural and constant average state which is only deviated from through the meddling of humans. They construct their climate models so that the models do not produce any warming or cooling unless they are forced to through increasing anthropogenic greenhouse gases, aerosols, or volcanic eruptions.
This imposed behavior of their “control runs” is admittedly necessary because various physical processes in the models are not known well enough from observations and first principles, and so the models must be tinkered with until they produce what might be considered to be the “null hypothesis” behavior, which in their worldview means no long-term warming or cooling.
What I’d like to discuss here is NOT whether there are other ‘external’ forcing agents of climate change, such as the sun. That is a valuable discussion, but not what I’m going to address. I’d like to address the question of whether there really is an average state that the climate system is constantly re-adjusting itself toward, even if it is constantly nudged in different directions by the sun.
If there is such a preferred average state, then the forcing-feedback paradigm of climate change is valid. In that system of thought, any departure of the global average temperature from the Nature-preferred state is resisted by radiative “feedback”, that is, changes in the radiative energy balance of the Earth in response to the too-warm or too-cool conditions. Those radiative changes would constantly be pushing the system back to its preferred temperature state.
But what if there isn’t only one preferred state?
I am of the opinion that the F-F paradigm does indeed apply for at least year-to-year fluctuations, because phase space diagrams of the co-variations between temperature and radiative flux look just like what we would expect from a F-F perspective. I touched on this in yesterday’s post.
Where the F-F paradigm might be inapplicable is in the context of long-term climate changes which are the result of internal fluctuations.
Chaos in the Climate System
Everyone agrees that the ocean-atmosphere fluid flows represent a non-linear dynamical system. Such systems, although deterministic (that is, can be described with known physical equations) are difficult to predict the future behavior of because of their sensitive dependence on the current state. This is called “sensitive dependence on initial conditions”, and it is why weather cannot be forecast more than a week or so in advance.
The reason why most climate researchers do not think this is important for climate forecasting is that they are dealing with how the future climate might differ from today’s climate in a time-averaged sense... due not to changes in initial conditions, but in the “boundary conditions”, that is, increasing CO2 in the atmosphere. Humans are slightly changing the rules by which the climate system operates — that is, the estimated ~1-2% change in the rate of cooling of the climate system to outer space as a result of increasing CO2.
There are still chaotic variations in the climate system, which is why any given climate model forced with the same amount of increasing CO2 but initialized with different initial conditions in 1760 will produce a different globally-averaged temperature in, say, 2050 or 2060.
But what if the climate system undergoes its own, substantial chaotic changes on long time scales, say 100 to 1,000 years? The IPCC assumes this does not happen. But the ocean has inherently long time scales — decades to millennia. An unusually large amount of cold bottom water formed at the surface in the Arctic in one century might take hundreds or even thousands of years before it re-emerges at the surface, say in the tropics. This time lag can introduce a wide range of complex behaviors in the climate system, and is capable of producing climate change all by itself.
Even the sun, which we view as a constantly burning ball of gas, produces an 11-year cycle in sunspot activity, and even that cycle changes in strength over hundreds of years. It would seem that every process in nature organizes itself on preferred time scales, with some amount of cyclic behavior.
This chaotic climate change behavior would impact the validity of the forcing-feedback paradigm as well as our ability to determine future climate states and the sensitivity of the climate system to increasing CO2. If the climate system has different, but stable and energy-balanced, states, it could mean that climate change is too complex to predict with any useful level of accuracy.
El Nino / La Nina as an Example of a Chaotic Cycle
Most climate researchers view the warm El Nino and cool La Nina episodes conceptually as departures from an average climate state. But I believe that they are more accurately viewed as a bifurcation in the chaotic climate system. In other words, during Northern Hemisphere winter, there are two different climate states (El Nino or La Nina) that the climate system tends toward. Each has its own relatively stable configuration of Pacific trade winds, sea surface temperature patterns, cloudiness, and global-average temperature.
So, in a sense, El Nino and La Nina are different climate states which Earth has difficulty choosing between each year. One is a globally warm state, the other globally cool. This chaotic “bifurcation” behavior has been described in the context of even extremely simple systems of nonlinear equations, vastly simpler than the equations describing the time-evolving real climate system.
The Medieval Warm Period and Little Ice Age
Most historical records and temperature proxy evidence point to the Medieval Warm Period and Little Ice Age as real, historical events. I know that most people try to explain these events as the response to some sort of external forcing agent, say indirect solar effects from long-term changes in sunspot activity. This is a natural human tendency… we see a change, and we assume there must be a cause external to the change.
But a nonlinear dynamical system needs no external forcing to experience change. I’m not saying that the MWP and LIA were not externally forced, only that their explanation does not necessarily require external forcing.
There could be internal modes of chaotic fluctuations in the ocean circulation which produce their own stable climate states which differ in global-average temperature by, say, 1 deg. C. One possibility is that they would have slightly different sea surface temperature patterns or oceanic wind speeds, which can cause slightly different average cloud amounts, thus altering the planetary albedo and so the amount of sunlight the climate system has to work with. Or, the precipitation systems produced by the different climate states could have slightly different precipitation efficiencies, which then would affect the average amount of the atmosphere’s main greenhouse gas, water vapor.
Chaotic Climate Change and the Forcing-Feedback Paradigm
If the climate system has multiple, stable climate states, each with its own set of slightly different energy flows that still produce global energy balance and relatively constant temperatures (whether warmer or cooler), then the “forcing-feedback framework” (FFF, as my Australian friend Christopher Game likes to call it) would not apply to these climate variations, because there is no normal, average climate state to which ‘feedback’ is constantly nudging the system back toward.
Part of the reason for this post is the ongoing discussion I have had over the years with Christopher on this issue, and I want him to know that I am not totally deaf to his concerns about the FFF. As I described yesterday, we do see forcing-feedback type behavior in short-term climate fluctuations, but I agree that the FFF might not be applicable to longer-term fluctuations. In this sense, I believe Christopher Game is correct.
The UN IPCC Will Not Address This Issue
It is clear that the UN IPCC, by its very charter, is primarily focused on human-caused climate change. As a result of political influence (related to the desire of governmental regulation over the private sector) it will never seriously address the possibility that long-term climate change might be part of nature. Only those scientists who are supportive of this anthropocentric climate view are allowed to play in the IPCC sandbox.
Substantial chaos in the climate system injects a large component of uncertainty into all predictions of future climate change, including our ability to determine climate sensitivity. It reduces the practical value of climate modelling efforts, which cost billions of dollars and support the careers of thousands of researchers. While I am generally supportive of climate modeling, I am appropriately skeptical of the ability of current climate models to provide enough confidence to make high-cost energy policy decisions.
We are currently in an ice age. We are in an interglacial period during an ice age. The climate’s normal state seems to involve a mile high pile of ice where I now sit.
As far as I can tell, the Holocene is way more stable than the previous interglacial periods. The long term trend during the Holocene seems to be a slowly decreasing temperature.
When the Holocene is done, we will bang back into glaciation.
The two apparent stable states in the climate seem to be mostly glaciation interspersed with short interglacials.
Unfortunately, the natural climate change deniers disregard those facts.
They don’t need no stinkin facts, the Gretins believe. You waycist factmonger!
“…way more stable than the previous interglacial periods”
The pastoral Norse colony-dwellers of Greenland in the 14th Century paid with their lives when they found the seas around them freezing solid for most the year. Seas that seemed for centuries to be ice-free and the land climate gentle enough for grass fields to feed livestock. Once the seas began freezing regular blocking of their trade and escape routes to their brothers and sisters to the east. And then their pastures stayed frozen and they had to eat their livestock in a slow descent to starvation.
Stable is goo until you find yourself at the boundary transition. Adapt, relocate, or die. Today we have fossil fuels and energy sources not available at anytime in the past to save our butts. And the Socialists want to kill most of us off as they sit on their self-proclaimed moral high ground to “Save the Planet.”
For me, there is nothing more despicable than a Bernie Sanders or Elizabeth Warren who wants to take us there to achieve a Socialist Dystopia for their political ambitions.
I just posted this observation with regard to glaciation at JoNova:
Interglacial brings to mind a period of warm and balmy conditions across the globe while glaciation brings to mind cold and low solar input. However considering glaciation from an energy perspective provides a somewhat different view.
During glaciation, the sea level falls up to 120m. During the times of rapid glaciation, the sea can drop at a rate of 50m in 10,000 years. That equates to a fall of 5mm/yr. That water needs to be evaporated from the oceans then deposits as ice on land. The energy of ice deposition from water vapour is 2590kJ/kg. Every sq.m of ocean, requires excess energy of 12.9MJ each year to enable the ice to be deposited on land. It may not be intuitive, but making ice mountains from sea water is an energy intensive process.
Given that the Southern Hemisphere is 80% water while the Northern Hemisphere is only 60% water and the Northern Hemisphere has twice as much land as the Southern Hemisphere, glaciation requires a significant transfer of energy from the Southern Hemisphere to the Northern Hemisphere. Considering the distribution of water, it means the oceans in the Southern Hemisphere require an extra 2W/sq.m for 6 months of the year to evaporate water that gets deposited as ice in the northern hemisphere.
This energy transfer gives insight into why orbital eccentricity is the cause of glaciation.
From 2001 to 2100, the globe will be 16700km further from the sun during the austral summer and 7000km closer during the boreal summer; the orbital eccentricity is still reducing and will continue to reduce for the next 10,000 years or so:
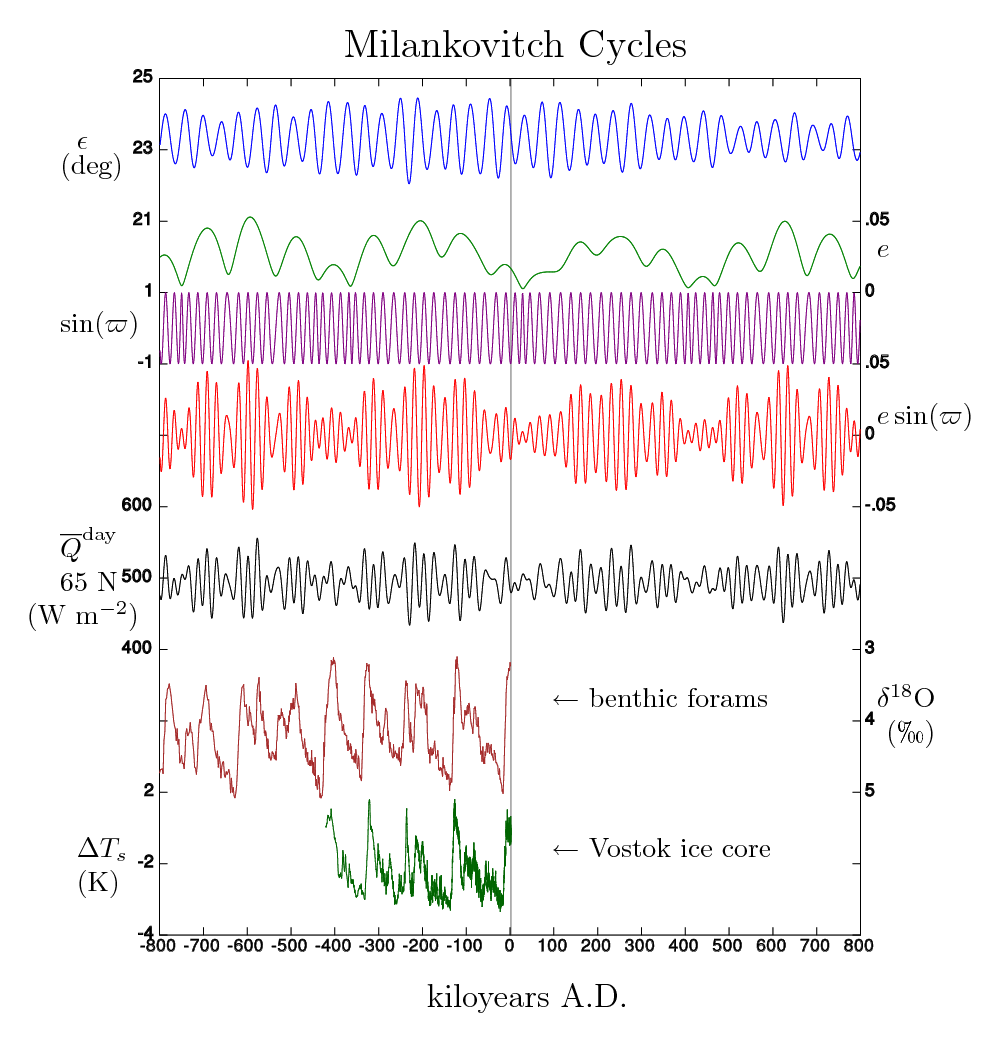
Under these conditions, the difference in energy input between the Northern and Southern Hemispheres over an annual cycle are reducing. We should expect to observe ongoing retreat of land ice in the Northern Hemisphere. In 10,000 years or so the next glacial period will begin. For now, enjoy the interglacial although I expect Australia will be a wetter place during the glacial period, which would be nice.
I wonder how many climate models incorporate orbital eccentricity? It is the most powerful and predictable driver of global climate change.
I disagree. Requires no more energy transfer than today. Only difference is that today the precipitation falls as rain and returns to the ocean via rivers instead of falling frozen and staying there. In fact, there is LESS precipitation during glacial periods and deserts expand, it just doesn’t go back into the ocean. A few thousand years of piled up precipitation that doesn’t flow back to the sea is going to have a major impact on sea level. But glacial periods are generally less energy intensive than interglacials as there is generally less evaporation going on.
The fact that the ice piles up indicates that there is a massive transfer of energy from ocean to land.
The mass of land ice increases by 4.3E16 tonne during glaciation; more than the current total ice mass. With annual runoff, there is no accumulation of water as ice so no accumulation of energy. The energy transfer occurs only over the annual cycle.
No more water piles up on land with ice than piles up today in the form of water. The difference is that the water flows back to the ocean. Once the usual winter snow doesn’t all melt in a summer, the snow will begin to accumulate year to year and eventually form ice. In fact, MORE water falls on land today than during an ice age. So according to your logic, there is more energy transfer today. All the snow that falls in Idaho today melts and runs into the ocean in summer. In an ice age, LESS snow actually falls per year but it doesn’t melt. Oh, and the world’s largest desert is Antarctica. The south pole station gets about 0.1 inch of water equivalent precipitation per year.
Also, the ocean becomes saltier during an ice age which probably results in it being more difficult to form sea ice.
The water is returned to the ocean each year at present. The Northern Hemisphere is receiving enough energy to melt the snow that falls each year. During a glacial phase there is not enough energy arriving in the Norther Hemisphere each year to melt the snow but there is enough energy arriving in the Southern Hemisphere to evaporate the water from the oceans.
It is the large energy imbalance between the hemispheres and the dominance of water in the Southern Hemisphere that results in glacial phase.
By my logic the energy imbalance is accumulating year on year by shifting vast volumes of water from the oceans to land. At present there is insufficient imbalance for that accumulation.
The fact that Antarctica receives little precipitation supports the energy intensive nature of transfer of ocean water to land ice. If the globe was just cold over the entire surface there would be very little precipitation anywhere because evaporation would be low.
Isn’t most of the energy lost in space? Tbe two lots of latent heat have to go somewhere, it’s not the atmosphere or the ocean and not the land mass that’s buried under the ice.
I think you should go back and read up on latent heat.
To deposit all that water as ice means a LOSS of energy from the system to space.
Not a gain..
The loss of heat occurred in the Northern Hemisphere because that is where the ice was deposited – as you pint out. BUT the gain in heat occurred in the Southern Hemisphere because that is where the water came from. So the build up of ice on land in the northern hemisphere indicates a huge transfer of energy from the Southern Hemisphere to the Northern Hemisphere. Significantly greater than in the current era.
The difficulty with this theory is that the glaciations tend to follow the obliquity cycle rather than the excentricity cycle.
And if you knew something about the Pleistocene you would be aware that Australia is much drier during glaciations, not wetter.
Your time horizon is only a few million years, going back farther:
A hothouse climate mode (no arctic zones at all) appears to be Earth’s usual state.
The ice house mode we’re in is less common.
Going back a few million years the distribution of water across the globe was different than now. Opening of Drake Passage enabled the southern ocean circulation and that resulted in significant heat transfer from Earth’s main solar collector, the Pacific Ocean, to the second biggest collector, The Atlantic Ocean.
Scotese did an update of the phanerozoic temperature

That is pure CAGW propaganda. A difference of 2.1 degrees between the LGM and “preindustrial” climate? Ridiculous.
It is rather difficult to find a place anywhere on Earth where the difference was as small as that. Possibly parts of the Western Pacific would fit. On land the temperature difference is on the order of 5-7 degrees in the tropics and much more at higher latitudes.
“As far as I can tell, the Holocene is way more stable than the previous interglacial periods.”
That is highly doubtful. Interglacials are in general much more stable than glacials, but they are usually interrupted by brief cold intervals. There was one during the Eemian, and there has been two, or three in the present one (the 9.6 KA event, the 8.2 KA event and perhaps the 4.2 KA event, though this was more dry than cold).
“But what if the climate system undergoes its own, substantial chaotic changes on long time scales, say 100 to 1,000 years? The IPCC assumes this does not happen. But the ocean has inherently long time scales — decades to millennia.”
This is exactly why the IPCC’s claim that all the recent (since 1950) global temperature change is mostly due to CO2 increases is mere hogwash. And why their 1980-present warming trend attributed to CO2 fails because CO2 can’t explain the 1910-1945 warming trend. This internal natural cycling certainly didn’t stop after 1950, or 1960, or 1970 ….
Complex, multi-compartmented systems with energy flows through them exhibit multiple periodic behaviors – behavior cycles with different time scales, even if at the longest times scales there appears zero secular trend. The Time constant for the energy flow through each compartment is different. Thus the system oscillates. And long-term prediction (deterministic calculation of) is impossible as Dr Spencer acknowledged –the sensitive dependence of initial state.
This is such a basic obvious understanding of a complex physical system that it really is sad that alarmist Climate Scientists, claiming all recent warming (or most) is due to human activity added CO2, think the rest of the intelligent, technically competent, mathematically literate public do not understand that and that we see through their deceptions. Deceptions driven by political ideology adherence, Noble Cause Corruption, Rent-Seeking job-protection behaviors, reputation protection, and/or All the Above.
Yes. All of this has been long known, and ignored.
As Dr. Spencer points out, funding and whole careers are built on the unspoken understanding that the leaders of the field will never rock the boat and openly admit to policy-makers that what they do is probably entirely worthless.
That doesn’t mean that all climate modelling is necessarily entirely worthless but they chose to play the game for high stakes when the Godfather of the discipline, Ed Lorenz, cautioned them to only take on tractable problems. It is long since too late for them to acknowledge their errors. Only externally imposed funding cuts may produce the needed course correction.
“Deceptions driven by political ideology adherence, Noble Cause Corruption, Rent-Seeking job-protection behaviours, reputation protection, and/or All the Above. ” Perfect.
And this science happened in the wrong order to be well intended. As with Nazi science, the science came last, as a tool to justify the beliefs, and the action taken in their name, once the beliefs were indoctrinated in the faithful so they believed they were doing god’s work, etc..
Climate “science” departments were created to prove the political justification for pre ordained “action”., never to find out ho what changed the climate and how. Which is why the models don’t are not supported by 50 years of satellite observations.
Follow the money. The money to expand the pseudo science of climate change came from UN politicians, to promote their beliefs and deceits to control energy use and hence deliver their political and fiscal agendas.
Once your life and career depends on the climate nasties, then their rackets become your pay cheque, loyalty is not a choice, the truth becomes betrayal, punishable by taking you out, of your career at least.
What applied to Michael in the Godfather applies equally to these damned to eternal deceit climate “scientists”. Trapped, willingly or not, knowingly or not, in the deceit based, money driven, $1T pa UN climate change protection racket. Never able to do real science again. A non numbers game, that you realise, as your expertise grows, only supports avoidable economic misery imposed on Billions of people , forced to pay regressive in fact renewable energy tributes to subsidise solutions that can’t work, to solve a problem that isn’t real, justified by the pseudo science that these inadequate fraudsters must support for their publishing eternity, and can never tell the truth about, except as a retired “denier”.
I’m Winston Wolf, and I’ve come to retire you…….
well duh > ?auto=webp&s=47f77c8c4279693af7e612ce36283d6611d9e007
😀
Why omit the most recent 70 years of data?
Wait, never mind.
Because the GISP core does not go further. Though one wonders why. It would have been easy to take snow samples going right up to the present and analyze them, but for some reason none of the ice-core teams seems to have done so….
“Snow samples” do not trap-, and are continuously exposed to- and contaminated by the atmosphere (air). Need to wait until the snow is so compacted that it has turned to ice with trapped air.
Snow samples will be “off” at best.
Oddgeir
Not.
That only applies to the trapped gases (e. g. CO2). The temperature is derived from the isotope ratios (oxygen and hydrogen) from the snow itself, which is not affected by this.
If this wasn’t so it wouldn’t be possible to track the changing seasonal temperature and counting (and measuring) the annual layers which is routinely done.
The only exception is when there is a major “melt event” (about once a century at the ice-divide, the last ones were in 1888 and 2012). This will mess up both temperature and atmospheric gas proxies for several years, by distributing meltwater vertically and creating an airtight sealing ice layer.
Averaging the global temperature tells us nothing of the real world weather as experienced by individual countries.
A glance at central England temperature back to 1659 illustrates there is no such thing as an average, the climate varies wildly with periods of warmth and cold and even those periods of warmth are interspersed with periods of cold and periods of cold are interspersed with periods of warmth. Stable periods are relatively rare.
The longest was probably the MWP but even this 400 year long period had its cold times but we could say its main characteristic were warm summers, moderate winters, limited rain and moderate winds.
The most violent weather occurred in the LIA which also had surprising periods of warmth interspersed with savage storms and ice cold winters. So is there an ‘average’ climate? Not in the real world of real countries but perhaps only in the average and artificial global temperature.
Tonyb
“Averaging the global temperature tells us nothing of the real world weather as experienced by individual countries.”
Of course it doesn’t, Tonyb, as I have pointed out to Roy Spencer a few months ago.
Lukewarmers need to get off the fence.
Individual climate zones might be a better reference than individual countries.
”Lukewarmers need to get off the fence.”
Agreed. Pick a side. We have enough historical information now that points to natural warming being a way stronger hypothesis than the co2 nonsense.
The most striking thing about all UK weather data over any length of time is that an “average” recording is extremely rare. It is almost always wetter or dryer, hotter or colder than average. It is like having a population of only quite short and quite tall people – there are very few if “average” height.
And we swing around the average on quite short time-scales. A few days quite colder than average followed by a few days quite warmer. Or as our wholly arts-educated like to shout “a months rain in just two days!”.
To say “Does that “the Climate System Have a Preferred Average State’ infers that it is sentient.
The laws of nature regarding “climate” just … are. There is no “Ma’ Gaia” (Mother Nature if you prefer) to decide that some Mann has disturbed her blankets.
Your response is understandable, though the meaning in this case is more like – a tendency toward.
The wintry scene depicted at the head of this post are most often depicted by Brueghel paintings with the first around 1565 as Europe descended into one of the periods of the intermittent little ice age
Yet the years around 1540 were probably the hottest and driest in 500 years. So variability is the norm. Average weather is a chimera.
Tonyb
Dr. Spencer,
Excellent essay. Thanks for sharing your experience and thinking.
unfortunately he is wrong
I love a good bit of ‘proof by assertion’ from the resident warmist.
Weak, Steven. Pathetically weak.
Apparently, it’s wrong to speculate.
Or maybe that’s: it’s wrong to make simplifying assumptions.
Can’t see what else could be assumed you mean Mr Mosher – surely the genralist nature of your assertion should be applied to the entire article, if not the man.
Otherwise, why not be a little more specific? You might teach something.
No, you are wrong.
Oh I think I win that argument!
Seriously, nobody knows who us right or wrong, claiming knowledge that doesn’t exist is pretty pathetic.
And we trust your opinion because? Try some evidence and proof. Tumbleweed…..
Heh. My 2-year old son uses that tactic too. Whenever he is dissatisfied with something in his life, he just says “No!” or “It’s wrong!”. Usually he resorts to shouting (or violence) when I gently point out to him that merely stating that something is wrong without providing a proper reason doesn’t necessarily, in fact, make it wrong (for the rest of the world/us/the known existence).
I’ve discovered Mosher’s argument further below, by the way. Whenever he actually explains what he means, I always find it very interesting to read his comments, uncouth as they sometimes might be. Contrary opinions are almost always useful, provided that any clear and semi-coherent argument is presented.
It’s difficult to write comments when using a smartphone while driving ..
Yes, excellent essay.
About that painting. We had at home a book with many illustrations of paintings from the period. Hendrick Avercamp is another painter of such wintery landscapes, look him up. So, being familiar with those works, when mr Mann managed to get his pseudo science in print, disappearing the little ice age, I knew at once and without a shadow of a doubt that it was nonsense.
The climate system does indeed have a preferred steady state, but this is not a preferred steady state surface temperature, but a preferred steady state relationship between the planets emissions and the NET surface emissions, where this preferred relationship requires the surface to emit about 1.62 W/m^2 for each W/m^2 emitted by the planet. The reciprocal of this, 0.62 W/m^2 of planet emissions per W/m^2 of surface emissions, represents the dimensionless emissivity of an EQUIVALENT gray body model of the Earth whose temperature is that of the surface and whose emissions are that of the planet.
This average ratio is repeatably and testably constant across slices of latitude from pole to pole and over periods as short as 1 month, each of which, while having a different average temperature, maintains a constant average ratio of surface emissions to planet emissions. The relationship between the instantaneous incident energy and the instantaneous planet emissions is where the chaos lies, however; in the long term steady state; the average input is equal to the average output, thus the average between the input energy and surface emissions converges to the same constant ratio, albeit in a far more chaotic manner, since albedo (clouds) affect both the input energy and the surface temperature. You don’t have to take my word on any of this, as it’s all readily testable.
Some may claim that the system is more complicated than this and cite things like latent heat and other non radiant forms of energy as contributing to the radiant balance. However; all such things represent is the redistribution of existing energy around the planet and thus do not contribute to the RADIANT balance of energy entering and leaving the planet, or for that matter, even the RADIANT balance of the surface.
Others reject the idea that the planet can be so simple as to be represented as a gray body. Surely, this would have already been discovered if it was the case. The simple fact is that there’s no other physics that can quantify the relationship between temperature and W/m^2. The IPCC implicitly assumes that physics exists to quantify a linear relationship between them, but fails to identify or explain what this new physics is, especially considering that approximate linearity around the mean is all they do claim which is wildly insufficient for the analysis being used.
If we treat the Earth as a Black Box at the TOA, then certainly what you say is true — radiant incoming-outgoing balance occurs. This is what GCM modelers hope to achieve, but frequently do not in their simulations.
But below the skin of Black Box is where we live and the interesting stuff happens.
Joel,
Yes, interesting things happen at the micro scale, but at the macro scale, it’s even more interesting as the system MUST conform to the laws of physics, where the 2 most important ones are COE and the Stefan-Boltzmann LAW and that to accomplish this requires counter intuitive cloud behavior in order to maintain a constant effective emissivity from pole to pole. What makes this so interesting is that so much of what’s perceived as ‘complications’ are actually moot as a consequence of the predicted counter intuitive cloud behavior, which itself has been observed, confirming my hypothesis.
Apply these laws and the sensitivity takes on the deterministic value of 1/(4eoT^3), where e is the effective emissivity of 0.62 W/m^2 of emissions per W/m^2 emitted consequential to a BB at T and o is the SB constant. Plug in the average temp of 288K and the sensitivity becomes 0.3C per /m^2 which is below the IPCC’s lower limit of 0.4C per W/m^2 which is so small already, the IPCC doesn’t even bother to construct an RCP scenario around it.
BTW, the data couldn’t be any more conclusive that the planet behaves like a gray body, as seen in this scatter plot, that additionally confirms a low ECS (0.3C per W/m^2 @ur momisugly 288K).
http://www.palisad.com/co2/tp/fig1.png
The green line is the deterministic behavior of an ideal gray body whose emissivity is 0.62. The small red dots are monthly averages for each 2.5 degree slice of latitude from pole to pole and the larger dots are the averages for each slice over about 3 decades of weather satellite data. Plot monthly averages of any two climate variables against each other and no other pair has as tight of a distribution of dots as seen in this plot which is the unambiguous signature of a goal driven system.
The short blue line is the IPCC nominal ECS plotted to the same scale as the data which is so obviously wrong it’s impossible to miss.
Of special importance is the tight clustering of the blue and green long term averages where they align virtually on top of each other appearing as black dots. This indicates the exact same behavior between the hemispheres and this is the only relationship between any pair of climate variables that does not show significant differences between hemispheres. Many such plots can be found here:
http://www.palisad.com/co2/sens
Even more interesting is this scatter plot of the fraction of the surface covered by clouds vs. the surface temperature.
http://www.palisad.com/co2/sens/st_ca.png
Note the distinctively different behavior between the 2 hemispheres (green vs. blue). Also note that the ratio of surface emissions to planet emissions is highly dependent on the amount of clouds hence my earlier assertion that a counter intuitive cloud behavior is required to maintain a constant emissivity from pole to pole. The question this raises is does a really bizarre hemisphere specific behavior of clouds coincidentally result in a mostly constant effective emissivity of 0.62 from pole to pole, or is a mostly constant effective emissivity of 0.62 from pole to pole the goal (i.e. a constant ratio between surface emissions and planet emissions) and the clouds adapt to meet this requirement. There can be only one correct answer, hence my initial assertion. I’m also closer than ever to being able to explain why 1.62 W/m^2 (the golden mean) emerges as the goal.
There are so many reasons the IPCC ECS is fundamentally defective that it is difficult to say which one has priority.
Ultimately the CMIP ensemble is just an enormous stinking pile of poo. A very expensive pile of poo though.
The error I’ve identified upon which all other errors depend is the incorrect linearization of the relationship between W/m^2 and temperature while ignoring the linearity required by COE between W/m^2 and other W/m^2 independent of whether the W/m^2 are quantifying forcing or emissions which in the steady state must be equal to each other. The IPCC has framed the problem incorrectly from the get go.
The only possible linear metric for the climate sensitivity is W/m^2 of surface emissions per W/m^2 of forcing. The data is unambiguously clear that this relationship is indeed linear which is a necessary condition for manifesting a constant ratio quantifying W/m^2 of output (equivalent SB emissions consequential to a temperature) as a function of W/m^2 of input (forcing).
The more I’ve looked in to this, the more I’ve become concinced that an energy balance consistent with a constant emissivity from pole to pole must be the goal of the climate system. How can the data be explained in any other way? The behavior is far too complex to be just a coincidence. I’ll even go out on a limb and predict that we will observe this same ratio on exoplanets whose dynamically semi-transparent atmosphere spans an emissivity of 1/g, where g is the golden mean.
Can’t treat Earth as a black body as it is not, therein lies the problem with models (And all predictions based on them).
Patrick,
The Earth would be a black body if there was no atmosphere, just like the Moon. An atmosphere adds a layer between the source of stored energy resulting in emissions (the surface) and space that turns a black body surface into a gray body planet. In fact, it’s this grayness that’s directly responsible for a surface temperature warmer than the incident energy can support directly. Note that a gray body is not a black body. The Stefan-Boltzmann LAW quantifies both because the T^4 relationship between W/m^2 and degrees is immutable physics.
Grayness is manifested by atmospheric absorption by clouds and GHG’s that temporarily blocks surface emissions from leaving the planet. About half of the energy absorbed by the atmosphere is returned to the surface replacing emissions in excess of the solar forcing allowing a higher LTE surface temperature while the remaining half is ultimately emitted into space contributing to the planets radiant balance.
If you disagree with this, then you must be able to say what other law(s) of physics, other than the SB Law, can quantify the relationship between the surface temperature and the planets emissions? Keep in mind that the SB relationship for a gray body whose temperature is that of the surface, whose emissions are that of the planet and whose effective emissivity is 0.62 already precisely quantifies the measured relationships between the surface temperature and the planet emissions above that point on the surface.
Whatever physics you can come up with to support your position, must have the same behavior as the SB Law for a gray body, as required by the data. I will ask you to support your position in another way, which is explain what physics exhibits the behavior of the SB Law for a gray body that’s not the SB Law?
I get that many have been conditioned to believe that the climate is so complicated that only extraordinarily complex models can reproduce its behavior. This is the desired outcome of the IPCC’s pseudo-science since if people actually recognized the simple elegance of the planets bulk behavior, the IPCC would no longer have any reason to exist.
Well, that is the point. IIRC, all models initialise the earth as an idealised black body radiator which it isn’t.
Patrick,
The Earth at TOA is an EQUIVALENT black body, that is, the 255K temperature assigned to it is the equivalent temperature of its outgoing radiation of about 240 W/m^2. The surface itself is very close to an actual black body with an emissivity close to 1 and average emissions of about 390 W/m^2 corresponding to an average temperature of about 288K. The linear reduction from 390 W/m^2 at the source to 240 W/m^2 at TOA is trivially quantified as an emissivity whose value is 240/390 = 0.62.
Note that the proper way to calculate an average temperature is to calculate average emissions first, whose linear average is absolutely representative of the whole and then convert the result to an EQUIVALENT average temperature. This concept of equivalence is crucial to understanding how modeling works and why changes to averages are representative of changes to the whole. There’s no such thing as an exact model of the climate. All models are equivalent models and the best model is the simplest model that matches the data and this is unambiguously the SB Law with an emissivity of about 0.62.
The simplest proper model of the Earth is a gray body whose temperature is that of the surface and whose emission are that of the planet. This not a black body, but is a gray body, satisfying your assertion that the Earth is not a black body, but none the less the SB equation can still exactly quantify the systems behavior. Moreover; it’s trivial to connect the dots between a black body and a gray body, while it’s impossible to connect to dots from a black body radiator to what the IPCC claims happens when a thin layer of gas is inserted between a nearly ideal black body surface and space.
The SB constant and the exponent in the T^4 relationship between W/m^2 and temperature are immutable. The only possible way to change the relationship between W/m^2 and temperature is to scale it with a non unit emissivity between 0 and 1. THERE IS NO OTHER RELEVANT PHYSICS!
Models.
RE: “Does the Climate System Have a Preferred Average State?”
Yes! 100,000 year continent spanning glacial periods interrupted by brief 10,000 year warming periods. Well documented science, for those that understand real climate change.
ATTP has an article up on societal tipping points with the comment
“one issue in the future could be that climate change will increase the probability of us experiencing multiple, severe, climate-related events at the same time”.
The article highlights the issue Roy makes that only human induced warming is considered by warmists and the IPCC.
I pointed out the multiple probability fallacies in the statement in that going into the future alone is sufficient to increase probability without climate change needing to be invoked at all and that the reverse could also equally likely occur.
That is that that climate change will also decrease the probability of us experiencing multiple, severe, climate-related events at the same time and that the change goes could equally be beneficial.
Evidence of nonlinear dynamics and chaos driven by Hurst persistence.
https://tambonthongchai.com/2018/05/25/nonlinear-dynamics-is-climate-chaotic/
https://tambonthongchai.com/2019/02/26/a-chaotic-solar-cycle/
I’m not sure about ‘A’ preferred natural states, but I suspect there are a few preferred states involving precession, orbital perturbations, and tectonics, all creating very slow processes of climate change. During transitions caused by those variables, I believe the oceans create a large inertia to any significant climate change, with perhaps the Roman Warm Period and Little Ice Age representing the two extremes for the current orbital characteristics, earth tilt, and land mass configuration.
All this, of course, precludes one-off events like an asteroid collision.
Further, I think the only thing that really has been established is that the Earth does go through periods of climate change, and a climate colder than we have today is the most common condition.
‘ and a climate colder than we have today is the most common condition.’
only for the last 2.5 million years.
A bit more as a matter of fact. Four of the five latest interglacials (MIS 1, 5e, 9 and 11) are actually the warmest intervals for about 3 million years.
But before that it was warmer than now for c. 300 million years
“But what if the climate system undergoes its own, substantial chaotic changes on long time scales, say 100 to 1,000 years? The IPCC assumes this does not happen. But the ocean has inherently long time scales — decades to millennia. An unusually large amount of cold bottom water formed at the surface in the Arctic in one century might take hundreds or even thousands of years before it re-emerges at the surface, say in the tropics.”
“A nonlinear dynamical system needs no external forcing to experience change.”
–
It is very hard to conceptually understand heat loss from the planet in general to pockets of retained or lost heat circulating out of sight.
I understand it happens but at the same time there “has” to be a balance. If unusually large amounts of cold water form in one place other areas have experienced more heat gain even if it was thousands of years ago.
External forcing still goes on with minor variations due to the variable cloud formations that the variable surface temperatures from past and more recent past events cause.
The point that this can cause global surface temperatures to increase or decrease by a degree C for over a hundred years naturally is well made.
The fact that such large amounts of heat or colds can come back for such a long time leads back to the amount of uncertainty possible.
This would allow with reasonable possibility a rise or fall of at least 3 degrees centigrade for a century plus once every other millenia. A bit like a 1 in 500 year flood event.
On a smaller local scale we see the tropics being unusually 2C colder off Darwin and every one remembers the hot blob off Alaska for years.
The IPCC does not want to discus any “”Facts”” which go against its long term ideological viewpoint of a Socialistic i.e. Communist World government.
Weather and the 30 year “”Climate”” average are always changing, but that is of no interest to the IPCC. Its just the smoke screen to fool all of the sadly numerous “” Useful Idiots” out there.
The politicians while pretending to actually represent the people, are in it for what they can get out of it.
MJE VK5ELL
My observation of nature and my profession as a geologist are what make me a skeptic. Numbers are nice to play with, but not essential.
Everything in a nature is in a state of change. Over the long-term there is no ‘preferred’ average state. Within the short-term there may appear to be one as the essential cyclical processes, on which short-term stability is reliant, are in play. Without a degree of short-term stability natural diversity on Earth would not exist. There is a dominant state-range that makes up the chunk of the bell curve representing values within cycles. However these values will be trending in one direction over time.
Climate, like all other natural processes, acts like a pendulum on a boat, swept along by the river of time. To suggest that negative feed-backs don’t control the swing of the pendulum or that climate will reach a tipping-point is the height of stupidity IMO.
Cheers
M
How sceptical is “appropriately skeptical”?
It seems to me that is the same thing as asserting that however skeptical you are, it is the correct amount.
The amount could be on the continuum of phrases such as “…hardly at all, very slightly, somewhat, kind of, moderately, more or less, pretty much, rather, mostly, highly, extremely, almost completely…”, or so it seems to me.
Just sayin’.
I’m not sure at all if the model predictions are valid. One thought is that heat finds different ways to escape. If it is humid in one area and drier in a close by area the heat will escape through the drier area. An analogy is with trying to make a home insulated. It is not so easy to insulate a home because there are many ways for the heat to escape, for example windows, chimney, poorly sealed doors and windows, and areas that the insulation did not cover.
Very informative post. Thank you.
Maybe it is time to kick the sand out of the UN IPCC sandbox. Make them play in the real world.
..or how doubt-monger Roy beats the snot out of a scarecrow, ’cause BAU.
“The UN IPCC scientists who write the reports which guide international energy policy on fossil fuel use operate under the assumption that the climate system has a preferred, natural and constant average state which is only deviated from through the meddling of humans.”
First strawman. Where is this is “assumption” stated by the IPCC? Nowhere.
“whether there are other ‘external’ forcing agents of climate change, such as the sun.”
Second strawman. Who thinks there are not other external forcing agents? No one.
“But what if there isn’t only one preferred state?”
Third strawman. Who thinks there is? No one.
“But what if the climate system undergoes its own, substantial chaotic changes on long time scales, say 100 to 1,000 years? The IPCC assumes this does not happen.”
Fourth strawman. Where is this assumption stated? Nowhere.
“As a result of political influence … it will never seriously address the possibility that long-term climate change might be part of nature.”
Fifth strawman and here we get to the nub of Roy’s message: there is too much uncertainty because its too chaotic and its all political anyway so lets do nothing.
Meantime Actic ice continues to fall of a cliff, etc, etc, etc.
What’s Actic ice? Or do you mean Walruses “continues to fall of a cliff”?
Loydo
The met office until ten years ago used to have a variation of your second paragraph on their web site. So yes, that was the presumption.
Tonyb
Can you clarify what you say they were presuming?
Loydo
That the earth had a stable climate until man started interfering with it
Tonyb
”Meantime Actic ice continues to fall of a cliff, etc, etc, etc.”
So what?
Would you perhaps be more at ease if ice were growing? Or maybe staying the same forever?
Your statement is meaningless garbage.
Far too polite. Loydo refuses to accept reality, being a believer.
All those assumptions are stated in the models. The control runs dont deviate over the long term.
“All those assumptions are stated in the models.”
Care to provide some evidence?
Just go and look at the control run results. Its an implicit assumption by the modelers.
And only the Sun can warm the ocean.
“They construct their climate models so that the models do not produce any warming or cooling unless they are forced to through increasing anthropogenic greenhouse gases, aerosols, or volcanic eruptions.”
WRONG.
You can produce warming and cooling by changing TSI as well. Further, in all models even if you hold the sun (TSI) and everything else constant you will still get change. FFS Roy havent you every looked at the
CONTROL RUNS? Jesus. what happens when you hold everything constant? YOU STILL GET SOME CHANGE. this is one way the impact of natural variability is assess
Changing TSI by how much? We have Lief (Sp?) who says the difference between solar TSI minima and maxima is not enough to affect climate and temperatures.
AR5 WG1 Chapter 8 say this on TSI:
“ the few tenths of a percent bias in the absolute TSI value has minimal consequences for climate simulations because the larger uncertainties in cloud properties have a greater effect on the radiative balance. “
Thus the cloud formation-water vapor properties, precipitation rate the modellers tune and hand massage to achieve whatever sensitivity they expect creates internal variability and an uncertainty magnitudes greater than historical absolute excursions of TSI min to max.
Well, modellers…
Steven Mosher, I think that you have stuffed up on this one. The fact is that unforced internal variability will sum to zero over time, or basic laws of physics are violated. In other words, the models necessarily operate as described by Roy Spencer.
Am I correct in saying that unforced internal variability will sum to zero over time, or basic laws of physics are violated? Well, I’m quoting from a comment further down in this thread – by Steven Mosher.
Just ‘this one’? Mosher’s bias keeps him so stuffed he needs a month of Exlax to clear his vision.
For the life of me I cannot understand that people still defend climate modelling and hold a straight face.
Mike, It is one of the benefits of having two faces…. 🙂
It’s amazing how hard it is to convince a man of truth when his income depends on denying reality.
Mosher writes
Sure. Noise but no “change”. From
https://agupubs.onlinelibrary.wiley.com/doi/full/10.1029/2011JD016263
Santer tells us
And this is because models’ control runs are noisy but neutral for change and only after 17 years can a distinction be made between noise and signal. In other words the models remain neutral and observations of change become significant.
Specifically
TSI varies by 6.9% every 182.5 days, as the Earth goes from perihelion to aphelion. That’s a change of 94 W/m^2, and dwarfs all other solar variations combined. Almost every time TSI variation is discussed, I ask how the climate models respond to this, and have never gotten an answer (perhaps because I got tired of waiting for one, and stopped checking).
Roy, given that warming occurs when exit of the insolation heating from the sun is delayed from escaping to outer space, what do you think of the phenomenon of rapid convective by-passing of the lower troposphere component of the thermal system? This must delay the exiting heat even more than radiative gases given that the interruption time for convection is orders of magnitude greater than for the the speed of photons.
My eyes were opened by the WUWT article on this topic by Stephen Wilde and John Hultquist who showed that convective heat transfer may well be the main way that warming of a planet takes place.
I think it was Philip Mulholland rather than John Hultquist.
See my comment below for a reminder.
My apologies to Phillip Mulholland!
The assumption that there is a ‘preferred, constant and average’ climate state is analogous to the religion-imposed geocentric model of the cosmos and is similarly quasi-religious or teleological, akin to the Gaia hypothesis IMO.
For some reason people find the idea of chaos and purposelessness in nature disturbing and unacceptable.
Unless its a false assumption.
Are the models valid? Nobody really knows. The earlier models certainly were not as they greatly overestimated the sensitivity. As any analogy many drugs have cured disease in a mouse model, but when applied to humans they did not work. Is the mouse model valid ? It is to a point. We need more acknowledgment from the climate modelers that their models may not be valid. It doesn’t mean that the models have no value. The models DO have value, but I think being honest about their limitations would help move the debate forward.
”The models DO have value”
Only to the people employed to piss-fart around with them.