Guest Opinion: Dr. Tim Ball
When you put the claims of the Intergovernmental Panel on Climate Change (IPCC) in perspective, you get a very different picture that defies logic. I decided to do this because of their recent hysterical claims in Special Report 15 (SR-15) designed to frighten and bully the world into completely unnecessary and enormously expensive environmental and energy policies. Charles Steele summarized their claims and proposed policies in his article, “Climate Doom Ahead? Think Twice,”
“…we have only twelve years to avert climate catastrophe and calls for a fundamental transformation of society and end to the use of fossil fuels. Endorsing it is a critical step towards adopting it, and adopting it would change virtually every element of civil society as we know it today.”
Steele notes that,
“It’s less a scientific report and more a political platform, driven by ideology, not science.”
I agree. Even some members of the IPCC admit it is not about climate but involves an excuse for ideological actions such as a transfer of wealth. However, the majority of the IPCC and its proponents would disagree. They would claim the concern and demand for action are based on science set out in the AR5 Working Group I Report, The Physical Science Basis. Well, let’s examine what they say.
My comments in regular type follow the IPCC claims in italics.
1. Human influence on the climate system is clear, and recent anthropogenic emissions of greenhouse gases are the highest in history. Recent climate changes have had widespread impacts on human and natural systems. {1}
The first sentence is a non-sequitur and represents a classic form of introduction to deception. Human influence is not clear because human production of CO2 is within the error of the estimates of two major natural sources, the oceans, and rotting vegetation. You cannot separate human production from the noise of non-human production and variability. Obviously, anthropogenic emissions are the highest in history. If you have a constantly increasing level, the highest levels are the most recent. The second sentence is unprovable. If you don’t know the baseline, that is the impact of climate change before the human impact, then you cannot determine any trend. Consider just one example. There is more total forest in the world than existed in the past. America has more trees than existed 100 years ago. How do they know? Besides, it depends on what time in the past you choose. For example, there are many more than existed 20,000 years ago at the peak of the last glacial period.
2. Warming of the climate system is unequivocal, and since the 1950s, many of the observed changes are unprecedented over decades to millennia. The atmosphere and ocean have warmed, the amounts of snow and ice have diminished, and sea level has risen. {1.1}
This is another form of introduction to a deception that starts with a false premise. Even a brief look at any historical climate record shows equivocal and even greater periods of warming than those between 1950 and 2018. Just look at the Antarctic ice core record from Petit et al.

Remember, they subjected this curve to a 70-year smoothing, so much of the variability was eliminated. Despite that, there is great variability over short periods. Then consider the Central England Temperature curve from 1659-2018. There is nothing extraordinary in the 359-year record when compared to the 68 years from 1950.

The IPCC assert with 95% certainty that 95% of the temperature increase since 1950 is due to human CO2. The problem is if that is true then the record cold temperatures occurring now cannot occur. If the IPCC claim is correct the only way such record cold can occur is if the CO2 level decreased. However, it is the IPCC who tell us it continues to increase.
The fallacy of the IPCC claims is in the continual changes of temperature that occur every day. The Sun rises, and the temperature begins to increase as the solar angle increases. There is no increase in CO2, just as there is no decrease when temperatures begin to decline as the Sun sets. If CO2 is the dominant factor in temperature increase as the IPCC claim, then it should be a major influence on the daily temperature, but there is no such evidence.
As usual, the mainstream media reports that 2018 is the sixth warmest year on record even before the year is over. This is not surprising or significant because the highest temperatures must occur at the end of a warming period. The most reasonable period to consider for this warming trend is from the nadir of the Little Ice Age in the 1680s or over the last 338 years.
The media reported on front pages all over the world the IPCC 2001 Report that drove the world into warming hysteria because they said temperatures rose 0.6°C in approximately 120 years – an increase not possible without human CO2. Why aren’t they reporting with equal vigor that in just two years from February 2016 to February 2018 the global average temperatures fell by 0.56°C? If the IPCC claim about the dominant role of CO2 post-1950 is correct, then that warming simply cannot happen.

3. Anthropogenic greenhouse gas emissions have increased since the pre-industrial era, driven largely by economic and population growth, and are now higher than ever. This has led to atmospheric concentrations of carbon dioxide, methane and nitrous oxide that are unprecedented in at least the last 800,000 years. Their effects, together with those of other anthropogenic drivers, have been detected throughout the climate system and are extremely likely to have been the dominant cause of the observed warming since the mid-20th century. {1.2, 1.3.1}
Here is another typical form of introduction designed to set the stage for the falsehood that follows by making a statement that appears absolute because of its unjustified certainty. They neglect to say they limited the ‘greenhouse gases’ to CO2, which is approximately 4% of the total. Yes, human greenhouse gas emissions are higher than ever, but you cannot substantiate the claim of their impact if you don’t know how much water vapor, the most important and abundant greenhouse gas by far, there is, or how it varies over time. The claim that levels of carbon dioxide and methane are unprecedented in the last 800,000 years is only true if you ignore the severe problems and limitations of the ice core measures and ignore the 90,000 19th century CO2 readings that show much higher levels. It is not true if you extend the record back to 280 million or 600 million years then the levels are among the lowest. All of this is only valid in their claims if you assume that a CO2 increase causes a temperature increase. However, that is not true in any of the records. Indeed, the lack of correlation between CO2 and temperature in the geologic record contradicts their claim more dramatically. The Ordovician Ice Age, approximately 432 million years ago, occurred when CO2 levels were over 4000 parts per million.
4. In recent decades, changes in climate have caused impacts on natural and human systems on all continents and across the oceans. Impacts are due to observed climate change, irrespective of its cause, indicating the sensitivity of natural and human systems to changing climate. {1.3.2}
This is another classic introduction that appears authoritative, but in fact, is what the English call “Stating the bleeding obvious.” In all decades throughout Earth’s 4.5-billion-year history, climate change caused impacts on natural systems. It is disingenuous and wrong to separate human systems because we are part of the natural system. This is another example of the false assumption that humans are not natural that I wrote about before. The entire comment is an insult to the intelligence. It is a statement of environmental platitudes that says absolutely nothing – in other words, it is purely political. Despite that, production of the IPCC Reports costs millions, and the unnecessary policies, based solely on their falsehoods, cost trillions.
The saddest part of all is a horrible irony. All this waste of time and money to create a lie and inflict completely unnecessary policies at great cost, pain, and damage, is only possible because of successful and wealthy economies based on burning fossil fuels. Paradoxically, the IPCC acknowledges this by saying the less successful economies need financial help to succeed. What do the less successful economies want? The ability to burn fossil fuels. These are the insane actions of politically misguided, ideologues with tunnel vision. It is time to stop the insanity.
The data says CO2 has little if any effect on climate. Temperature is now about what it was in 2002. CO2 has increased since 2002 by 40% of the increase 1800 to 2002. By similarity, none of the other ghg (except water vapor) have any significant effect on climate either.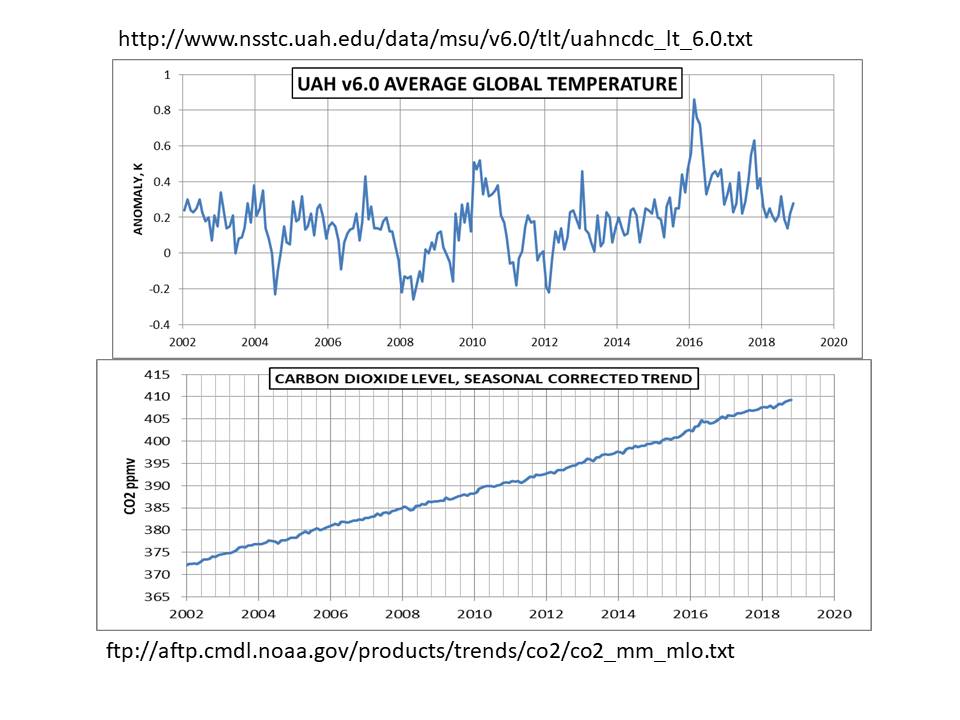
If CO2 had an effect then the specific heat of the air must have changed. I have seen no new value for it.
Anthony’s CO2 jar experiment proves it.
If CO2 actually affected climate then one would expect that the increase in CO2 over the past 30 years would have caused at least a measurable increase in the dry lapse rate in the troposphere but such has not happened.
“As usual, the mainstream media reports that 2018 is the sixth warmest year on record even before the year is over. This is not surprising or significant because the highest temperatures must occur at the end of a warming period.”
No media are quoted. And if any truly have essayed an early estimate, they would have said it would be the fourth warmest surface temperature on record, behind only 2015 (just), 2016 and 2017. And that surprisingly and significantly shows the falsity of the headline here:
“Recently Dropping Global Temperatures Demonstrate IPCC Claims are Impossible”
You know Nick when you have the time you might tell us all what the average temperature of the globe is supposed to be while you and the experts are dialing in that world CO2 thermostat of yours because living in Adelaide South Australia (Glenelg actually) I’m a wee bit confused by the daily forecasts for the greater metro area. A SEVEN degree Centigrade variation in forecast for today with the thermometers in the greater metro area between Mt Barker and Elizabeth is not a good look for your thermostat twiddling of the knob-
Adelaide 29
Elizabeth 31
Glenelg 28
Noarlunga 26
Mt Barker 24
Am I OK living in Glenelg or should I be moving somewhere else in the metro area where the CO2 thermostat is working properly?
http://www.bom.gov.au/sa/forecasts/adelaide.shtml
I’m in Adelaide too (Prospect), and I’m unsurprised by a 7 degree difference for the forecast high between Mt Barker and Elizabeth.
That said, Nick’s assertion about “fourth warmest on record” doesn’t falsify the headline at all, in fact it vindicates it; that is unless Nick is redefining fourth to be higher than first.
“doesn’t falsify the headline at all”
The headline doesn’t just say temperatures are dropping, which is hardly consistent with being the fourth warmest in the record. It says that proves that something about “IPCC claims” is impossible (which?). And there is no “IPCC claim” that says you can’t have a local peak year in an El Nino year. There has always been weather, and CO2 doesn’t change that – just makes it warmer weather.
But I don’t know what the complaint about Adelaide temperatures is. Is it querying forecast accuracy (so let’s see)? Or is it saying that CO2 will smooth out all local variation (no one said that)?
“There has always been weather, and CO2 doesn’t change that – just makes it warmer weather.”
Just as there’s been warmer weather due to the long interglaciation we’ve been enjoying with the concomitant rise of mankind. Answer the question. What should the average temperature of the globe be once you and the experts have deduced the dooming of the anthropogenic trace gas effect and will you have to then counter the warming due to the ongoing interglaciation because it’s higher than what your average temperature calculation says it should be?
Xth warmest on record is meaningless for a whole continent given the pitiful time span we have records for and even then the bozos at the BOM shifted one of the longest serving Stevenson Screens in the SH from the west parklands to their new offices east of the city at Kent Town in 1979 so it was more convenient to read-
http://joannenova.com.au/2014/01/forgotten-historic-hot-temperatures-recorded-with-detail-and-care-in-adelaide/
It’s like this chaps the CBD was largely being airconditioned at the time and the prevailing winds are from the west over the Gulf. Not that the west parklands site would be measuring the same temps today as it would 50 or 100 years ago with metro development and concomitant UHI but little did they know temps would be recorded automatically anyway after the shift. Now the BOM are busy reading another SS built at the old site to get a couple of years data so they can magically reconcile the two. As if…
Those temperatures, fourth warmest etc., share them please?
2015 was what °C, and so on?
http://woodfortrees.org/graph/hadcrut3vgl/from:1998/to:2019
So why do you plot an index that expired in 2014?
GISS numbers are here. HADCRUT here
No, you still haven’t supplied the figure for what the global average temperature was for the years you’re talking about.
Fourth warmest, third warmest, like, so what? It’s as nonsensical as describing the fourth reddest or whitest colour in a painting.
If you want to get people on side, dont direct them to a page full of digits when all you’ve been asked is what the global average temperature was.
So why the plot of the HadCRUT series that ended years ago? Did you not know that it had been updated?
It’s just that the site you used to make the plot also contains the up to date data series; the one endorsed by HadCRUT.
“Did you not know that it had been updated?”
Yes, we are all VERY aware it got “updated ™© ” 😉
So why not use their latest data?
If you’re suggesting that HadCRUT should be regarded as unreliable, then why use their previous data?
The comparison between Hadcrut3 (unadjusted) and Hadcrut4 (adjusted because unadjusted is not available) is interesting. Hadcrut 4 is a complete joke. But that was discussed here at WUWT years ago.
UAH is much more credible
Dee: “Those temperatures, fourth warmest etc., share them please?
2015 was what °C, and so on?”
Here you go, Dee (according to the UAH satellite data).
so the claim is now that they are not making claims about ‘warmest years ‘ , amazing !
it is opposite day?
Yessir, it’s all about the anomaLIES.
😉
Stokes,
You are correct that 2018 is on pace to be the 4th warmest. However, it really is a strawman argument because the essence of Ball’s complaint is “…the highest temperatures must occur at the end of a warming period.” and some minor record is not really surprising.
https://weather.com/news/climate/news/2018-10-17-earth-on-pace-fourth-warmest-year-on-record-noaa-nasa
An inquiring mind might ask why anyone felt a need to forecast any kind of a record three months before the year was over, other than for the political impact before the COP-24 meeting in early-December.
“the essence of Ball’s complaint is “…the highest temperatures must occur at the end of a warming period.””
Put the other way around, a highest temperature is very likely to be at the end of a warming period – that is just arithmetic. The argument that it is warming because of end of LIA or whatever is vacuous. What is the LIA? A period that was observed to be cooler than present. That is why we call it that. It is an observation, not a cause. The argument just says that it warmed because it was cooler before.
Yup, saying that warming is the result of ‘warming’ (from the LIA, or from whatever else) is arm-waving; an attempt to explain the observed warming away without describing any physical mechanisms.
DWR54
While it may be impossible to ascribe a physical mechanism to the LIA, we can be reasonably confident that humans weren’t responsible. If ‘agent X’ were to disappear, would it not be reasonable to expect the system to regress about the mean temperature that existed before ‘agent X’ reduced the temperature? That is, the temperatures are rebounding to what they were before being suppressed.
By what mechanism? That’s the question these ‘rebound from the LIA’ comments never address. We know it’s not orbital forcing; we know solar output has diminished slightly over the period of the most recent warming; we know that the oceans have been warming over the same period as the surface and atmosphere, so it’s not coming from the ocean…. so what exactly is causing this so-called ‘recovery from the LIA’?
DWR
If you get hit up the side of the head with a 2×4 plank, and never saw it coming, it doesn’t really matter whether you know what caused you to become unconscious. The reality is that it happened. We were long aware of the effects of ionizing radiation before we really understood what was happening. It is false to claim that something that we don’t know exists cannot have an impact. It only means that we don’t have a name for the mechanism and that we understand it so poorly that we can’t make reliable predictions. There is an old saying that “What you don’t know won’t hurt you.” It is demonstrably false. Things that you don’t know about can have important consequences. One should focus on learning about the unknowns, rather than trying to assign the results falsely to things we do know about.
And the Holocene Optimum, RWP and MWP were warmer than now, and ever warmer than the LIA
Current period could be called the “modern a-little-bit warm period.”
This “4th warmest” meme, in a piddlingly small period of dubious data manipulation, out of the coldest period in 10,000 years, is just basically NONSENSE.
Especially when much data still exists showing that the 1940s was a similar temperature, or a bit warmer, than current
Looks like 2018 will probably end up being the 6th or 7th warmest in the satellite data era.
So What !!!
Be very glad of that SLIGHT warming since the LIA.
fred250 December 29, 2018 at 4:29 pm
And the Holocene Optimum, RWP and MWP were warmer than now, and ever warmer than the LIA
——————-
I assume you have verifiable data for the RWP MWP and Holocene. I’m not sure the thermometers of the period were up to much!
ghalfrunt December 29, 2018 at 4:29 pm
With respect to the Holocene Climate Optimum: tree line in the Alpes was ~300 meter higher than now and for instance the pond turtle ( Emys orbicularis ) was found in South Scandinavia (present boundary: North of France), implying a summer temperature 2 degrees C higher than now.
Mr. Stokes said “The argument that it is warming because of end of LIA or whatever is vacuous.”
The LIA was anomalously cold, so saying that it is warming because temperatures are reverting to a more normal temperature is not a vacuous statement, but instead it is a statement that the warming is within the bounds of the natural variations in temperatures.
No, he’s asking what the mechanisms were/are.
Just saying that ‘it’s warmer now than it was earlier’ is not an explanation. That’s true whether we’re talking about the change of temperature from the LIA to the present or whether we’re talking about the temperature change we experience when we walk into one room from another.
What *caused* the change? Why is one state warmer than the other? There has to be a physical mechanism. ‘Recovery from the LIA’ does not describe a physical mechanism. It’s arm-waving.
DWR54 said: “…an attempt to explain the observed warming away without describing any physical mechanisms.”
The ‘physical mechanism’ is natural variation and since the current warming is well with natural variations in temperature, no other mechanism is required (see Occam’s razor)
the LIA is just a made up constraint…overall temps could be rising…or falling..right now
…no one knows
Mr. molineux said: “I hate to inform you but ‘natural variation’ is not a physical mechanism”
OK, I was a bit imprecise: Natural variation is the result of the climate system being “a coupled non-linear chaotic system” (See IPCC AR3). Since the current warming is well within the bounds of the natural variations in temperatures that have previously been produced by this chaotic system, the simplest explanation is that the current warming is being produced by this chaotic system and no other ‘physical mechanism’ is required.
The physical mechanism?
i don’t believe I am hearing that from a man who Believes in AGW!
How many do you want me to list?
The only physical mechanism that cannot account for the end of the LIA is CO2.
As for the rest – solar output, simple feedback delays in a chaotic non linear climate system, water vapour, cloud cover, cosmic rays, geological activity, a butterfly flapping its wings in a Brazilian rainforest…
i cannot really decide if I am envious of your simple minded innocence, or scared by it.
Mr. molineux said: “RicDre, radiative physics offers an even simpler explanation (GHG).”
I disagree, since the warming can be explained without the GHG theory, GHG theory is just an unneeded complication. And since the GHG theory can not explain why it was warmer when there were less GHGs in the atmosphere, it isn’t even a particularly good theory.
“No Ricdre, when you invoke natural variation’ all you are saying is that ‘we don’t know why.'”
Actually we do know why, the system is chaotic and chaotic systems can produce large swings in its values without requiring any additional mechanism (I suggest you read up on Chaos Theory).
“GHG fits the data much much better”
GHG theory can not explain the swings in temperature that have occurred in the past such as the Holocene Optimum, RWP, MWP or the LIA, but a chaotic system can produce these kinds of swings without requiring GHG theory.
“…scientists are saying…”
Sorry, argumentum ad verecundiam doesn’t impress me.
““when there were less GHGs in the atmosphere,” …. Pray tell us when was that?”
For example, in the 1930s there were less GHGs in the atmosphere and yet it was a very warm period.
DWR54 said:
“What *caused* the change? Why is one state warmer than the other? There has to be a physical mechanism. ‘Recovery from the LIA’ does not describe a physical mechanism. It’s arm-waving.”
Yeah, but they are waving their arms rather furiously. That must count for something! 😀
Mr. molineux said: “This is not chaotic:”
It looks pretty chaotic to me, it’s certainly not a nice, neat straight line. In any case, run that graph again, but this time include the last 10 thousand years and you will see real Chaos.
Mr. molineux said:
“However GHG explains the current rise in temperature very well, as there is no other recognizable forcing that would cause it”
You assume a forcing is required, but a chaotic system doesn’t require a forcing for its values to change so the GHG explanation is not required.
“I don’t buy your ‘natural variation’ explanation, since the correlation between CO2 and modern warming is undeniable”
Even if this is true, the correlation with CO2 and past warming periods is very poor and in any case correlation doesn’t prove causation.
Nature isn’t required to give us answers we like, and Chaos, for better or worse, puts limits on what we can know.
Mr. molineux:
Thank you for this interesting discussion. You gave me some things to think about and hopefully I did the same for you.
No, that is a rationalization, not an explanation. You are engaging in confirmation bias. You seek a reason that fits your preconception. Once a reason is found, however tenuous, you stop looking, shifting the onus onto other parties to prove you wrong.
The transition to the LIA took WAY less than 26,000 years. Try again.
Doesn’t work, Dickie. It bottomed out, then rose again long before increasing CO2 could have been responsible for the rise. The change was too rapid to be associated with Milankovitch cycles, and you are flailing.
It doesn’t work, Richard. The dip of the LIA is not due to Milankovitch cycles.
If you don’t know what caused the LIA, you don’t know enough to say what should have come after it.
Your rationalization doesn’t work. Your graphic with a larger time span doesn’t help. If you claim the dip is merely a continuation of a larger cycle, then you have to explain the 1000 year plateau prior that interrupted it. There is no end to the excuses and conjectures you have to make to patch it together.
Your complaint about Wikipedia shows you are desperate. Face it: you’re just spinning a yarn that coincides with what you want to believe.
“The first principle is that you must not fool yourself—and you are the easiest person to fool” – R. Feynmann
Also Bartemis, you have to consider the following data:
..
https://upload.wikimedia.org/wikipedia/commons/9/95/Lawdome75yrco2.svg
…
The LIA might be the synergistic combination of axial precession and the drop off in atmospheric CO2 between 1500 AD and 1600 AD
“Seriously Mr. Bartemis, apparently you do not know how the scientific method works.”
More desperation. I am done here.
Hey Nick Here is a question for you to answer .
What caused the Little Ice age and what caused the world to warm from 1680 ?
And while you are thinking about it here is a fact that not many people are aware of .
In 1540 high temperatures and widespread drought occurred in Europe and it was hotter and drier than the 2003 event when 35000 people died of heat stress .
I’m waiting .
I’ll respond when you provide some factual backing for your claims.
Mr. Stokes has now provided us with his self described formula for when claims must be responded to.
When they are “factual”.
Thank Nick!
Nick
The few years prior to and after 1540 are well known to have been exceptionally warm with considerable drought. I do have contemporary references and scientists such as Lamb wrote about them.
Here are some of the references I made in my article ‘The long Slow thaw’
1537 Good summer Baker
Good harvest according to Lamb-chmw- citing Hoskins wheat harvest survey
1538 Excessively hot summer, rivers dried up in summer Baker
1539 Excessively hot summer Baker
1540 Great heat and drought agc
Excessive drought rivers dried up ‘in other places (All over the country?) hottest and healthiest year in the memory of man (Short)
Summer exceedingly hot wof
Fine weather and heat Feb to Sept 19th mid harvest on June 25th grapes ripe in July, rain fell only six times exceedingly early spring cherries ripe by end may . Extreme drought at end of summer Baker
This year was remarkable for the abundance of corn and fruit Lowe
Very cold winter
1541 Dry and hot wof
Hot and dry. A remarkable drought (Nottinghamshire area) Baker
The river Thames so low that even at ebb, extended beyond London bridge
Lowe
1538-1541 These four years apparently experienced drought, with 1540 & 1541 particularly dry – in both these latter years, the Thames was so low that sea water extended above London Bridge, even at ebb tide in 1541. Three successive fine / warm summers from 1538-1540: the weather in 1540 was so fine that picking of cherries commenced before the end of May and grapes were ripe in July.
General warmth over Europe during the spring & summer of 1540. For England, there are several references to a hot summer, with great heat & drought; also many deaths due to the ‘Ague’. (The next warm summer of equal worth is possibly that of 2003!)
(also noted in usw via Holland .. ” 1540 is described in contemporary chronicles as the ‘Big Sun Year’; the lower part of the Rhine from Cologne into the Netherlands is ‘dry’ – it didn’t rain over Italy, with Rome dry for something like 9 months. Forest/city fires, with many people dying of heat stroke, heart failure etc.”)
1541: as indicated above, another drought year with rivers drying up (must have been quite extreme given that the previous year was notably dry). Cattle / other livestock dying for lack of water: dysentery killed thousands. Booty
Good harvest according to Lamb chmw, citing Hoskins wheat harvest survey
—– —-
You might also like to read the book ‘Climate and weather’ by John Kington who recently retired from CRU. I would tentatively say the three/five year period was the warmest in the last 500 years and was accompanied by damaging droughts
tonyb
The 1930’s were just as hot as today. Hotter than today when you consider only the US. Catastrophic Global warming would have to be truly global (except in deserts) since the CO2 is mixed everywhere. The reason why CAGW cant happen in deserts is because according to alarmist theory, the CO2 needs the extra water vapour to feed the runaway positive feedback. Since there is little or no water vapour in a desert, that can’t happen. Since there is always evaporation and evapo transpiration happening all the time, ~86 W/m^2, the question is at what level does it have to reach before runaway CAGW would happen? At the present time the latent heat that gets carried upward with evaporation is released before the atmosphere gets to 4% water vapour. The water vapour condenses to clouds or condenses directly. That latent heat that is released gets carried high into the atmosphere by convection. It doesnt get back to the surface or else we would have had CAGW already. Clouds are the cause of 85% of any DWIR. water vapour causes 13.5% and CO2 causes the remaining 1.5%. See my previous post higher up on this.
CAGW is an impossibility.
“The 1930’s were just as hot as today.”
Another “whack-a-mole” naysayers climate myth.
No the US was hot (though not as much as recently – yes even using unadjusted data).
Sorry to inform our US friends but the US is not the world.
Just 2 % of it by area.
Read Nick Stokes’ blog for why US temps were so useless for climate reanalysis back in the day when they red max thermos (and reset them) while it was still hot in the evening….
https://moyhu.blogspot.com/2014/05/the-necessity-of-tobs.html
Roy Spencer calculated (20 Dec)
Latest Global Temp. Anomaly (November ’18: +0.28°C) 2018 6th Warmest Year Globally of Last 40
How many times have the global warmists, sold all the silver told us the world is ending, run up a hill only to creep back down and say “oh we meant next year!”
Still there, alive and unforgotten, except by the IPCC, is Mother Nature. I am confident that this old lady will put the IPCC in the wrong and out of business.
if that were to happen then we would no longer have any spare money to give to the undeveloped countries.
============
The “spare money’ doesn’t exist. What is being proposed is that people already $ 100k in debt the moment they are born now borrow an extra $ 10k and give this to help people that are less than $ 10k in debt.
The oceans ate all my heat.
Speaking of oceans and heat, why haven’t Nature and the Resplandy and Scripps squad retracted or at least corrected their flawed and simultaneously rigorously peer reviewed paper wrongly claiming that the oceans have absorbed 60% more heat than was originally thought?
Next year maybe?
Thank you, Dr. Ball! Others who write for WUWT re-enforce this fraud in a number of ways. For instance, analyzing alarmist junk science as though they’re wrong rather than devious, which basically equates to critiquing the Emperor’s New Clothes. So I wonder: is it weak intellect, cowardice or complicity?
There is certainly some vindication, here. The Warming Alarmists have been trying to convince everyone that human CO2 is causing more warming. As most of us already know, climate changes in cycles, otherwise the 1970s scare of global cooling would’ve continued unabated. But this is actually bad news.
Global cooling in our current, ongoing Ice Age is not a good thing. And as cycles go, we’re slightly overdue for the next glacial period (ref: W.S. Broecker, 1998).
The upcoming experiment by Harvard and fellow psychopath, Bill Gates, should send chills up our spines. They want to cool the planet “like volcanoes do” (said Brennan, CFR, June 2016). Accelerating the cooling could mean permanent snow cover for Canada and Northern Europe within a lifetime. And all that extra white could accelerate the cooling even more.
You can bet that lawyers are drawing up the lawsuits even as we speak.
So they cool the atmosphere, and the next farmer or even whole industry that gets frozen out by unseasonable frost or hard freeze then sues the whole lot of them completely pantsless, shirtless, and naked.
End of that particular brand of jackassery.
An end? I hope. It would be nice to see Michael “Hockeystick” People lose his pants for the sheer hilarity from all the lawsuits he’s filing, except it’s likely someone with far deeper pockets is funding his legal forays.
Dr. Ball,
Why did you truncate your Central England Temperature chart at 1945. If you add the next 63 years, to 2018, you will see a pronounced increase.
Indeed, he was doubtless hoping that no-one would notice! He doesn’t reply to questions about his posts anyway.

Here’s the up-to-date version:
Phil
Speaking of which, I see that you didn’t respond to my response about your remarks about ozone depletion in the article from 5 days ago. I showed that O3 starts to decline in early-July, not August as you claimed.
Actually I have responded to it, your response was incorrect.
“Why did you truncate your Central England Temperature chart at 1945.”
DHR:
As I pointed out in my post above.
It is indeed a mystery why someone trying to debunk AGW omits the last ~75 years from his demonstration of that alleged point.
Could it be that it does not support it? (sarc).
Again ……
I expect it is just a stock graphic that he had handy. I have seen it in other places.
But, your up-to-date plot doesn’t really say much. In 1890, one could have been equally as convinced that the world was heading into a deep freeze as today one could be convinced of the opposite.
I expect it is just a stock graphic that he had handy. I have seen it in other places.
But it’s rather deceitful to say the following and to follow it with a graph of that quantity which terminates in 1945
“Then consider the Central England Temperature curve from 1659-2018. There is nothing extraordinary in the 359-year record when compared to the 68 years from 1950.”
“Nothing extraordinary” so he’s not going to show you it, you’ll have to take his word for it!
Tim,
What does NASA GISS or the CRU say as to the decadal rate of Ocean warming from the Argo buoys introduction in 2003/04?
I have read the several posts from Willis Eschenbach on the Argo buoys and he notes a trivially small warming of 0.03 degrees C per decade?
As 85%+ of the Earth’s warming comes from the Oceans, it seems rather important for this topic.
Herbert:
Try converting that “trivially small” warming into Joules…..
The SH of water is 4x that of air AND the oceans have 1000x the mass of the atmosphere.
Which means that ….
0.03C if applied to the atmosphere would result in a rise of 120C (in 10 years).
Of course it wouldn’t in the real world as the atmosphere is constantly losing heat to space.
Additionally the ocean accounts for 93% of the climate system’s heat content.
Which has been doing this …..
Anthony,
You are now talking about the Earth’s energy imbalance by some speculation as to what a 120C rise in the atmosphere (!) would convert to in terms of the Oceans, and then point to a Wikimedia graph.
I’ll pass on your graph.
“All of the accumulated warming of the climate system since the 1950s, including the deep oceans, was caused by a global energy imbalance of one part in 600; yet modern science does not know with a precision approaching 1 part in 100, ANY of the natural energy flows in and out of the climate system.
It is simply assumed that the tiny energy imbalance- and thus warming – was caused by humans.”( Source- Dr. Roy Spencer: “ Global Warming Skepticism for Busy People”.)
So increasing CO2 is involved in some of the recent warming but we really don’t know with any level of confidence how much of the recent warming has been caused by humans.
Moreover, even if the fraction of warming that is human caused is 100%, the rate of warming is hardly alarming as Tim Ball points out.
There is a large element of faith involved in claims of human causation.
“AGW has become the new religion of the environmental sciences.”
“in terms of the Oceans, and then point to a Wikimedia graph.
I’ll pass on your graph.”
The US Agovernment is closed.
So the source is currently unavailable.
So I’ll pass on your conspiracy ideation.
You could Google and you’d even find the like here on a WUWT opinion piece.
“So increasing CO2 is involved in some of the recent warming but we really don’t know with any level of confidence how much of the recent warming has been caused by humans.”
I beg to differ Herbert.
And so does the scintific community.
But on the other hand – if you say so.
Anthony,
My ‘ conspiracy ideation’ is a proposition advanced by Dr. Roy Spencer as I indicated in my source.Another ad hom.
If he is correct it should be obvious to you that the chart you reference must be suspect.
It is not a proposition unique to Dr.Spencer.
Dr.Judith Curry has repeatedly addressed the Uncertainty Monster,and given Congressional evidence on same.
I repeat: The estimates of accumulated energy in the climate system are so imprecise that modern science does not know with precision approaching 1 part in 100 ANY of the natural energy flows in and out of the climate system.
You can differ with me all you wish but the scintific ( sic) community is NOT in unison on this matter.
Here is James Lovelock, the Gaia author and scientist in The Guardian of 29 March 2010-
“ The great science centres around the world are more than well aware how weak their science is.If you talk to them privately they’re scared stiff of the fact that they don’t really know what the clouds and the aerosols are doing.They could be absolutely running the show.We haven’t got the physics worked out yet.”
And again ,” The problem is we don’t know what the climate is doing.We thought we knew 20 years ago.That led to some alarmist books-mine included – because it looked clear cut, but it hasn’t happened .The climate is doing its usual tricks. There’s nothing much really happening yet.We were supposed to be half way toward a frying world by now.Twelve years (now 20) is a reasonable time …..it ( the temperature ) has stayed almost constant, whereas it should have been rising- carbon dioxide is rising, no question about that.”
On the other hand if you and Al Gore and ALL the scientific community say to the contrary , well I guess I’ll have to think again……
The ocean temperatures are measured in degrees. The only reason they are converted into Joules is try make them is seem more scary. It’s a propaganda ploy.
BTW the ARGO buoys showed cooling until the data was adjusted to show warming. It’s kind of pointless anyway because they ARGO floats are free floating, so you can’t infer any trend in the data. It would like reading the temperature in Santa Monica, then driving to Las Vegas and reading it again, and claim it was warming.
AB
By what mechanism do you propose to heat the atmosphere 120 degrees with the cooler ocean water?
Making the observation that two things have equivalent energy does not mean that it is possible to exchange or even balance the two energy contents.
A rather important point. That old pesky 2nd Law.
After decades of excited anticipation for warmer weather in my region, every winter I am sadly disappointed that I still need to brave the cold. How much longer must I wait to get temperate weather??? I am aghast – my 15 year old potted citrus trees are in full bloom just begging to go outdoors right about now but I don’t dare. The IPCC liars promised me I would be guaranteed tropical weather by now…
“After decades of excited anticipation for warmer weather in my region, every winter I am sadly disappointed that I still need to brave the cold.”
If you live in Minnesota, you may receive some solace from the web site Minnesotans For Global Warming
http://www.m4gw.com/
Hey thanks, never thought that Minnesotans had this kind of brilliant humour.
They deserve a big hand.
Tim, I was disappointed to learn that you never read or comment on the responses to your work. It’s a bit elitist and school teacherish to just deliver a ‘lecture’ and take no interest in feedback. On this site, you miss out on getting an enriched education for yourself.
I’m sure people have pointed this out before, but have probably missed it in comments…someone should do a full post on it, but I lack the expertise…
In any case, this post reminds me yet again that “global warming” is predicated on the amplification of CO2 effects by water vapor, not just a little, but by a lot. Where is the study showing this drastic increase in absolute humidity? Shouldn’t 200 ppm CO2 increase water vapor by 800-1000 ppm globally?
If we can measure the tiny increase in ppm of CO2, surely we can measure the 4x-5x ppm increase in H2O?
Roland
VERY IMPORTANT INFORMATION. If true this means that sea level rise is meaningless.
https://platform.twitter.com/widgets.js
we have had so much snow in the north and south hemispheres in the past few years the glaciers have to be coming back, its not so much the climate evidence that worries me, its the social reaction to the theory of it. From manipulating the past to theorising about the future , tis the damning of anyone who stands against this and the thoughts of the majority or groups of influence who invent it as truth, that is the worry.
BTW , NASA says the ocean is rising at 2.5mm per year, this is actually immeasruable. The ocean is so fluid such a miniscule rise is nonsense. Go and stand by the sea and imagine it. Tides, storms , rising seabeds , volcanoes , heating and coooling, melting , floods, droughts, its absolute nonsense. Plain fearmongering. The El Nino trade-winds drives an ocean tide in Australia 60cms above normal levels, 60CMS !!! A 2.5mm rise is ridiculous, its a AGW lie.
For those that believe in the radiant greenhouse effect, what is most important is the total greenhouse gas concentration and the total radiant greenhouse effect. Both are so dominated by H2O that CO2 emissions are insignificant. They do not have any data that shows that mankind has caused total greenhouse gas concentrations and the total radiant greenhouse effect to increase. If CO2 really affected climate than one would expect that the increase in CO2 over the past 30 years would have caused at least a measurable increase in the dry lapse rate in the troposphere but that has not happened. We must also take note that the primary greenhouse gas, H2O is really a net coolant as evidenced by the fact that the wet lapse rate is significantly less than the dry lapse rate in the troposphere. In terms of trapping heat it is really the non-greenhouse gases that are more apt to retain heat energy than the so called greenhouse gases because the non-greenhouse gases are such poor LWIR radiators to space. Based on observations and atmospheric physics it is most likely that the AGW conjecture is false.
It gets tiresome reading all this stuff here and most other places that rely on their versions of radiative physics and statistical devices to produce hockey sticks as is well- proven, Nick.
What we do know, who have looked upwards, is that radiative physics can be and here are sidestepped by Equipartitition in Real Life eg Nature or Physics. That is to say, Atmospheres above 0.1bar allow convection and phase change to dominate because they follow the line of Entropy, LOTD, the best.
Think on this. Learn about Equipartition and equally important, about how Quantum Oscillators do not react to weaker forces and EMF is a Vector Force. Following the Net Energy Gradient ONLY. From real understanding comes the truly illuminating ability to picture and understand. Brett
You say that the human influence is impossible to pinpoint, but the isotopic composition of atmospheric CO2 is decreasing, which is consistent with fossil fuel burning…
What has isotopic composition of atmospheric CO2 to do with the balance of the carbon cycle?
Ah yes, “consistent with”. According to NOAA, δ13C of CO2 from vegetation is around -26 per mil and fossil fuel burning -28 per mil, with flux from oceans of around -9.5 per mil (source: https://www.esrl.noaa.gov/gmd/outreach/isotopes/c13tellsus.html).
The decreasing atmospheric δ13C is actually “consistent with” the incremental CO2 having a δ13C content of -13 per mil. Not exactly “consistent with” -28 per mil. Keeling plot for South Pole (intercept is average δ13C content of extra CO2) here:
Thanks, Jim. But couldn’t the -13ppt signal indicate a mixture of sources? The mere fact that the d13C in atmospheric CO2 decreases as fossil fuels are burned supports the notion that some of this CO2 is being mixed in the atmosphere.
Matheus, the answer to your question is yes, I agree. If you mix two sources of differing δ13C content, then the result will be a blend as it is simply the ratio of 13CO2 molecules to 12CO2 molecules. There are two “buts”, however. The first is that the AGW hypothesis is that ALL of the additional atmospheric CO2 is from fossil fuel burning and it is then necessary to invoke a major influx of 13C into the atmosphere through CO2 exchange with the oceans in order to match the observed δ13C trend (i.e. “low” δ13C CO2 is replaced by “high” δ13C CO2, but with no net change of CO2). See Figure 5 here: https://agupubs.onlinelibrary.wiley.com/doi/full/10.1029/2001GB001845. The black arrow reflects atmospheric growth with a gradient of -13 per mil, while the light blue arrow shows the “adjustment” necessary to increase 13C without changing the CO2 level.
The second “but” is the point that the “blend” must have remained in constant proportions in order to see a linear relationship on the Keeling plot. In fact, there is some evidence that the incremental CO2 has had an average δ13C content of -13 per mil ever since the start of the industrial revolution. A Keeling plot of the Law Dome ice core data gives an intercept of -13.1 per mil (Figure 1, http://www.biogeosciences.net/3/539/2006/bg-3-539-2006.pdf). Note that Figure 1 also shows Point Barrow observations (not ice core data) and get intercepts of -25 per mil (detrended) and -17 per mil (“original”). The detrended value reflects the annual cycle and is consistent with it being driven by vegetation. Their “original” value is unfortunately a mixture of the long term trend and the annual cycle and is meaningless. If you use the Point Barrow data after removal of the annual cycle (as published by Scripps), you get -13.2 per mil.
Further, if you accept the ice core data that indicates atmospheric CO2 was at 280 ppm with a δ13C of -6.4 per mil back in 1750 and current observations of 410 ppm and -8.5 respectively, the additional atmospheric CO2 of 130 ppm has had an average δ13C content of -13 per mil:
((410*(-8.5)-(280*(-6.4))/(410-280) = -13 per mil
Note that there is an extremely minor approximation in this relationship as it takes the CO2 level and combines it with the 13C/12C ratio (relative to a standard). Since 12C is 99% of CO2, this approximation is insignificant.
Very good explanation, thank you.
Sorry, messed up the blockquotes. My response to Dr Ball’s quote was –
By the same token temperatures rose by 1.08°C between February 2012 and February 2016. Why did no one mention a rise of over 1 degree in just 4 years? Probably because they knew that comparing individual months is meaningless.
Alan Tomalty makes some great posts here.
His postings about c02 heat capacity and the 15 micron photon being impossible to be absorbed by co2 in the first kilometre of atmosphere falsifies this statement.
”The Sun rises, and the temperature begins to increase as the solar angle increases. There is no increase in CO2, just as there is no decrease when temperatures begin to decline as the Sun sets.”
Because the optically active co2 above 1km reduces at night, by morning 70%+ of atmospheric co2 is in the first 1km of atmosphere.
It descends quickly as it cools, its the heaviest molecule.
So as the sun rises so does the bulk of co2, to temperatures and pressures where it becomes radiatively [optically] active.
I do ofcourse mean warming or cooling relative to surroundings and pressures,…
Because obviously has to physically warm as it descends, and physically cool as it ascends.
“Because the optically active co2 above 1km reduces at night, by morning 70%+ of atmospheric co2 is in the first 1km of atmosphere.
It descends quickly as it cools, its the heaviest molecule.”
News to me and I suspect, the scientific commumity.
Citation please.
If CO2 were in concentration, in say, a balloon, then it would fall under it’s own weight.
However in the atmosphere it is diffused among N2 O2 And a few other trance gasses.
Remember its concentration is only 0.04%.
Therefore CO2 molecules are constantly being jostled by molecules of these other dominant gases, and the Earth’s atmosphere is never completely still through its depth.
The Earth’s gravity is not significant against these forces on such a tiny mass.
Here is a CO2 concentration graph from various locations around the globe. You can even see the annual variation due to the winter/summer cycle in the NH (predominant source of CO2 via vegetation.
Indeed it is well-mixed to get down there quickly enough that that signal is not eroded.
https://www.esrl.noaa.gov/gmd/ccgg/trends/gl_trend.html
If diffusion were the only mixing agent in the atmosphere CO2 concentration would diminish with height, at 10 km CO2 concentration would be ~200 ppm. However, turbulent mixing dwarfs diffusion, the atmosphere is well mixed.
Gary Ashe December 30, 2018 at 5:09 am
Alan Tomalty makes some great posts here.
His postings about c02 heat capacity and the 15 micron photon being impossible to be absorbed by co2 in the first kilometre of atmosphere falsifies this statement.
”The Sun rises, and the temperature begins to increase as the solar angle increases. There is no increase in CO2, just as there is no decrease when temperatures begin to decline as the Sun sets.”
Because the optically active co2 above 1km reduces at night, by morning 70%+ of atmospheric co2 is in the first 1km of atmosphere.
It descends quickly as it cools, its the heaviest molecule.
So as the sun rises so does the bulk of co2, to temperatures and pressures where it becomes radiatively [optically] active.
What a load of garbage, but considering the source not surprising!
It is early and I am doing Sunday chores, but I assure you his (and his cohort of warmista jackass partners-in-trolling) inane Gish Gallop of nonsense and hogwash has been duly noted and will be taken to the mat, all in due time.
When one’s opponent is flailing wildly, sometimes it is best to just stand back and let him punch himself out.
Been mentioned and cited many times here, one of the posters was actively measuring and posting the levels above his test areas and crops.
Most plant stomata are on the underside of the leaf, except where the plants are fed from above, deserts etc.
Co2 that descends.
No a peer-reviewed paper please.
Here isn’t peer-reviewed science, tho I know denizens think it is.
My link above shows what you say to be incorrect.
It must be for those traces to show both the same trends both in the long and short term at the same concentration.
Peer review is a joke. Someone recently submitted a scientific paper, to half dozen major journals, based on Star Wars lore. IIRC four of them offered to publish the paper — for a fee of course.
Speaking of pay-for-play. Muller (the converted skeptic) when on a PR tour before his BEST paper was even published. It was finally published by an Indian internet journal — for a fee of course.
And then there are the Climategate emails that show the top scientists in this field conspired to corrupt the peer review process.
Peer review is not what you think it is.
Rather than being a “joke,” peer review is the quality control system of science.
600 to 700ppmv in the mornings, which reduced to 100 to 200ppmv by 11am,…..
As the crop hoovered it all up.
I remember it all, his regular graphs of real world interaction.
i just dont remember the exactness.
ps demanding i do your bidding will just get you your head verbally ripped off.
Have a nice day.
BTW, where did I post “all global variations” ?
Gistemp is adjusted data. LOL Pretty sure you know that.
The actual data (before adjustments) show that the 30’s dust bowl era was as hot or hotter than the present. Tony Heller has covered this topic extensively.
Along with MWP & RWP the information has been erased, Soviet Union style, so Chicken Little’s can claim the sky is falling.
Sure. Here you go:
https://stevengoddard.wordpress.com/data-tampering-at-ushcngiss/
“Show me the data for the “hot 1930’s””
Here’s the Hansen 1999 US surface temperature chart. Hansen said 1934 was 0.5C warmer than 1998. That makes 1934 0.4C warmer than “the hottest year evah!” 2016 (according to the UAH chart):
Let me anticipate your reply that this chart only covers the US. Well, I have more charts from all over the world and in both hemispheres which show the same temperature profile as Hansen 1999, i.e, the 1930’s are as warm or warmer than subsequent years.
What this means is the Earth is not experiencing unprecedented warming today. It was just as warm or warmer in the very recent past. No need to go back to the Medieval Warm Period. And what that means is the warmth of the 1930’s was caused by Mother Nature, not CO2, and the current warm could also be caused by Mother Nature because the temperature levels are practically the same for both periods of time, and we should assume Mother Nature is the cause until proven otherwise.
Reg, GISTEMP data is going to be the downfall of the entire AGW scam. Now that they have to start using the 1980-2010 baseline, how cold do you think the next 3 decades are going to look. if you take Nov figure of 0.77c against 1951-1980, and then use 1980-2010, the figure comes in at 0.34c, less than half.
Not forgetting, they are also increasing adjustments to temps after 1980. What could they possibly do to alter this massive problem once the AMO and PDO go cold, given they have adjusted upwards in the warm cycles? Once the cold cycles come, GISS will start showing massive cold numbers well under UAH. That is the ultimate definition of shooting a harpoon through ones foot I would have thought.
My woodfortrees graph shows GLOBAL temps.
Um, no it doesn’t There were no global temps in the 30’s. The majority of the data is from the US, Europe, and few other countries. Seventy percent of the world has no surface temperature data. This was true in the 30’s and is still true today.
The US data which comprises a large percentage of station data from the 30’s, and has been adjusted to make the past cooler.
Phil Jones admitted in the Climategate emails that much of SH data was simply made up.
Show me actual, untampered data showing the 30’s were cooler.