By Larry Kummer. From the Fabius Maximus website
Summary: 2017 has been a good year for news about climate change. Here is more good news, courtesy of the Dutch government. This should be headline news, but it ruins the narrative! Break the blackout and pass it on, for there is too little good news these days.
“Now this is not the end. It is not even the beginning of the end. But it is, perhaps, the end of the beginning.”
— Churchill’s speech on 10 November 1942, after the British victory at El Alamein.

“Trends in global CO2 and total greenhouse gas emissions.“
Since 2011 the global economy has grown while growth of CO2 emissions slowed.
By J.G.J. Olivier et al. of the PBL Netherlands Environmental Assessment Agency.
Excerpt from the Summary, 28 September 2017. Red emphasis added.
“In 2016, total global greenhouse gas (GHG) emissions continued to increase slowly by about 0.5% (±1%) ….Taking into account that 2016 was a leap year, and therefore 0.3% longer, and together with the 0.2% increase in 2015, the 2016 emission increase was the slowest since the early 1990s, except for global recession years. This is mainly the result of lower coal consumption from fuel switches to natural gas and increased renewable power generation; in particular, in wind and solar power.
“Most of the emissions (about 72%) consist of CO2, but methane (CH4), nitrous oxide (N2O) and fluorinated gases (F-gases) also make up substantial shares (19%, 6% and 3%, respectively). These percentages do not include net emissions from land use, land-use change and forestry (LULUCF), which are usually accounted for separately, because they show large interannual variations and are very uncertain. …
Figure 1 Click to enlarge.

“The trend in global CO2 emissions excluding those from LULUCF has remained more or less flat, over the last two years (±0.5%), see Figure 1. Non-CO2 greenhouse gases retained an annual growth rate of about 1%. In contrast, CO2 emissions from LULUCF show a highly varying pattern that reflects the periodically occurring strong El Niňo years, such as in 1997–1998 and 2015–2016 (Figure 1). …
“Over the past two years, total global greenhouse gas emissions (excluding those from LULUCF, thus also from forest and peat fires) have shown a slowdown in growth, …with calculated increases of 1.0%, 0.2% and 0.5%, in 2014, 2015 and 2016, respectively (see Figure 1). Note that 2016 was a leap year and, therefore, about 0.3% longer than a normal year. Since the early 1990s, such slow annual emission increases have only occurred during the economic crisis in 2008–2009, and the major global financial crisis in 1998 that resulted from the Asian financial crisis.
“Non-CO2 GHG emissions originate from many different sources and are much more uncertain than CO2 emissions (their uncertainty on a global level is of the order of 30% or more, whereas for CO2 this is about ±10% or less). Over the past three years, non-CO2 GHG emissions have continued to grow somewhat faster than CO2 emissions, namely by 1.5% (2014), 1.2% (2015) and 1.0% (2016), whereas CO2 over the same period increased by a respective 0.8%, -0.2% and 0.3%. Note that, due to limited statistical data for 2015 and 2016 for these sources, the annual trends in the emission of CH4, N2O and F-gases are much more uncertain than those in CO2. …
The declining growth in annual CO2 emissions since 2011 has continued over the past years, with 0.6% in 2012, 1.8% in 2013, and 0.8% in 2014, followed by -0.2% in 2015 and 0.3% in 2016 (±0.5%). …The energy intensity of the economy, defined as total primary energy use (TPES1) per unit of GDP, shows similar negative annual growth levels (i.e. annual energy efficiency improvement of the economy) compared to the pre-crisis period. From this can be deduced that …the economy as a whole has maintained its annually decreasing energy intensity. ”
The Agency will release the full report by the end of October. See their previous “Trends in Global CO2” reports.
—————————————–
Conclusions.
“The world may still be doomed, but it is not quite as doomed as the climatologists have repeatedly told us.”
— From “Global warming predictions may have been too gloomy” by Ben Webster (environment editor) in The Times.

The graph below shows the emissions of CO2 by industry and from burning fossil fuels. The lines represent the four scenarios — Representative Concentration Pathways (RCPs) — used in the IPCC’s AR5 report. The graph is from the RCP Database. RCP 3 (aka RCP 2.6) is the most optimistic, with negative emissions after 2020. The steep brown line is RCP 8.5, which describes a nightmarish future of rapid population growth and technological stagnation — with coal the fuel of the late 21 st century (as it was in the late 19thC). Click to enlarge.

Years of propaganda have convinced many people that the world is doomed, that RCP8.5 (with its unlikely assumptions) is the “business as usual scenario”, that we are certain to follow it unless massive public policy changes are made — even making drastic revisions to our economic system (as urged by Naomi Klein and Pope Francis). Activists have ignored science to convince the public that we’re doomed by climate change.
Events are already falsifying the narrative of climate activists, echoed by their journalist-enablers: new energy sources, improvement in energy efficiency, and substitution of natural gas for coal. These are trends already happening, yet still in their early stages. We might follow the red (RCP 6.0) and blue (RCP 4.5) lines until 2040. We can only guess what energy technology will be rolling out by then. We might be seeing steep declines in emissions, perhaps leading to negative emissions in the following decades (i.e., falling CO2 levels).
This does not mean that the world is saved. It does not mean that no public policy changes are needed to get us through the difficult decades ahead — as economic growth and population growth (perhaps to 10 billion people) puts immense stress on Earth’s ecology.
It does mean that the doomsters’ certainty is exaggerated, as is their belief we can only save the world by changing America society to suit their ideology. It means that we are on the right path, and that our normal economic and political processes are working.
Why we don’t hear more good news?
Two weeks ago, I wrote about a milestone for climate science: That to was ignored by climate activists and journalists. There are two reasons for this. First, they have committed to a “we’re doomed” narrative — trying to gain support by a relentless focus on the bad news about climate change plus forecasts of disasters. Good news to them is like Holy Water to vampires. Too bad that focusing on worst case climate scenarios should not work and does not work.
Second, journalists know we prefer bad stories. “If it bleeds, it leads.” This creates the “crisis crisis“, described in one of the best articles even in Playboy. People prefer exciting stories cheering our side’s angelic warriors — and hissing at our foes, Satan’s minions. Good news does not get big traffic. We love scary stories. The reason why reveals a secret about America.

For More Information
Other recent good news about climate: a successful 10-year forecast of global temperature. Also see “Emission budgets and pathways consistent with limiting warming to 1.5 °C“ by Richard J. Millar et al. in press at Nature Geoscience — reported here in the WaPo (the NYT ignored it). Progress of a different kind is the new policy requiring data publication for papers by the American Geophysical Union.
For more information about this vital issue see the posts about the RCPs, about the keys to understanding climate change and these posts about the politics of climate change…
- Good news! Coal bankruptcies point to a better future for our climate.
- Good news from America about climate change, leading the way to success.
- Good news for the New Year! Salon explains that the global climate emergency is over.
- Stratfor gives us good news: Red China Goes Green.
- Stratfor gives us good news, showing when renewables will replace fossil fuels.
- The IPCC gives us good news about climate change, but we don’t listen.
“This does not mean that the world is saved.”
Indeed. It was never in danger to begin with. The “crisis” was (and still is) a myth. CO2 is our friend, not the enemy.
A declining growth in 2% of the mis-named greenhouse effect, oh my. What news?
One factor in China and elsewhere is the adoption of more efficient coal power plant technology. Not only does this increase fuel efficiency, it also by definition reduces co2 per unit of electricity
That’s a negligible effect.
Better to shut down coal plant, like we have in the UK.
We haven’t missed it.
Not yet, oh brainless twerp.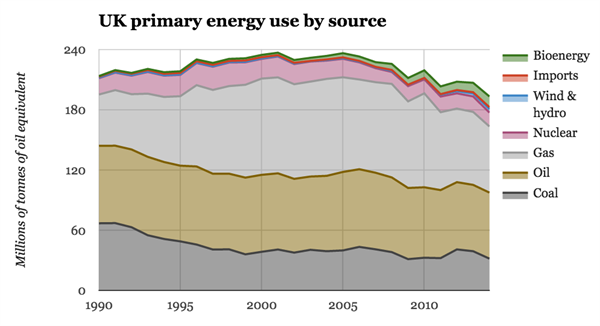
That is because coal gas and oil and nuclear still account for some 90% of your power usage
Gees, I’m having great difficulty seeing wind on that graph, even when its added in with hydro.
Can anyone see solar ???
And Bioenergy…. .. how much of that is woodchips freighted in from the destruction of American forests?
Andy
I think your graph may prove another point as well, small increases in non fossil fuel electrical power production has a disproportionate decreasing effect on electrical usage by the method of economic destruction caused by ridiculously higher energy costs.
That looks like your economy is contracting, if that continues you can meet your Paris pledge without doing a dam thing. Unfortunately your number of unemployed generally have an inverse relationship to that graph.
“We haven’t missed it.”
Oh yes we have, well at least those of us who have the wit to know exactly what the idiots that infest Westminster have done to our economy (and us) with expensive Nuclear energy and whirligigs that only work when the wind blows, not to soft and not to hard but just right and the solar farms that produce nothing on those long hard cold winter nights. Contrast that to 1900 with when our economy was driven by steam and powered by coal and we were the richest most powerful country on the planet. (The direction China is going in now and for the same reason.)
Not everyone in the UK is an idiot.
So our emission have been growing since the beging of the industrial revolution.
The atmospheric increase in Co2 has been roughly half the amount we have been emitting, Sinks are growing along with our emissions.
Now our emissions are flat or falling. What does that mean for CO2 concentrations in the atmosphere? Decreasing emissions, increasing sinks (greening planet) correct? That means decreasing CO2 concentrations right?
Unless these figures are all made up OR The increasing CO2 concentrations have NOTHING to do with our emissions!
CO2 concentration increase lag Temperature increase ALWAYS!
Check your Mauna Loa numbers freinds and we will see, Just another nail in the coffin for CAGW.
This is the way forward if we want to stabilize CO2 levels. The first part is to stabilize emissions, which appears to have happened over the last three years (10 years ahead this scenario below). Then we wait for the net natural absorption rate to catch up in several decades and CO2 is stabilized.
If you look at the last several months of Mauna Loa CO2 numbers (now that the impact of the El Nino on these numbers has faded), the net natural absorption rate is about 6.0 GTs Carbon annualized right now (2.8 ppm CO2). This is the HIGHEST number ever and would be quite-a-way along the blue line below of net natural absorption catches up towards the goal of stablized CO2.
“The first part is to stabilize emissions, ”
Only a klimate kool-aide quaffer would think that stabilising CO2 to 530ppm would be a good idea.
Still way too low.
I see a time when people have woken up to the fact that the world needs MORE CO2, not less..
and when nuclear or other power is used to release CO2 from carbonate rocks to provide CO2 for plant growth.
Bill
I think you missed my point completely.
Bob Broder
“CO2 concentration increase lag Temperature increase ALWAYS!”
This is accurate, but the amount of CO2 change to temperature is a low number. 15 ppm per 1.0C. So, its becomes too small of an impact to influence the end outcome.
But if you look at the period in my chart above before 1950, you will find that the natural change in CO2, (blue line) was much bigger than our emissions (yellow) and was responsible for the CO2 change prior to 1950.
Bill
“This is accurate, but the amount of CO2 change to temperature is a low number. 15 ppm per 1.0C. So, its becomes too small of an impact to influence the end outcome.”
So sayith you, lets see what the station at Mauna Loa says as our emissions “stabilize”, my guess is like every other point made about CO2 concentrations by the Cult of AGW it will prove to be nonsense, just like the C13/C14 ratio BS. My prediction, CO2 will track Temperature no matter what our emissions are.
I’ve noticed that Editor to FM always includes at the end of every article a list of links to his website that are unrelated to the article. I hope WUWT is getting paid for that advertisement.
Not to mention the numerous links in his articles to his website.
I Came,
(1) The posts on the FM website are chapters in larger news stories. Each builds on the others. To keep each of reasonable length, rather than cite evidence in each post I link to a post discussing that topic in more depth.
(2) Which of the links at the end are “unrelated” to this post?
I almost get the feeling that the primary objective for posting here is to direct people to his website, and not the actual subject of the article. Like this one. A bunch of words that don’t really say much (this seems to be the norm, not an exception), but they do provide the opportunity for many links to his website.
I Came,
“I get the feeling that the primary objective for posting here is to direct people to his website”
For the FM website YTD — 25% of traffic comes from search engines (mostly the Great God Google), 6% from social media (3% each from FB and Twitter), and 5% from referrers (like WUWT). WUWT is 0.2% (#8 among referrers).
Facts are your friend. Get to know them. They’re a better guide than your “feelings.”
My experience (facts) informs my feelings (intuition).
Just like general Fabius Maximus understood, every little bit, no matter how small, adds up to help the cause.
Excerpted from published commentary:
OH MY MY, ….. the above calculated, … estimated, ….. guesstimated …… reductions in annual anthropogenic CO2 emissions makes NO SENSE whatsoever ……. simply because said annual “decline” is contrary to the actual factual recorded annual “increase” in atmospheric CO2 ppm, to wit:
CO2 “Max” ppm Fiscal Year – mid-May to mid-May
year mth “Max” _ yearly increase ____ mth “Min” ppm
2010 _ 5 _ 393.04 …. +2.85 El Niño __ 9 … 386.83
2011 _ 5 _ 394.21 …. +1.17 La Nina _ 10 … 388.96
2012 _ 5 _ 396.78 …. +2.58 _________ 10 … 391.01
2013 _ 5 _ 399.76 …. +2.98 __________ 9 … 393.51
2014 _ 5 _ 401.88 …. +2.12 __________ 9 … 395.35
2015 _ 5 _ 403.94 …. +2.06 __________ 9 … 397.63
2016 _ 5 _ 407.70 …. +3.76 El Niño __ 9 … 401.03
2017 _ 5 _ 409.65 …. +1.95
Source: ftp://aftp.cmdl.noaa.gov/products/trends/co2/co2_mm_mlo.txt
Always thought CO2 was over hyped and not all its cracked up to be, except as a vital life force and essential plant cell building component through photosynthesis of course.
Assuming that the CO2 concentrations quoted by Samuel C Cogar are correct, CO2 concentrations increased by (409.65 – 393.04) / 7 = 2.37 ppm per year.
From the sum of the blue areas (CO2) in Figure 1 of Larry Kummer’s article, CO2 emissions in 2016 were about 36 gigatonnes (3.6 * 10^13 kg). Since CO2 has a molecular weight of 44, this is equivalent to 8.2 * 10^11 kg-moles/year of CO2.
The total weight of the atmosphere can be estimated by multiplying sea level pressure (about 101,300 Pa) by the surface area of the earth (5.1 * 10^14 m2), and dividing by the acceleration of gravity results in a mass of about 5.27 * 10^18 kg. Using an average molecular weight of 28.9 results in about 1.82 * 10^17 kg-moles of atmosphere.
If all the 8.2 * 10^11 kg-moles/yr of CO2 emissions in 2016 remained in the atmosphere, diluted in 1.82 * 10^17 kgmoles of atmosphere, the CO2 concentration would increase by 4.49 ppm per year. But the actual average concentration increase over the past 7 years was only 2.37 ppm/year, or only 53% of the emission rate.
This means that 47% of the CO2 emissions, or about 17 gigatonnes/year, were removed from the atmosphere by natural forces (photosynthesis, absorption by the oceans, formation of carbonates in mollusk shells, etc.).
Hundreds of experiments have shown that increasing the CO2 concentration in the atmosphere speeds up plant growth and increases crop yields (which is why florists deliberately emit CO2 into their greenhouses to get more flowers for Valentine’s Day in mid-winter). A significant part of those 17 gigatonnes/year of CO2 has gone to increasing the food supply for all life on earth, including people.
If the CO2 absorption rate by natural processes was proportional to CO2 concentration, as the CO2 concentration in the atmosphere continues to increase, the absorption rate would catch up to the emission rate, and CO2 concentrations would stabilize at an equilibrium. If the emission rates remained at current levels, this equilibrium would be reached at a concentration of about 405 / 0.47 = 862 ppm, or slightly more than double today’s concentration.
The actual temperature rise over the past 19 years (since 1998) has been much less than that predicted by climate models, so that temperature rise forecasts for the future need to be revised sharply downward. But at the equilibrium point, all life on earth would benefit from an increased food supply.
A very green future, indeed!
steve zell wrote
“Hundreds of experiments have shown that increasing the CO2 concentration in the atmosphere speeds up plant growth and increases crop yields….”
and higher temperatures counter
the higher yields expected
from co2 fertilization alone.
also, please read
“The Great Nutrient Collapse,” last
month in Politico.
Reblogged this on Climate Collections and commented:
The article is unworthy of reblogging, but the comment thread is excellent. Here’s a gem:
Allan MacRae
October 4, 2017 at 12:58 am
I agree Robertv – see #4 below.
“4. CO2 is the feedstock for carbon-based life on Earth, and Earth’s atmosphere and oceans are clearly CO2-deficient. CO2 abatement and sequestration schemes are nonsense.”
Fossil fuels comprise about 85% of global primary energy, whereas green energy provides less than 2%, despite trillions of dollars in squandered subsidies. Imagine how much better the world’s poor would be if these vast sums had been spent intelligently on clean water, sanitation and efficient energy systems.
Cheap, abundant reliable energy is the lifeblood of society – it IS that simple. When politicians fool with energy policy, real people suffer and die. That is the tragic legacy of global warming alarmism.
Regards, Allan
https://wattsupwiththat.com/2017/09/07/the-making-of-a-climate-skeptic-at-university/#comment-2603130
Reference:
https://wattsupwiththat.com/2015/06/13/presentation-of-evidence-suggesting-temperature-drives-atmospheric-co2-more-than-co2-drives-temperature/
Observations and Conclusions:
1. Temperature, among other factors, drives atmospheric CO2 much more than CO2 drives temperature. The rate of change dCO2/dt is closely correlated with temperature and thus atmospheric CO2 LAGS temperature by ~9 months in the modern data record. [published on icecap.us in January 2008]
2. CO2 also lags temperature by ~~800 years in the ice core record, on a longer time scale.
3. Atmospheric CO2 lags temperature at all measured time scales.
4. CO2 is the feedstock for carbon-based life on Earth, and Earth’s atmosphere and oceans are clearly CO2-deficient. CO2 abatement and sequestration schemes are nonsense.
5. Based on the evidence, Earth’s climate is insensitive to increased atmospheric CO2 – there is no global warming crisis.
6. Recent global warming was natural and irregularly cyclical – the next climate phase following the ~20 year pause will probably be global cooling, starting by ~2020 or sooner.
7. Adaptation is clearly the best approach to deal with the moderate global warming and cooling experienced in recent centuries.
8. Cool and cold weather kills many more people than warm or hot weather, even in warm climates. There are about 100,000 Excess Winter Deaths every year in the USA and about 10,000 in Canada.
9. Green energy schemes have needlessly driven up energy costs, reduced electrical grid reliability and contributed to increased winter mortality, which especially targets the elderly and the poor.
10. Cheap, abundant, reliable energy is the lifeblood of modern society. When politicians fool with energy systems, real people suffer and die. That is the tragic legacy of false global warming alarmism.
Allan MacRae, P.Eng. Calgary, June 12, 2015
The Dutch government is notoriously known for lying, so don’t count on this to be the truth.
John from Europe,
Don’t throw stones if you live in a glass house. Pretty much all governments lie, because they’re made of people — and lies work. See The Big List of Lies by the US government.
But the Dutch government-funded research institutes have a excellent reputation. The CPB’s economic numbers are among the best, such as their monthly World Trade Monitor.
I like the way the Dutch government funded the Climate Dialogue site (for a while).
Roger,
I agree. Climate Dialog had a lot of good content, the kind of material we need more of.
does this mean that I will actually have to move to Florida when I retire to get a warmer climate?
There is a recent paper suggesting that save for ENSO temperatures have essentially paused since 2000.
It suggests that recent fluctuations in temperature are simply natural variation.
Of course, about 30% of all manmade CO2 emissions have taken place since 2000 so that suggests that Climate Sensitivity to CO2 (if any at all) is very small indeed. See: http://www.iieta.org/sites/default/files/Journals/IJHT/35.Sp01_03.pdf
Richard,
How did you find that paper? The International Journal of Heat and Technology is quite an obscure journal.
But the observation that the pause ended with an El Nino seems reasonable, even to a layperson. It’s consistent with the “stair step” pattern of temperature increases — somewhat linked to ENSO — as described in “Reconciling the signal and noise of atmospheric warming on decadal timescales“, Roger N. Jones and James H. Ricketts, Earth System Dynamics, 8 (1), 2017 — ” a store-and-release mechanism {of heat} from the ocean to the atmosphere is proposed.”
If correct, we will see another plateau (pause, hiatus) for several years — then another stair step up.
Time provides the test for theories, and the basis on which to build better ones.
“…a store-and-release mechanism {of heat} from the ocean to the atmosphere is proposed.”
And what would this have to do with atmospheric CO2? This ‘mechanism’ is more evidence that CO2 is not a primary driver of climate change, much less THE driver of climate change. There is no physical mechanism for the energy from a CO2 molecule in the atmosphere to be transferred into the oceans without warming the atmosphere. We had 15 years of no atmospheric warming, then a very strong El Nino releases heat into the Atmosphere. It is impossible for that El Nino atmospheric warming to be associated with increasing CO2 over the previous 15 years.
If I claimed to be able to burn wood in my wood stove through the summer without it giving off any heat, but that the heat would mysteriously rise out of the floor the next winter, I would appropriately be dismissed as a nut-job by anyone with a brain in their head. Yet this is exactly what we are told is happening to defend an AGW theory that is clearly not working, and even renowned scientists are considering the possibility of this magical heat transfer.
I guess that is just how far we will go to defend our irrational beliefs.
JClarke,
“And what would this have to do with atmospheric CO2?”
Answers to a question about a paper are found by reading the paper. Here is the author’s statement about the point of the paper.
Sorry Larry, but that doesn’t answer the question. It makes my point.
“…between the time when HEAT IS TRAPPED IN THE ATMOSPHERE AND WHEN IT IS MEASURED AS A CHANGE IN TEMPERATURE THERE IS A GAP IN UNDERSTANDING…”
Well, duh!
That is the same as saying: “Between the time we throw the virgin in the volcano and the length of time the volcano does not erupt, there is a gap in understanding.”
There can be no understanding of the relationship between sacrificial virgins and delays in volcano eruptions because there isn’t a relationship. Likewise, there can be no understanding of how CO2 is responsible for the stair step warming of the atmosphere, because it obviously isn’t. Wishing that it were, does not make it so.
Can you name anywhere else in the Universe where additional trapped heat in a medium does not result in a change in temperature of that medium? No. You can’t. It’s oxymoronic, with emphasis on the last 3 syllables. Now it is possible that the change in temperature may be so small that it cannot be measured, which falsifies the prevailing theory, supports the skeptical view and makes carbon mitigation an evil act. With carbon mitigation we aren’t just killing a virgin every once and a while, we are killing whole populations of the poorest among us.
jclarke341,
They gave their explanation. That you don’t agree with the answer doesn’t mean it isn’t an answer.
” Likewise, there can be no understanding of how CO2 is responsible for the stair step warming of the atmosphere, because it obviously isn’t.”
How sad that few or no climate scientists agree with you. Consider it an opportunity. Write up your paper on this. Perhaps a Nobel lies in your future. Until then, please excuse most of us if we prefer to listen to climate scientists. Like Dr. Curry and Pielke Sr. , for example, instead of you.
BTW, could someone translate the following into English:
“Application of a theoretical-mechanistic process starts with well-agreed theoretical positions (core theory) and then builds on those theories to explore alternative mechanisms required to support competing hypotheses. The exploration of plausible mechanisms produces probative criteria for severe testing.”
I take it to mean “We are starting with the belief that our core theory is true, then we are going to torture the known laws of the universe until they prove that our theory is true.”
“They gave their explanation. That you don’t agree with the answer doesn’t mean it isn’t an answer.”
Honestly Larry, “we don’t have a clue” is not an answer. It is a reply, but it doesn’t answer the question in the slightest. I agree entirely with their reply. They do not have a clue. At least the high priests had a story that throwing a virgin into a mountain made the mountain ‘happy’ and delayed its wrath. It even makes a twisted sort of sense, since they thought the mountain was male, and males generally like to have virgins thrown at them.
AGW supporters don’t even have that. All they have is a bad case of cognitive dissonance. They believe their theory is correct, and they know that you cannot trap additional heat in a medium and not have the temperature of the medium rise, unless the temperature rise is too small to measure, or something more substantial offsets the temperature rise. One of these positions negates the other. I am betting on the laws of physics over the current AGW theory. Observations clearly show that CO2 is not the primary driver of global temperature.
Appealing to authority is not a logical argument, doubly so when you throw in Curry and Pielke Sr., who are pretty clear that the current AGW theory needs a significant overhaul, just like I do.
All any supporter of the current theory needs to demonstrate is how CO2 traps ‘heat’ in the atmosphere without increasing the ‘temperature’ of the atmosphere, but increases the temperature of the ocean instead, and I will rewrite the laws of Physics and Thermodynamics myself! I, on the other hand, don’t need to prove or demonstrate anything. I am not the one demanding people need to change their behaviour to comply with my belief. Even though I have no responsibility to prove anything, I do enjoy pointing out how the atmosphere keeps confirming the skeptical point of view.
“…doubly so when you throw in Curry and Pielke Sr., who are pretty clear that the current AGW theory needs a significant overhaul, just like I do.”
After I posted my comment, I realized that my words suggested that I personally need a significant overhaul. While this is fundamentally true, I was trying to convey that I largely agree with Pielke Sr. and Curry.
More reason to expect next step will be down rather than up.
Increased CO2 has had practically no effect at all, ie it is undetectable. For 32 years after 1945, the world cooled dramatically, despite rising CO2. Then after the PDO flip of 1977, earth warmed slightly for about 20 years. In this century, it has stayed flat or, allowing for El Ninos, cooled slightly. Again all during rising CO2.
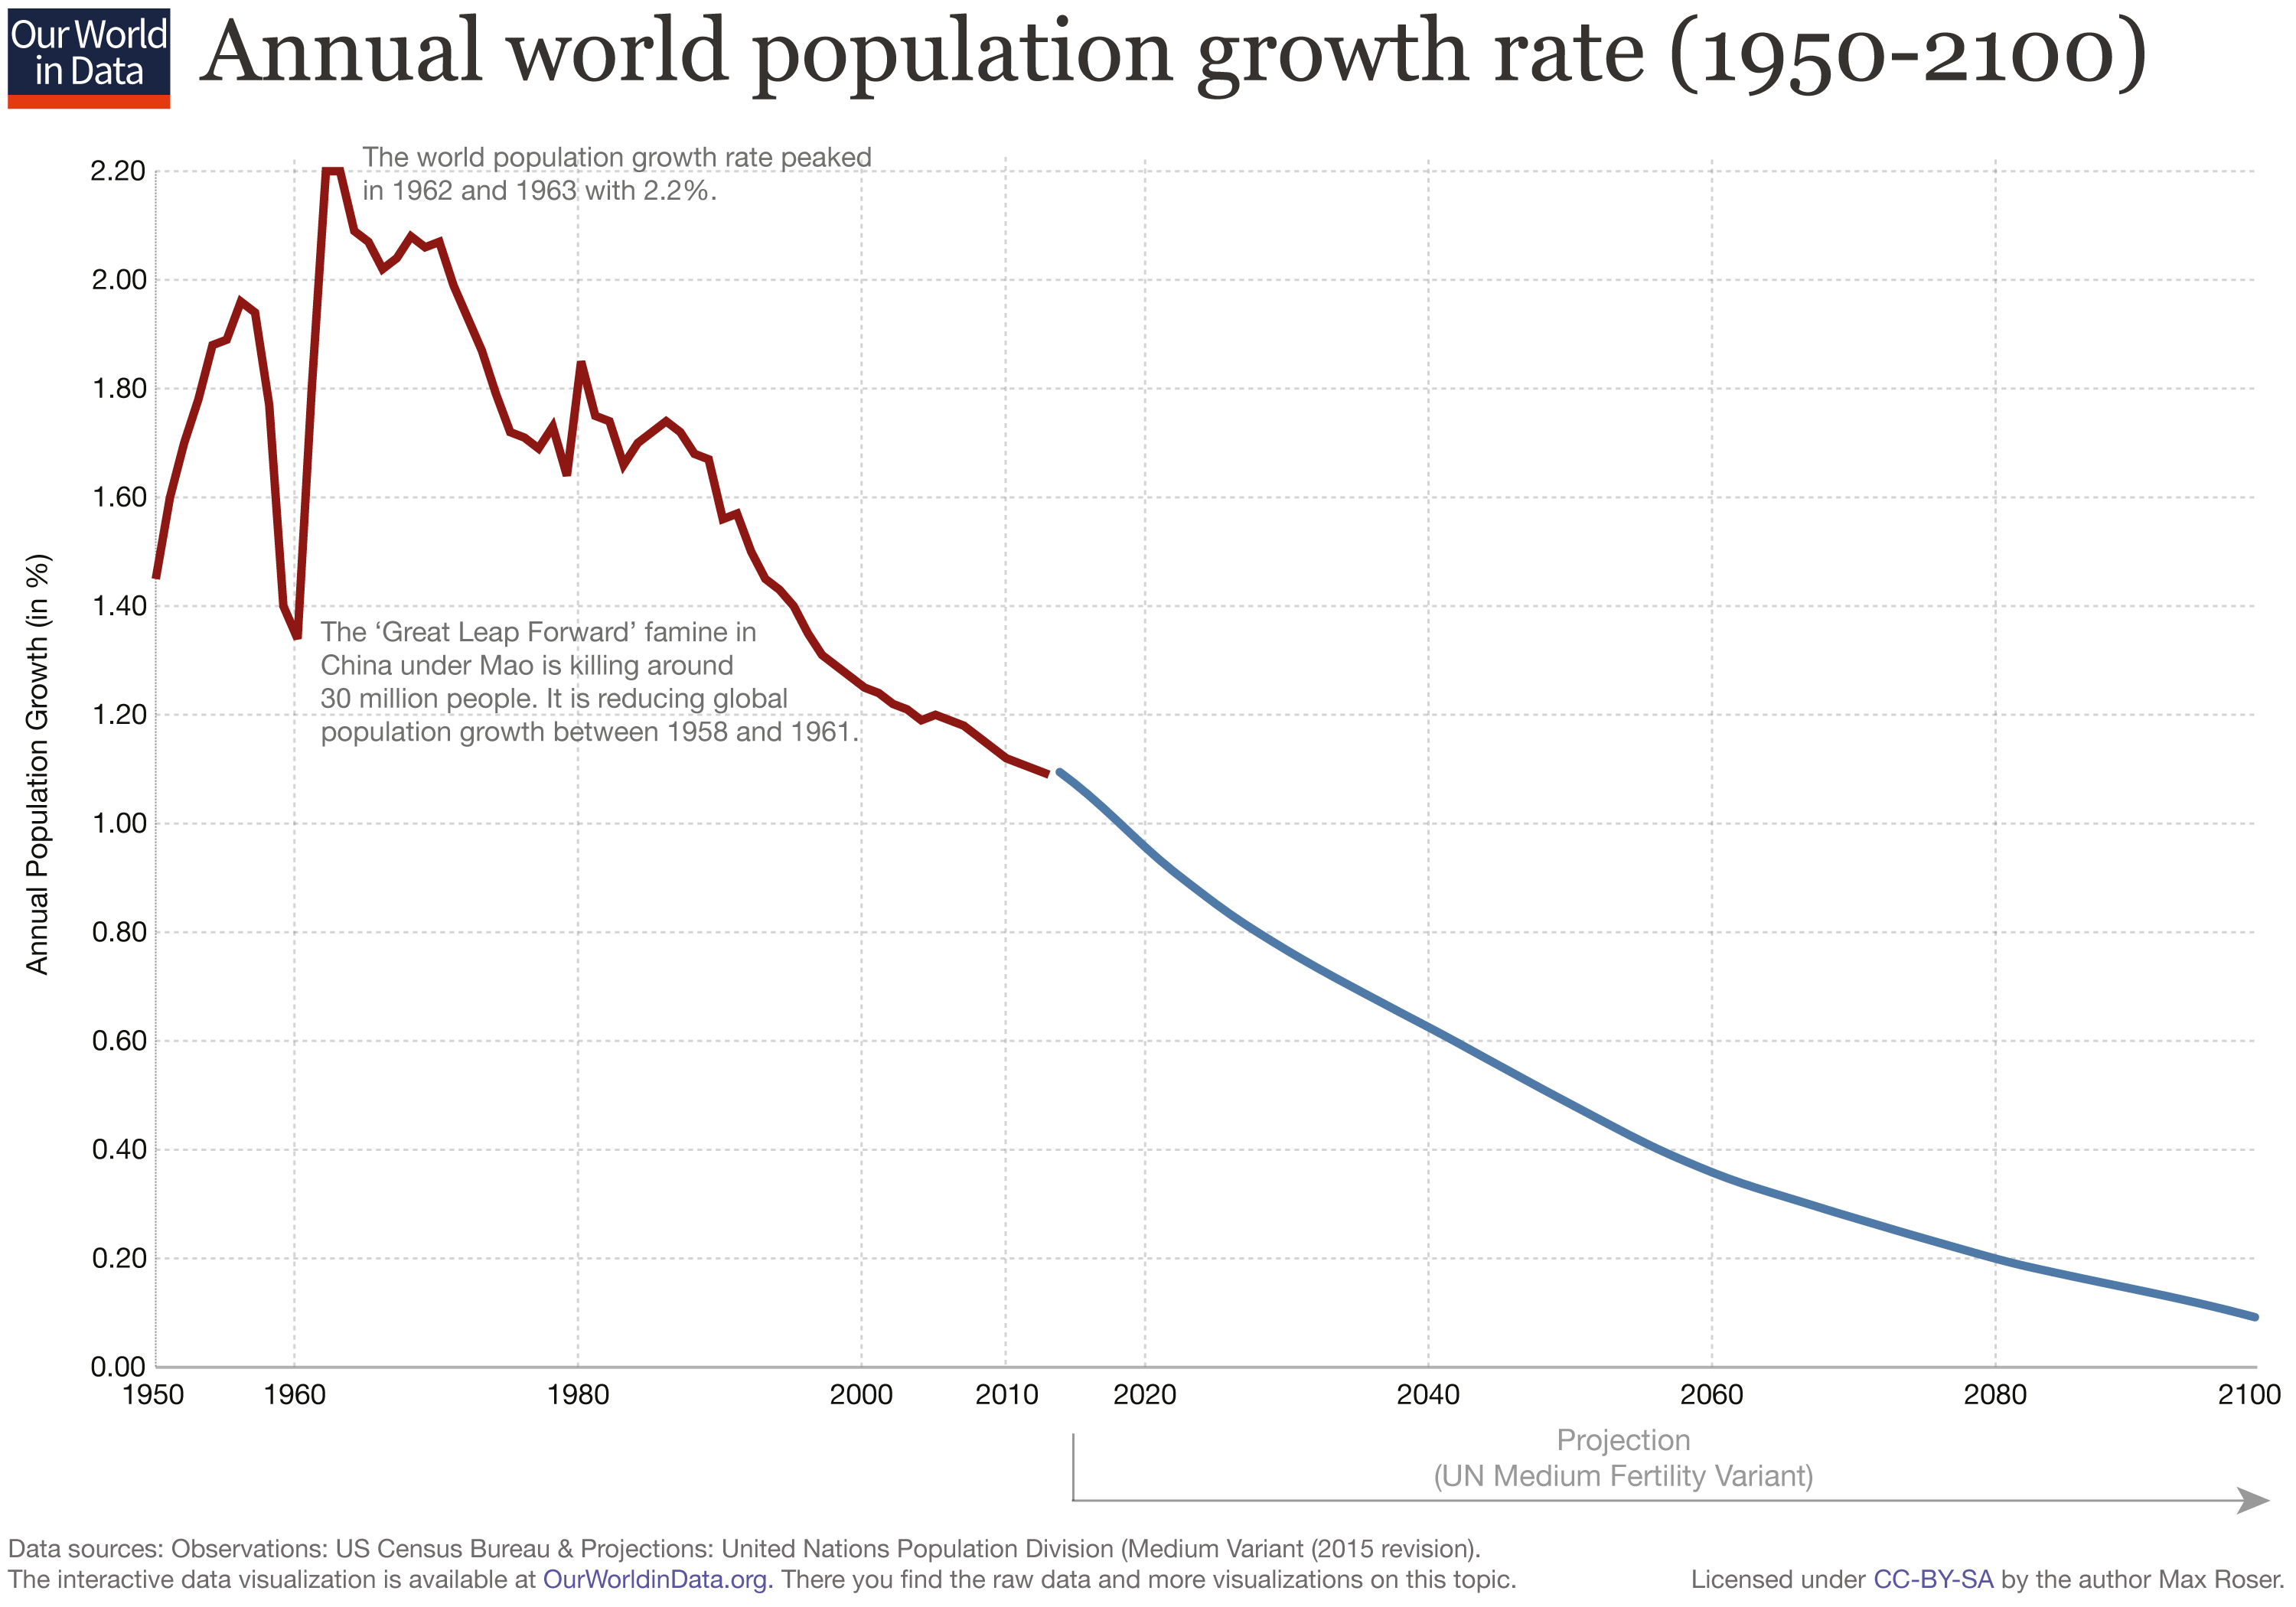
Come back to Earth’s surface Larry. There has been enough societal scale human experiments to conclude Malthusian ideas run into conflict with human rights. The mankind is doing fine without yet another experiment. The birth rate is in steady decline and population growth rate remains positive mostly due to increasing life-expectancy:
jaakkokateenkorva,
(1) What is the point of that graph? Do you believe that demographers making global population forecasts don’t know that trend?
(2) “Malthusian ideas”
First, the idea that increased population density causes environmental stress is a fact — not a ” “Malthusian idea.” Second, there is no guarantee that a second and third “green revolution” will come just because we need it. Scientific progress cannot be assumed to come when and how we need it.
The UN birthrate projections rest on unfounded assumptions. See Chapter 1 of Gaia’s Limits. Even if they are correct, there will be regional food (soft constraint) and global liquid fuels (hard constraint) limits by 2050 that guarantee population limits at something like 9.2-9.5 billion.
The unfounded assumptions are all in the direction of more population growth.
Such things like an assumption that birth rates will stop declining when they hit 2.0. Of the dozens of countries that have reached that level, not a single one stopped there.
An assumption that over the next few decades countries that are below replacement level will return to replacement level. Once again, has never happened.
Population levels will peak long before 2050 and then start dropping rapidly.
Even if it didn’t, If we farmed all available land in the world up the US/Canadian standards, we could grow enough food for 20 billion.
ristvan,
“Even if they are correct, there will be regional food (soft constraint) and global liquid fuels (hard constraint) limits by 2050 that guarantee population limits at something like 9.2-9.5 billion.”
Wow. There is at least one peak oil believer left in the world! Who knew?
More seriously, people have been singing that “resources constraint” tune since Thomas Robert Malthus wrote it up in 1803. It might prove correct this time, but history suggests that your statement of it as a certainty is over-confident.
I somewhat arbitrarily used 10 billion as a max population, the low end of the current UN probabilistic forecast’s 95% confidence range of 10-12 billion.
12 billion seems way too high, in my layman’s opinion. I can easily imagine Africa’s fertility falling more than expected, so the world peaks at ~9B. But all of these numbers mean serious hard times for regions with big population numbers and poor management. Africa and the Indian sub-continent seem esp vulnerable. Lots more environmental damage likely there. And given how many kinds of pollution spread, it will affect the rest of us also (somewhat).
For more details about the UN’s forcecast: The facts behind the scary new UN population forecast & those doomster headlines.
This stress to the environment caused by population exists entirely in Larry’s mind.
Mark W.,
“This stress to the environment caused by population exists entirely in Larry’s mind.”
Wow. Look at sub-sahara Africa and see the damage. Lots of articles about that.
Much more to come, if some forecasts are correct — since that is where much of the world’s population growth is coming (i.e., fertility is falling there more slowly than at similar points in economic development process of other regions).
Doesn’t this article inherently accept then that CO2 emissions are bad?
Natural emission rates are about 20 times fossil fuel burning emission rates and those rates have been increasing for decades.
Climate activists, Greens, and climate doomsters have their own ‘brutally honest’ website for environmental news! Because they’re not already delusional enough. The editor plans to “uplift voices”!
Read the interview with her. It’s fun, in a sad way.
https://www.cjr.org/innovations/climate-change-news-earther.php
I agree with Hans-Georg at 5.:45, that any purported reduction depends on what the PRC has decided to state as its emisssions this week, and if that chap retires or moves to a different job, there goes the “reduction”.
The slowing economy in China likely played a major factor as well.
Of course renewables don’t actually reduce CO2 emissions, but we do have to maintain the narrative after all.
Most of us assume, because some of his posts appear at WUWT, that Larry is a skeptic, or somewhere between a skeptic and a lukewarmer. On the basis of this and his last post, he seems to be an ex-skeptic, well on the way to becoming a flat-out warmist who accepts that CO2 and only CO2 controls the climate and that all CO2 is bad, etc. etc.
I doubt that this piece of “good news” will be noticed by most of the MSM, where bad news is always more newsworthy than good news. Within the climate establishment, if anything, it will probably encourage more data processing to show that it’s still worse than we thought.
More good news: Solar is a microscopic contributor to grid energy. But it is growing fast.
“Time to shine: Solar power is fastest-growing source of new energy” in The Guardian Oct 4. “Renewables accounted for two-thirds of new power added to world’s grids last year, says International Energy Agency.”
See the IEA report: Renewables 2017.
Growth of solar and wind will slow after the low-hanging fruit (good, cheap locations) have been harvested.
Roger,
“Growth of solar and wind will slow … good, cheap locations) have been harvested.
First, I doubt that will happen for a long time. Esp for solar.
Second, solar tech probably remains in its early stages of development in terms of cost and efficiency.
Or maybe once the public realizes how much they’re being fleeced for each new solar panel or wind turbine that goes up…
Steve,
“Or maybe once the public realizes how much they’re being fleeced for each new solar panel ”
Perhaps all those people are just as smart as you — some perhaps even smarter — and that buying solar is rational in many areas. And that the tax benefits, where available, are also rational public policies.
Self-confidence is nice, but …
Solar is a mature technology.
Mark W.
“Solar is a mature technology.”
I work with people in the S. F. Bay area who are active in the field — in both R and D. They disagree with you. I’ll bet on them being right.
Larry,
One word.
Solyndra.
Willy Pete,
“One word.Solyndra”
Fast moving tech fields have winners — and losers. How about a two word rebuttal: Wang Laboratories.
They were a powerhouse in 1985. Dominate in word processing, with other hot products. One of the first integrated switchboard and voicemail systems, and a DOS-based PC. They filed for bankruptcy in 1992.
Does that mean that the word processing, voicemail, and PC markets matured in 1985-1992?
Larry Kummer wrote:
But many, many firms have failed to make breakthroughs in solar technology, not just one, and most of the cost of solar systems is in non-panel components like inverters, and in land, installation, maintenance , replacement (e.g., after a hurricane or hailstorm or dust storm), plus the indirect costs of standby backup power. So solar tech improvements won’t mean much, unless they’re very dramatic. Plus, they won’t benefit from subsidies indefinitely.
Roger,
“But many, many firms have failed to make breakthroughs in solar technology”
Social cell efficiency has increased in the past five years from 18% to 30%. That’s big. Commercial products lag the lab, of course. And costs have also crashed.
Looking for “breakthroughs” is missing the story. Progress in both science and commercial products is usually incremental. Look at semiconductors over the last 40 years — those steps add up.
As I said, the people I know in the field believe there is great potential for more improvements in cost-efficiency.
IIRC, efficiency has increased in commercial products only to the 25% level. The production costs of the more efficient lab products may keep them from becoming commercially cost-effective.
Semiconductors doubled their cost-effectiveness every two years, following Moore’s Law. Solar cells have become more cost-effective at a far slower rate, partly due to predatory pricing by the Chinese, possibly at the cost of product longevity.
That belief was, in part, what led Silicon Valley venture capitalists to fund numerous solar firms that believed similarly, and failed. The odds are against the optimists, therefore. (“The cynics are right nine times in ten”: H.L. Mencken.)
on Jan. 5, 2014, Lesley Stahl hosted, on CBS’s “60 Minutes” program, an episode called “The Cleantech Bust.” Its subtitle was “Despite billions invested by the U.S. government in so-called “Cleantech” energy, Washington and Silicon Valley have little to show for it.”
Its transcript is at http://www.cbsnews.com/news/cleantech-crash-60-minutes/
One 33% fuel-efficiency improvement that’s in the pipeline is Mazda’s New “Skyactiv-X” Gasoline-Powered Diesel Engine, which I described at:
https://wattsupwiththat.com/2017/08/19/road-trip-2/#comment-2585831
Roger,
“One 33% fuel-efficiency improvement that’s in the pipeline”
Wow. Such a blnkered view of technology.
Solar is probably still in its stage of development vs. room for future improvements in cost and efficiency. Many promising next-gen nuclear systems are under development. A fusion power company, Tri Alpha Energy, has attracted several hundred million dollars in private capital — and just passed an important development milestone. Electric cars are in their infancy.
Lots more out there for the 21st century. Lots of bright people working on these problems. I’ll bet on them, not your pessimism.
I quoted Larry Kummer thus:
I seconded him by writing:
Larry Kummer then wrote:
Did you misread my “One” as “Only”? That’s the only explanation iio can think of to explain your non sequitur. I neither expressed nor implied “pessimism” about future tech advances in solar, nuclear, or fusion. (I’m an enthusiast of the latter two.) I did endorse the view of a commenter I quoted that Mazda’a more efficient auto engine would keep the ICE competitive and ahead of EVs in the future, even if only in hybrids.
I disagree with your claim above that “Electric cars are in their infancy.” They’re in their dotage, and improvements in battery efficiency won’t eliminate their other barriers to large-scale adaptation, such as the burden they would place on the power net, the lack of garages for most people, their charging times, their unsuitability in very hot or cold temperatures, their failure to pay for road upkeep via gas taxers, etc. EVs are harvesting the low-hanging fruit, for now, with an assist from subsidies.
Just a bit of more good news, concerning New York #ExxonKnew
https://seekingalpha.com/article/4111579-new-yorks-exxonknew-investigation-takes-another-hit
“A recent study out of Oxford University illustrates the shortcomings of using petroleum and gas companies’ climate policy forecasts as a basis for securities fraud investigations.
The Oxford study suggests that the global “carbon budget” will not be exhausted for decades, rather than by the end of this decade as previous models had concluded.
This development illustrates the difficulties inherent in the making of convincing, let alone accurate, forecasts about future climate policies, and creates new doubts about the legal implications of such forecasts.”
Cliff,
“Just a bit of more good news, concerning New York #ExxonKnew”
That is great news, of a different kind that described in my post! Those are the kind of people that hold us back, tying us down like Gulliver with a thousand threads of legalese.
In any good propaganda campaign, it is always useful to include “good news”. That way, people don’t get so sick and tired of the “bad news” that they start tuning it out.
Alinsky 101.
Forrest,
“Who measured these emissions and how?”
Click through to the report to see those important details.
Forrest,
“Which particular link Larry?”
By “click through to the report” I meant click the report title that is at the top of my post: “Trends in global CO2 and total greenhouse gas emissions.“
Yet CO2 in the atmosphere has continued to increase.
Ummm… Something is very fishy.
Ian
Fishy is very close to the truth in fact. The truth lies where the fishy’s live, not in our power generating facilities and your graph makes the point very nicely.
Inconvenient fact, showing how unreliable Chinese reporting is and how gullible the Dutch are.
Ian,
“Yet CO2 in the atmosphere has continued to increase. Something is very fishy.”
Why do you say that? The report said that the growth rate has slowed, not that it has stopped.
Also, our emissions are just one factor in CO2 levels. Seeing that specific signal amidst other factors — and statistical noise — will take years.
I don’t see any slowing in the rate of growth in that chart.
Mark W.
“I don’t see any slowing in the rate of growth in that chart.”
(1) To repeat what I said, with additions in brackets for improved clarity: “Also, our emissions are just one factor in CO2 levels. Seeing that specific signal {slowing CO2 emissions} amidst other factors {that affect CO2 levels} — and statistical noise — will take years.”
(2) People cannot well visually interpret graphs, seeing things such as small trend changes and correlations (e.g., what line on a graph is the cause and which is effect). Professor Meir Statman of Santa Clara U and other researchers in behavioral finance have done pretty definitive work showing this. That’s why we have statistical tests to determine these things.
Negative. Human emission of CO2 decreased to almost nothing. Yet the growth of CO2 in the atmosphere didn’t flinch. It didn’t decrease at all. If it changed at all, the growth of atmospheric CO2 actually increased slightly…
If the proposition is that CO2 in the atmosphere has been increasing because of human emission of CO2 into the atmosphere, then something is verrrrrrrrrry fishy.
“The report said that the growth rate has slowed”
Yes. Emissions relate to the rate of change of concentration. This article is about the rate of change of the emissions. Or even the slowing of the rate of change. That’s the second or third derivative of concentration. It’s going to take a while to be visible in a concentration plot.
Ian,
Our emissions are just one factor in CO2 levels. Seeing that specific signal — slowing CO2 emissions — amidst the other factors that affect CO2 levels — and statistical noise — will take years.
It’s not a linear year-by-year correspondence, like pouring milk into a glass.
That’s because atmospheric CO2 concentration is not significantly dependent upon emissions from the combustion of fossil fuels.
The rate of change is still tracking temperature anomaly:
http://www.woodfortrees.org/plot/esrl-co2/from:1979/mean:12/derivative/plot/uah6/from:1979/scale:0.22/offset:0.14
It is temperature driving CO2, not the reverse.
Larry,
If human emission of CO2 stops increasing but CO2 in the atmosphere continues to increase, then it can only be because the increase of atmospheric CO2 is NOT from human emission of CO2. It must be from non-human emission of CO2, as illustrated by Bartemis.
The contradiction leaves no wiggle room.
There’s a new-ish satellite that provides regional CO2 emissions measurements. That ought to take care of the China problem. Why haven’t we heard more from it?
With China now being the world leader in quantum communication they encrypted the data and we couldn’t eavesdrop 🙂
That is what happens when you take funding away from hard sciences.
Roger,
“Why haven’t we heard more from it?”
Analysis of data from a new global sensing system is not like counting apples. It took years to get useful data from satellite microwave sounding units and the Argo float network. It is in some ways an even greater challenge to measure geographic distribution of microscopic changes in CO2 levels.
Here’s a useful NASA article about the Orbiting Carbon Observatory-2.
https://earthobservatory.nasa.gov/IOTD/view.php?id=89117
Larry,
Thanks for posting the link. It is the first time I have seen these maps. I’ll have to spend some time looking at them before I form an opinion.
The maps don’t tell a lot. They show where concentration is, not what the source is. Diffuse natural emission from all across the globe still way outweighs human emissions concentrated in particular locales.
Bartemis,
The maps are just a start. It takes time to collate and process new data. Patience.
RK,
The NASA OCO-2 satellite was launched in 2014, and the first results were presented at the annual AGU meeting in late 2014. There has been very little published since then, perhaps because the presumed sources of anthropogenic CO2 were not evident. Raw data are available on the internet, but one would need a small grant to process the data.
More recently, the Chinese have launched their own CO2-monitoring satellite. I have searched on the internet and have not been able to find anything published showing its results.
My cynical suspicion is that if the satellites were finding evidence to support the official party line, it would be splashed all over the headlines. Instead, we are hearing the crickets chirp.
graph second attempt