Note: I present this for discussion, I have no opinion on its validity -Anthony Watts
Guest essay by Allan MacRae
Temperature, among other factors, drives atmospheric CO2 much more than CO2 drives temperature. The rate of change dCO2/dt varies ~contemporaneously with temperature, which reflects the fact that the water cycle and the CO2 cycle are both driven primarily by changes in global temperatures (actually energy flux – Veizer et al).
To my knowledge, I initiated in January 2008 the hypothesis that dCO2/dt varies with temperature (T) and therefore CO2 lags temperature by about 9 months in the modern data record, and so CO2 could not primarily drive temperature. Furthermore, atmospheric CO2 lags temperature at all measured time scales.
In my Figure 1 and 2, global dCO2/dt is closely correlated with global Lower Tropospheric Temperature (LT) and Surface Temperature (ST). The temperature and CO2 datasets are collected completely independently, and yet this close correlation exists.
I also demonstrated the same close correlation with different datasets, using Mauna Loa CO2 data and Hadcrut3 ST back to 1958. I subsequently examined the close correlation of LT measurements taken by satellite and those taken by radiosonde.
Earlier papers by Kuo (1990) and Keeling (1995) discussed the delay of CO2 after temperature, although neither appeared to notice the even closer correlation of dCO2/dt with temperature. This correlation is noted in my Figures 3 and 4.
My hypothesis received a hostile reaction from both sides of the fractious global warming debate. All the “global warming alarmists” and most “climate skeptics” rejected it.
First I was just deemed wrong – the dCO2/dt vs T relationship was allegedly a “spurious correlation”.
Later it was agreed that I was correct, but the resulting ~9 month CO2-after-T lag was dismissed as a “feedback effect”. This remains the counter-argument of the global warming alarmists – apparently a faith-based rationalization to be consistent with their axiom “WE KNOW that CO2 drives temperature”.
This subject has generated spirited discussion among scientists. Few now doubt the close correlation dCO2/dt vs T. Some say that humankind is not the primary cause of the current increase in atmospheric CO2 – that it is largely natural. Others rely on the “mass balance argument” to refute this claim.
The natural seasonal amplitude in atmospheric CO2 ranges up to ~16ppm in the far North (at Barrow Alaska) to ~1ppm at the South Pole, whereas the annual increase in atmospheric CO2 is only ~2ppm. This seasonal “CO2 sawtooth” is primarily driven by the Northern Hemisphere landmass, which has a much greater land area than the Southern Hemisphere. CO2 falls during the Northern Hemisphere summer, due primarily to land-based photosynthesis, and rises in the late fall, winter and early spring as biomass decomposes.
Significant temperature-driven CO2 solution and exsolution from the oceans also occurs.
See the beautiful animation below:
In this enormous CO2 equation, the only signal that is apparent is that dCO2/dt varies approximately contemporaneously with temperature, and CO2 clearly lags temperature.
CO2 also lags temperature by about 800 years in the ice core record, on a longer time scale.
I suggest with confidence that the future cannot cause the past.
I suggest that temperature drives CO2 much more than CO2 drives temperature. This does not preclude other drivers of CO2 such as fossil fuel combustion, deforestation, etc.
My January 2008 hypothesis is gaining traction with the recent work of several researchers.
Here is Murry Salby’s address to the Sydney Institute in 2011:
http://www.youtube.com/watch?v=YrI03ts–9I&feature=youtu.be
See also this January 2013 paper from Norwegian researchers:
The Phase Relation between Atmospheric Carbon Dioxide and Global Temperature
Global and Planetary Change, Volume 100, January 2013
by Humlum, Stordahl, and Solheim
http://www.sciencedirect.com/science/article/pii/S0921818112001658
– Changes in global atmospheric CO2 are lagging 11–12 months behind changes in global sea surface temperature.
– Changes in global atmospheric CO2 are lagging 9.5–10 months behind changes in global air surface temperature.
– Changes in global atmospheric CO2 are lagging about 9 months behind changes in global lower troposphere temperature.
– Changes in ocean temperatures explain a substantial part of the observed changes in atmospheric CO2 since January 1980.
– Changes in atmospheric CO2 are not tracking changes in human emissions.
Observations and Conclusions:
1. Temperature, among other factors, drives atmospheric CO2 much more than CO2 drives temperature. The rate of change dCO2/dt is closely correlated with temperature and thus atmospheric CO2 LAGS temperature by ~9 months in the modern data record
2. CO2 also lags temperature by ~~800 years in the ice core record, on a longer time scale.
3. Atmospheric CO2 lags temperature at all measured time scales.
4. CO2 is the feedstock for carbon-based life on Earth, and Earth’s atmosphere and oceans are clearly CO2-deficient. CO2 abatement and sequestration schemes are nonsense.
5. Based on the evidence, Earth’s climate is insensitive to increased atmospheric CO2 – there is no global warming crisis.
6. Recent global warming was natural and irregularly cyclical – the next climate phase following the ~20 year pause will probably be global cooling, starting by ~2020 or sooner.
7. Adaptation is clearly the best approach to deal with the moderate global warming and cooling experienced in recent centuries.
8. Cool and cold weather kills many more people than warm or hot weather, even in warm climates. There are about 100,000 Excess Winter Deaths every year in the USA and about 10,000 in Canada.
9. Green energy schemes have needlessly driven up energy costs, reduced electrical grid reliability and contributed to increased winter mortality, which especially targets the elderly and the poor.
10. Cheap, abundant, reliable energy is the lifeblood of modern society. When politicians fool with energy systems, real people suffer and die. That is the tragic legacy of false global warming alarmism.
Allan MacRae, Calgary, June 12, 2015
CARBON DIOXIDE IS NOT THE PRIMARY CAUSE OF GLOBAL WARMING:
THE FUTURE CAN NOT CAUSE THE PAST
by Allan M.R. MacRae
The Intergovernmental Panel on Climate Change (“IPCC”) stated in its 2007 AR4 report:
Warming of the climate system is unequivocal, as is now evident from observations of increases in global average air and ocean temperatures, widespread melting of snow and ice, and rising global average sea level.
… Carbon dioxide (CO2) is the most important anthropogenic GHG. Its annual emissions grew by about 80% between 1970 and 2004.
… Most of the observed increase in globally-averaged temperatures since the mid-20th century is very likely due to the observed increase in anthropogenic GHG concentrations. It is likely there has been significant anthropogenic warming over the past 50 years averaged over each continent (except Antarctica).
However, despite continuing increases in atmospheric CO2, no significant global warming occurred in the last decade, as confirmed by both Surface Temperature and satellite measurements in the Lower Troposphere (Figures CO2, ST and Figure 1).


Contrary to IPCC fears of catastrophic anthropogenic global warming, Earth may now be entering another natural cooling trend.
Earth Surface Temperature warmed approximately (“~”) 0.7 degrees Celsius (“C”) from ~1910 to ~1945, cooled ~0.4 C from ~1945 to ~1975, warmed ~0.6 C from ~1975 to 1997, and has not warmed significantly from 1997 to 2007.
CO2 emissions due to human activity rose gradually from the onset of the Industrial Revolution, reaching ~1 billion tonnes per year (expressed as carbon) by 1945, and then accelerated to ~9 billion tonnes per year by 2007. Since ~1945 when CO2 emissions accelerated, Earth experienced ~22 years of warming, and ~40 years of either cooling or absence of warming.
The IPCC’s position that increased CO2 is the primary cause of global warming is not supported by the temperature data.
In fact, strong evidence exists that disproves the IPCC’s scientific position. The attached Excel spreadsheet (“CO2 vs T”) shows that variations in atmospheric CO2 concentration lag (occur after) variations in Earth’s Surface Temperature by ~9 months (Figures 2, 3 and 4). The IPCC states that increasing atmospheric CO2 is the primary cause of global warming – in effect, the IPCC states that the future is causing the past. The IPCC’s core scientific conclusion is illogical and false.


There is strong correlation among three parameters: Surface Temperature (“ST”), Lower Troposphere Temperature (“LT”) and the rate of change with time of atmospheric CO2 (“dCO2/dt”) (Figures 1 and 2). For the time period of this analysis, variations in ST lead (occur before) variations in both LT and dCO2/dt, by ~1 month. The integral of dCO2/dt is the atmospheric concentration of CO2 (“CO2“) (Figures 3 and 4).
Natural seasonal variations in temperatures ST and LT and atmospheric CO2 concentrations all considerably exceed average annual variations in these parameters. For this reason, 12 month running means have been utilized in Figures 1 to 4. All four parameters ST, LT, dCO2/dt and CO2 are global averages. ST and LT have been multiplied times 4 in Figures 1 to 4 for visual clarity.
Figure 1 displays the data before detrending, and shows the strong correlation among ST, LT and dCO2/dt. Detrending removes the average slope of the data to enable more consistent correlations, as in Figures 2 to 4. In Figure 3, the atmospheric CO2 curve is plotted with the three existing parameters, and lags these three by ~9 months. This lag is clearly visible in Figure 4, with the CO2 curve shifted to the left, 9 months backward in time.
Figures 5 to 8 (included in the spreadsheet) do not use 12 month running means, and exhibit similar results.
The period from ~1980 to 2007 was chosen for this analysis because global data for LT and CO2 are not available prior to ~1980. This period from ~1980 to 2007 is also particularly relevant, since this is the time when most of the alleged dangerous human-made global warming has occurred.
In a separate analysis of the cooler period from 1958 to 1980, global ST and Mauna Loa CO2 data were used, and the aforementioned ~9 month lag of CO2 behind ST appeared to decline by a few months.
The four parameters ST, LT, dCO2/dt and CO2 all have a common primary driver, and that driver is not humankind.
Veizer (2005) describes an alternative mechanism (see Figure 1 from Ferguson and Veizer, 2007, included herein). Veizer states that Earth’s climate is primarily caused by natural forces. The Sun (with cosmic rays – ref. Svensmark et al) primarily drives Earth’s water cycle, climate, biosphere and atmospheric CO2.
Veizer’s approach is credible and consistent with the data. The IPCC’s core scientific position is disproved – CO2 lags temperature by ~9 months – the future can not cause the past.
While further research is warranted, it is appropriate to cease all CO2 abatement programs that are not cost-effective, and focus efforts on sensible energy efficiency, clean water and the abatement of real atmospheric pollution, including airborne NOx, SOx and particulate emissions.
The tens of trillions of dollars contemplated for CO2 abatement should, given the balance of evidence, be saved or re-allocated to truly important global priorities.
________________________________________________________________________________________
Excerpts from Veizer (GAC 2005):
Pages 14-15: The postulated causation sequence is therefore: brighter sun => enhanced thermal flux + solar wind => muted CRF => less low-level clouds => lower albedo => warmer climate.
Pages 21-22: The hydrologic cycle, in turn, provides us with our climate, including its temperature component. On land, sunlight, temperature, and concomitant availability of water are the dominant controls of biological activity and thus of the rate of photosynthesis and respiration. In the oceans, the rise in temperature results in release of CO2 into air. These two processes together increase the flux of CO2 into the atmosphere. If only short time scales are considered, such a sequence of events would be essentially opposite to that of the IPCC scenario, which drives the models from the bottom up, by assuming that CO2 is the principal climate driver and that variations in celestial input are of subordinate or negligible impact….
… The atmosphere today contains ~ 730 PgC (1 PgC = 1015 g of carbon) as CO2 (Fig. 19). Gross primary productivity (GPP) on land, and the complementary respiration flux of opposite sign, each account annually for ~ 120 Pg. The air/sea exchange flux, in part biologically mediated, accounts for an additional ~90 Pg per year. Biological processes are therefore clearly the most important controls of atmospheric CO2 levels, with an equivalent of the entire atmospheric CO2 budget absorbed and released by the biosphere every few years. The terrestrial biosphere thus appears to have been the dominant interactive reservoir, at least on the annual to decadal time scales, with oceans likely taking over on centennial to millennial time scales.
Excerpt from Ferguson & Veizer (JGR 2007):

Ferguson & Veizer Figure 1
A schematic diagram of the principal drivers of the Earth’s climate system. The connections between the various components are proposed as a hypothesis for coupling the terrestrial water and carbon cycles via the biosphere. Galactic cosmic rays and aerosols are included, although their roles are more contentious than other aspects of the Earth’s climate system.
References and Acknowledgements:
IPCC Fourth Assessment Report, Climate Change 2007, Synthesis Report
http://www.ipcc.ch/pdf/assessment-report/ar4/syr/ar4_syr_spm.pdf
Svensmark et al, Center for Sun-Climate Research, Danish National Space Center, Copenhagen
www.spacecenter.dk/research/sun-climate
Veizer, “Celestial Climate Driver: A Perspective from Four Billion Years of the Carbon Cycle”, GeoScience Canada, Volume 32, Number 1, March 2005
http://www.gac.ca/publications/geoscience/TOC/GACgcV32No1Web.pdf
Ferguson & Veizer, “Coupling of water and carbon fluxes via the terrestrial biosphere and its significance to the Earth’s climate system”, Journal of Geophysical Research – Atmospheres, Volume 112, 2007
http://www.agu.org/pubs/crossref/2007/2007JD008431.shtml
Spencer, Braswell, Christy & Hnilo, “Cloud and radiation budget changes associated with tropical intraseasonal oscillations”, Geophysical Research Letters, Volume 34, August 2007
http://www.agu.org/pubs/crossref/2007/2007GL029698.shtml
McKitrick & Michaels, “Quantifying the influence of anthropogenic surface processes and inhomogeneities on gridded global climate data”, Journal of Geophysical Research – Atmospheres, Volume 112, December 2007 http://www.agu.org/pubs/crossref/2007/2007JD008465.shtml
Considerable insight and/or assistance have been provided by Roy Spencer of University of Alabama, Ken Gregory of Calgary and others.
Conclusions, errors and omissions are the sole responsibility of the writer.
Data sources are gratefully acknowledged:
Surface Temperatures: Climatic Research Unit, University of East Anglia, Norwich, UK
Lower Troposphere Temperatures: The National Space Science and Technology Center, University of Alabama, Huntsville, USA
Atmospheric CO2 concentrations: NOAA Earth System Research Laboratory, Global Monitoring Division, Boulder CO, USA
http://www.esrl.noaa.gov/gmd/ccgg/trends/
CO2 emissions (expressed as carbon): Marland, Boden & Andres, 2007, “Global, Regional, and National CO2 Emissions”, in “Trends: A Compendium of Data on Global Change”, Carbon Dioxide Information Analysis Center, Oak Ridge National Laboratory, U.S. Department of Energy, Oak Ridge, Tenn., U.S.A
http://cdiac.ornl.gov/ftp/ndp030/global.1751_2004.ems
Allan M.R. MacRae, B.A.Sc., M.Eng., is a Professional Engineer.
Copyright January 2008 by Allan M.R. MacRae, Calgary Alberta Canada
Forgive me if I comment, “Well, duh!”
“Climate scientists” are intensely stupid, and must be intentionally, willfully so, to have so completely confused cause and effect, hoping that the hoi poloi wouldn’t notice the Mann behind the curtain.
Yeah, that makes sense, doesn’t it.
No sir, you are dead wrong on that.
OK, I’m shooting from the hip here. I think I recall doing a calculation using some silly number like 15 degrees C as the “average” ocean temperature. Then bumping it up by say, 1 degree C…and finding the amount of CO2 added to the atmosphere due to Henry’s law deloading of the first 3000 feet of the oceans. It stunned me to find that it more than doubled the amount of CO2 PPM in the atmosphere. This was MY first introduction to the “propostion/concept/hypothesis” that TEMPERATURE Of the atmosphere, if a driver of the ocean temps, could be causing an elevation of the CO2 levels. However, I (more and more with time) discarded this as: 1. During the 19th century, from about 1820 to 1920 there was a general uptrend, but much evidence shows NO significant change in CO2. 2. During the 1940 to 1980 period, many records indicate a general downturn in tropospheric temperatures, yet the CO2 does indeed seem to generally increase. Again, I think the more salient factor here is probably the straight “atmospheric energy balance”, and persuing Willis E’s “thunderstorm thermostat” work and Svensmark’s Cosmic ray/cloud cover work may prove more fruitful in terms of modeling the WHOLE system, and not just isolating to CO2. (Which, even in the straight Ahrenius calculation, does not cause the disaster of the AWG proponents, sans the “feedback” factors being POSITIVE (which Svensmark, Spencer, and others have addressed as being unlikely.)
The oceans have not warmed enough to account for observed increases in CO2, although the assumed levels for prior intervals during the Holocene can be questioned.
Still, I’m willing to stipulate that most of the presumed increase from 280 to 400 ppm over the past 165 years have been from burning fossil fuels.
The rub is that CACCA screamers find this rise in plant food to be dangerous, while I welcome its benefits. IMO 800 ppm would be better than 400 and 1200 better still. After that (or so), there is no further benefit for plants.
You can guess that atmospheric carbon has increased because humans, if you like. But it is just as likely a natural occurance, we can reliably claim some of the increase is ours, outside that is all guess work. Likewise, and thank you Anthony, its painfully obvious that claiming to know a surface temp mean of any year is ludicrous. I’m a big tech guy, I want to know the limitations and specs of our gear. At the moment we have vague temp inferences and nothing more. Until we have more than that this argument on every side is purely theoretical and worse. The best we can say is, ” from our observations ( which are shotty) we can guess at a global mean temp, and we can guess at trends in a vague way. That policy makers are looking at the serious scope of climate change based on the “observed” or “modelled” is pure unbridled stupidity of the very highest order
Better re-think your statement that more CO2 will be better for plants.
..
http://onlinelibrary.wiley.com/doi/10.1111/gcb.12938/abstract
I also understand that the increase in beneficial plant growth (globally observed) up to about 1200 PPM is fairly linear, while the purported harms (universally failing to manifest) exponentially decrease with more CO2.
What’s not to like?
Carbon is good for plants, everybody knows this. Greenhouses pump it in. Not even a good attempt…tisk tisk
@ur momisugly Joel D. Jackson
and yours – http://www.co2science.org/subject/n/subject_n.php
I don’t consider a blog to be as reliable as current research.
Joel Jackson, your nitrogen concerns are a non problem. With higher CO2 nitrogen efficiency increases, and good farming practice takes care of ay residual issues.
http://co2science.org/subject/n/nitrogenefficiency.php
as one example, http://co2science.org/articles/V8/N40/B2.php
“they report that “elevCO2 isolates stimulated both biological N2 fixation in the nodule symbiosis and nitrate uptake from the growth substrate,” such that “nitrogen uptake from soil was nearly twice as high in plants colonized by elevCO2 isolates as in plants colonized by ambCO2 isolates.”
Joel, altogether at least 60 studies at CO2 science explain why your concerns are not warranted.
http://co2science.org/subject/n/summaries/nitrogenefficiency.php
“In reviewing the literature in this area, one quickly notices that in spite of the fact that photosynthetic acclimation has occurred, CO2-enriched plants nearly always display rates of photosynthesis that are greater than those of control plants exposed to ambient air. Consequently, photosynthetic nitrogen-use efficiency, i.e., the amount of carbon converted into sugars during the photosynthetic process per unit of leaf nitrogen, often increases dramatically in CO2-enriched plants.”
PS Bubba Cow
..
That blog mentions the nitrogen fixation issue
…
Look under “Progressive Limitation Hypothesis”
…
Thank you
Joel, CO2 science is a site that presented the abstracts and summaries of PEER REVIEWED LITERATURE, run by some of the most respected and published PHD scientists in the field. Your critique calling them “some blog” is arrogant ignorance.
David A
…
Try getting with current research please.
Joel Jackson,
Are you saying you understand the abstract you linked to? I really doubt it.
For readable information on the subject, see here. That should keep you busy for a while.
CO2 is plant food…
click1
click2
click3
…is there any doubt?
Joel D. Jackson June 13, 2015 at 9:51 pm
and so what does nitrogen or “fixation” contribute to molecules with carbon, hydrogen, and oxygen?
Your words – with links, but don’t simply throw html links
Stealey, you lost all credibility with this wonderful display of your ignorance: http://wattsupwiththat.com/2015/06/09/huge-divergence-between-latest-uah-and-hadcrut4-revisions-now-includes-april-data/#comment-1962152
Do you want me to school you on GRACE?
Bubba Cow
Without a source of nitrogen, plants cannot build amino acids. No amino acids, means no proteins, means no growth.
…
Do I get a gold star?
J. Jackson sez:
Try getting with current research please.
Data doesn’t change (unless it’s ‘adjusted’). The truth of the matter is the truth no matter when it appears. I understand the comment above is your only response, but even you have to see how lame it is.
And thanx for your opinion that I ‘lost all credibility’. Coming from someone who disagrees with everyone else here, I can only assume you have no mirrors in your house.
Sorry to bust your ego there Stealey, but you obviously don’t know anything about GRACE.
…
Stay tuned, and I’ll tell you all about it.
Joel D. Jackson
June 13, 2015 at 9:54 pm say (regarding over 60 peer reviewed studies linked at CO2 science)
David A
…Try getting with current research please.
=======================================
LOL Joel reason has forsaken you. Those studies are both current and past, and not refuted by ANYTHING you posted, which was simply a rehash of the non problem with nitrogen efficiency. Let me ask you Joel; do facts dissipate with time? Did your single linked study, demonstrating nothing new, dispute any of the dozens of studies I linked to?
Jackson sez:
“Stay tuned”?
Oh, of course. You need to trot on back to skepticalscience or Hotwhopper for the latest spin. I’ll wait here while you do some cuttin’ ‘n’ pasting.
David A
..
The issue with nitrogen uptake has never been resolved. The study I provided a link to is current and will resolve the issues that even the blog you reference knows about.
Stealey, I don’t have to cut / paste anything.
..
Your lesson for tonight is:
..
GRACE does not measure sea level.”
..
Just repeat that sentence several times, and maybe it will sink in.
David A,
Three things are becoming obvious in this exchange regarding Mr. Jackson:
1. He was wrong about his nitrogen link
2. He didn’t understand the abstract he posted
3. His arguments are based on his eco-religion, not on science
@joel D. Jackson June 13, 2015 at 10:04 pm
No stars, but protein is good, however element balance is essential.
I’ve wondered for a while when the community trolling skeptical views would target CO2 benefits and I’m curious – just how is this work assigned? We’re well aware of the thread-jacking deal, so just interested in the topic assignment biz.
J. Jackson sez:
“GRACE does not measure sea level.”
Jackson, you claim you don’t cut ‘n’ paste. Maybe you’d better start, because there are about a million links that show you’re wrong. Here’s just one:
http://phys.org/news/2010-11-satellites-reveal-differences-sea.html
There’s been some weird trolling on here this past week. They’re definitely sounding more deranged/unhinged than usual. Was the Karl paper some kind of trigger ??
Yes DB, reason has forsaken our friend Joel, but he can still type.
philincalifornia,
Right as usual, I noticed the same thing.
========================
David A,
Unfortunately, you’re also right. Jackson has skedaddled for the moment, off to lick his wounds. But he will be back.
[Take that as a taunt, Joel, and prove me wrong for once. Please.]
Choice: novel, speculative research or established facts that have been used for a century?
Greenhouses pump in CO2 and the plants grow better.
If your research says they don’t then you better get another job.
The Wiley online library paper implies that faster growing plants from increased CO2 will require more nitrogen (fertilizer) which would seem reasonable. This may be consequential at least for areas that are already near their N limit like rain forests and maybe other areas such as grasslands unless conversion efficiency is improved also (not covered by paper). It would NOT apply to crop or tree vegetation where fertilizer (N) is added artificially and doubtful that it applies to the ocean. It would be interesting to see some general studies of the impact on non artificially fertilized plant regimes.
Joel is way off the mark with his hypothesis. N fixing has been and will continue to be a problem, regardless of the amount of CO2 in the air. It is the reason for the modern use of annual fertilizer application resulting in increased yield on productive land as opposed to fallow practices.
Besides, no one here accepts statements about a piece of research unless we have full access to it. Taking an abstract from a pay-walled article and then saying something catastrophic based on ONE abstract is the epitome of piss poor understanding of complex issues with long histories. N fixing is one of those complex issues that must be understood only with a very large base of old AND new research.
I get immensely ruffled in my feathers when young folks think only CURRENT research has any validity to bring to the table around complex discussions. If you really want to show up as having any intelligence at all regarding N, ask a farmer who is well-schooled on this subject. I seriously doubt Joel has planted a row of beans and wouldn’t know the reason for it if he did.
DBstealey:
Do us all a favor, and copy and paste the information from your Phys.org article written by Phillip F. Schewe that says GRACE measures sea level.
..
Measuring mass differentials below their orbits does not measure distance.
..
Are you confused about the calculated rise in sea level from the measurements of shrinking ice? GRACE has found ice mass loss in Greenland and Antarctic among other things, but tell all of us how measuring GRACE measures sea level. Since you know all about it, please tell us.
Joel D. Jackson
You are repeating what you have been told – like so many before. More aggressively, more obnoxiously than most who have repeated these same things before, but still with no truth inside.
GRACE (attempts to) measure “distance” – that is all it (attempts) to do. The distance reported is between two satellites orbiting the earth – which varies during their 570 km orbit considerably:
http://www.csr.utexas.edu/grace/operations/configuration.html
GRACE satellites were launched on March 17, 2002, on-board Rockot, from Plesetsk Cosmodrome in Siberia.
The satellites were injected into a 500 km altitude, near circular polar orbit.
Since then, the satellite orbit and its ground-track have been allowed to drift naturally. The mean semi-major axis for GRACE-B is shown below.
The mean semi-major axis for GRACE-B (graph follows)
The plot of mean eccentricity shows the characteristic 94-day perigee period. The periodicity in the mean inclination shows diverse effects. The near 160 day (S2 alias) period is the influence of the Sun on the orbit plane; and the slower half-cycle seen over 3 years (K1 alias) could be related to luni-solar effects and the orbital precession.
The plot of mean eccentricity shows the characteristic 94-day perigee period (graph follows)
The next plot shows the evolution of the mean perigee and node. The node precesses barely at all, due to the polar inclination of the satellite. The perigee completes one cycle every 94 days. (graph follows)
The next plot shows the evolution of the mean perigee and node. (graph follows)
The next plot shows the angle between the Earth-Sun line and the orbit plane (or the beta_prime angle). This angle is defined such that it is zero when the Sun is within the orbit plane. (graph follows)
The next plot shows the angle between the Earth-Sun line and the orbit plane (or the beta_prime angle).
Relative Orbit Evolution (plots updated daily)
The orbit of GRACE-A relative to GRACE-B is shown in this section. (graph follows) Discounting some early orbit adjustments, the mean semi-major axis difference (shown in the first plot) between the two satellites averages around 0 meters. Step changes in the semi-major axis difference appear when orbit maneuvers are executed in order to keep the separation between 170 and 220 km. In the early days of the mission, some changes were also caused by an attitude mode loss on board one of the spacecrafts, which leads to increased drag.
The mean semi-major axis difference (shown in the first plot) between the two satellites averages around 0 meters. (graph follows)
The semi-major axis difference and drag acceleration differences are the largest contributor to the macro-scale evolution of the inter-satellite range. The following plot shows the range between GRACE-A and GRACE-B at midnight each day. (graph follows)
The following plot shows the range between GRACE-A and GRACE-B at midnight each day. (graph follows)
The inclinations of the two satellites are slightly different, as shown below. (graph follows)
The inclinations of the two satellites are slightly different, as shown below. (graph follows)
The eccentricity of the two satellites are slightly different, as shown below. (graph follows)
The eccentricity of the two satellites are slightly different, as shown below. (graph follows)
Over a smaller time scale, the intersatellite range has a largely 1-cycle per revolution variation of approximate 2-3 km amplitude� a sample for an arbitrarily chosen day is shown below. The drift from start to end of day is part of the large trend seen before.
The intersatellite range has a largely 1-cycle per revolution variation of approximate 2-3 km amplitude – a sample for an arbitrarily chosen day is shown below.
The range-rate is of the order of 2 m/s amplitude, as shown below. (graph follows)
Embedded within these large signals, are variations at the level of few tens of microns, or few tenths of micron/seconds, which are caused by mass re-distribution processes within the Earth system. It is these small, hidden signatures that the GRACE Science Data System attempts to extract as models of the Earth gravity field.
Thus, GRACE does NOT measure “ice mass loss” anywhere. It “measures” the change in radio signals between two satellites 500 km above the earth as the distance theoretically changes after each of the two satellites flies over the slightly changing mass below. From that change, the GRACE team is charged with calculating the expected change in two places (Greenland and Antarctica) over time that are expected from a loss of glacier ice mass.
But then DB, it is understandable why you are confused about what satellites measure. For example, I’ll bet you think that the satellites that UAH and RSS use are measuring temperature. They are not. They are measuring microwave energy. The “temperature” is inferred > from models You see, GRACE measures mass differences, and scientists infer seal level rise from the changes in the mass distribution on the surface of the planet.
Does this help you to understand?
Additionally Mr Stealey….
..
Satellites such as JASON or TOPEX have radar altimeters. That instrument measures distance. These measurements are direct measurement of sea level.
sturgishooper
June 13, 2015 at 8:52 pm
Hello hooper.
You say::
“The oceans have not warmed enough to account for observed increases in CO2, although the assumed levels for prior intervals during the Holocene can be questioned.”
——————
I do not mean to be mean…believe me…….but what you say above, as far as i can tell is the exact classical mistake always made…trying to pervert principles on the intent by over relying on the terminology that tries to explain the given principles.
Thus has been always for ever and thus is how it will continue to be.
You see the point with the observed increases in CO2 has in principle only to do with the direction of energy flow……for as long the energy flows from oceans to the atmosphere it means an increase………but in contrary to the assumed simple terminology it could be in both cases,,,,,,,, it could be so when oceans can be seen as cooling and also when oceans can be seen as warming….depends in the actual climatic moment……… for as long as the energy moves from oceans to atmosphere, whatever the reason been, the CO2 will go up.
So deciding and estimating the actual situation based in terminology could end up to be completely wrong, as in your case.
But if relying in principle the case could be much easy to asses correctly.
hope you get the point made..
cheers
J. Jackson sez:
Do us all a favor, and copy and paste…
Is he back already? I thought he’d be too embarassed to show up again in this thread. Anyway, copying and pasting is jackson’s job, he doesn’t get to assign homework.
It’s fun watching my comments spin up Jackson like that. Three replies in a row, that’s what I like to see. Very amusing. He’s just trying to climb down from these comments:
…you obviously don’t know anything about GRACE… Stay tuned, and I’ll tell you all about it…
And:
“Your lesson for tonight is: ‘GRACE does not measure sea level.’ Just repeat that sentence several times, and maybe it will sink in.”
Digging his hole deeper, Jackson says:
“you obviously don’t know anything about GRACE. Stay tuned, and I’ll tell you all about it… I will school you on GRACE…” &etc. What a hoot!
My reply here is because Mr. Jackson wrote that I was wrong when I said the GRACE satellites are used to measure sea levels. His response was that I had “lost all credibility” when I wrote that MSL (Mean Sea Level) measurements are done by GRACE. So I wonder… does that ‘credibility’ thingy work both ways? ☺
GRACE is used to measure MSL. This is explained right on the GRACE home page.
Simply doing a search of 2 keywords: “GRACE, sea level” brings up dozens of pages verifying that the 2 GRACE satellites are used to measure sea levels.
But Mr Jackson simply cannot admit that he was wrong. So he’s trying to tap-dance around his explicit statement: “GRACE does not measure sea level.” His latest climbdown is that GRACE ‘calculates’ sea levels. But of course, that’s what TOPEX, JASON, and other satellites do, too. They don’t lower a tape measure to the surface. So I enjoy Jackson’s backing and filling.
It is a common trait among the climate alarmist crowd that they can never, ever admit they were wrong about anything. They know that if they start admitting they were wrong, there’s no end to it. Because their basic “dangerous man-made global warming” narrative is ridiculously wrong. In fact, they’re wrong about just about everything, as we see in Jackson’s comment:
Better re-think your statement that more CO2 will be better for plants.
Implying that more CO2 is not good for plants.
Wrong again, Jackson. ☺
dbstealey
Well, more accurately, GRACE does not even “measure” ice loss over the Greenland and Antarctic ice caps either. As mentioned above, GRACE “measures” the very, very small changes in phase of the EM waves signals between two satellites 500 km above the earth as those distances change due the massive (but assumed completely predictable) 170+ km distances change during each orbit and through each year.
Then, the (human) processors attempt to determine the sub-millimeter changes in that distance due to the (assumed) mass changes in the area of the earth over which each of the two satellites flew over a few minutes prior.
Then, once this change-in-satellite-distance-over-a-previous-location-on-earth has been calculated, the GRACE humans attempt to calculate the change in earth’s mass at each location based on the change between earlier orbits (several years before) and the most recent orbits.
Then, assuming the change in each the mass in each area since 2002 has been calculated, the GRACE humans attempt to determine how much of that change has been due to ice loss, ice gain, and the relative height movement of the earth’s crust otherwise invisible under the continual daily, weekly, monthly and seasonal changes of ice and water over every area of interest.
Then, the GRACE humans decide how much mass changes that they have calculated present over ten years are due to actual changes in ice cap mass, and how much are due to assumed rock and stratus changes under the ice and water.
But glacier ice (below 160 meters) is about 0.917 density – much less (0.400 to 0.600) above 160 meters.
“Continetnal rock” on the other hand, is generally denser than even compressed glacial ice: Averaging about 2.6 density … But!
How many millions of sq kilometers of sub-Antarctic rock is actually measured? There have only been a handful of ice cores in Antarctica – and several have stopped well-above the rock under the 3000 – 5000 meter thick icecap.
What is below the ice? If only 3 deep ice cores have struck rock, can you really claim to know what is the geology of an area 45% larger than Canada from 2 core drills? What is that rock actually doing? Well, let’s measure the altitude of a mountain in Appalachia and a mountain top in Colorado, and I’ll tell you how much the Mississippi River bottom mud is at St Louis has changed between last year and today. After all, that IS what Jackson is claiming his Big Government-paid team behind GRACE’s curtain are doing when they measure ice mass losses from Greenland.
Thank you Mr RACOOKPE1978
..
I especially like your post where you say “, which are caused by mass re-distribution processes within the Earth system.”
…
You have just acknowledged my original statement to Stealey, that GRACE does not measure sea level.
..
Thank you very much for bolstering my point.
Stealey.
…
Thanks for linking to the GRACE home page.
…
Re-read this —> ” These estimates, in conjunction with other data and models, have provided observations of terrestrial water storage changes, ice-mass variations, ocean bottom pressure changes and sea-level variations.”
Now note the words “in conjunction with other data and models”
…
See? GRACE does not measure sea levels.
Thank you for posting a link to the home page which clears up that issue.
Stealey now posts this laughable item: “TOPEX, JASON, and other satellites do, too. They don’t lower a tape measure to the surface. So I enjoy Jackson’s backing and filling.”
…
Guess you don’t understand what a radar altimeter is, how it works, or what it is measuring. Effectively they ARE lowering a tape measure to the surface. You measure distances with radar.
Dear Joel D. Jackson , the question is now on you: how much more N has to be applied to soils to achieve the same growth rate that plants achieve all on their lonesome, by absorbing eCO2??? The researcher are assuming that a certain quantity of N has to be used by plants, I am saying that with increased eCO2 plants do not need as much N! Usual cherry picking of numbers and assumptions to make a result fit a theory!
Joel, for someone who keeps telling others they don’t understand how things work you show a truly ALARMING level of ignorance of the workings of most of the technology discussed here. A radar altimeter works far more like the GRACE system than like a measuring tape. In both cases what you are actually measuring is the time it takes a electromagnetic signal to travel from its source to a receiver. You can then use that measurement of time and the propagation rate of the signal to FIGURE the distance.
schitzree
Again, I know this is repetitious, but …..GRACE is not measuring sea level.
..
A radar altimeter is measuring the distance from the instrument to the surface.
..
Got it?
” Joel D. Jackson
June 14, 2015 at 12:26 pm:
Stealey now posts this laughable item: “TOPEX, JASON, and other satellites do, too. They don’t lower a tape measure to the surface. So I enjoy Jackson’s backing and filling.”
…
Guess you don’t understand what a radar altimeter is, how it works, or what it is measuring. Effectively they ARE lowering a tape measure to the surface. You measure distances with radar.”
You might want to read up on that. Changes from the return signal are used to infer a topography of the surface based on modelling. The altimeter measures large swathes of land at once (sorry, I forgot how large). Its not like dropping a tape measure and measuring every m2.
Robert B The radar altimeter is measuring the distance from the instrument to the surface based on the propagation delay of the EM waves. A tape measure measures distance.
…
Pretty simple analogy wouldn’t you say?
…
TOPEX and JASON use radar altimeters. I’m sure you could reduce the “footprint” by using a LIDAR instead. But then, it’s based on the same principle, and still measures distance.
Joel: I see you never went to survey school and learned how much calibration and adjustments are required to accurately measure anything with a device as inaccurate as a “Tape Measure” many of which can’t get an accuracy of 2 mm in 200 mm, and the longer the distance, the more inaccurate. LOL
Wayne Delbeke, P. Eng.
Robert B,
J. Jackson isn’t capable of understanding, when he writes this:
GRACE is not measuring sea level,
It is a distinction without a difference. By the definition he’s trying to torture, no satellite does measurements, which is silly. He’s just doing a forced climbdown because he stated unequivocally that GRACE doesn’t measure sea levels.
There are hundreds of hits using the keywords: “sea level, GRACE” that make it clear that’s what GRACE is doing: measuring sea levels. It wasn’t designed with that as its primary mission. But anyone doing that keyword search can clearly see that Jackson is just tap-dancing around the fact that he’s been proven wrong again.
Jackson is the same guy who tried to argue that CO2 doesn’t help plants grow. And he linked to a paper on nitrogen, hoping to make a lame point about CO2, and similar nonsense. Several readers set him straight. He’s new to the “dangerous man-made global warming” narrative. He has no apparent science background; just about all his comments are based on internet and alarmist blog searches.
Jackson thinks he understands the subject. He doesn’t. It’s just his new eco-religion.
“There are hundreds of hits ”
…
Good response for someone that depends on Google for their understanding of a complex topic.
..
Stealey…..the name of the mission is “GRACE”
Guess what the “G” in GRACE stands for?
Gravity.
..
The pair of birds are measuring the perturbations in the Earths gravitational field. They are not measuring sea level.
…
Here’s a simple experiment for you to do if you have sensitive enough instruments.
..
Get two identical containers and fill both with exactly the same amount of water.
Heat one of the containers to 180 degrees Fahrenheit. Now measure the mass of both. The mass of the tow are the same, but the hotter container has a larger volume due to thermal expansion.
…
So when the pair of GRACE birds fly over a “hot” ocean, they don’t see any change in mass, but when JASON flies over that same spot, it notices that the level of the sea has risen due to the thermal expansion.
..
Now, how much simpler do I have to make it for you so that you’ll get it?
Wayne Delbeke
..
And can you tell all of us what the accuracy of a satellite based altimeter is?
…
Oh….and do you need a refresher on the effect of the number of observations on standard error?
Joel – Satellite measurement accuracy and precision has been covered here many times and is also on the sites which I am not going to bother to look up. But to answer your question from memory: 2 mm +- 10 cm
Or there abouts … but try dragging a tape measure that far. 😉
Joel, if you drop a tape measure every 200 m (I think that the swathes were 200m x 200 m) it might land on on top of a wave or at the bottom. You can’t assume that all measurements will average out to the true average to the nearest mm.
Some swells are 30m high and we are talking about a rate of a few mm a year, 1/10 000 of this. On top of that, the theoretical uncertainty for a measure to a flat surface is 25 mm.
As for Grace, the data collected is used to infer things like the geoid or shape of the oceans in the absence of waves when combined with altimeteric data
“Before GRACE, these determinations were limited by nearly 20-30 cm inaccuracies in the knowledge of the geoid. With geoid errors now reduced to near 1-cm at long-wavelengths with the GGM02 models, independent altimetric knowledge of the surface ocean currents has dramatically improved.”
So with just altimetry, the uncertainty was nearly the whole 100 year change (and 3 times that of the measured change) but improved using GRACE. Your whole argument that the error in GRACE is irrelevant is quite stupid.
J. Jackson says:
“GRACE is not measuring sea level… Got it?”
There’s only one person here who doesn’t get it, jackson. That’s you. You’re arguing with everyone else, and just about every commenter here has far more understanding of this subject, and of the general “man-made global warming” debate than you. You could learn a lot here, if you would just listen to people. There are scientists and engineers here. What’s your science background? Anything?
I worked in a Metrology lab for more than 30 years, designing, calibrating, testing and improving weather-related instruments, and calibrating Mass. We got all the current literature from equipment vendors, and I can recall the shift from the ‘global cooling’ scare to the ‘global warming’ scare.
It is very clear to knowledgeable folks that you’re winging it. You made the mistake of originally writing: “GRACE is not measuring sea level.” Now you’re scrambling around trying to justify that error. You’ve done the same thing repeatedly in various other comments. You’re somewhat of a newbie on these subjects, and others can tell when you’re blowing smoke.
If you really are interested in learning about any particular subject, whether it’s CO2, or ocean ‘acidification’, or sea level change, all you need to do is use the WUWT search box and put in the keyword. Or if you want a random overview, try “Eschenbach” or “Middleton” or “RACook” or “MacRae”. There are lots of other knowledgeable folks here, too. You could really learn a lot, if you wanted to. But you’re not learning anything when you’re telling folks the way you think it is. You’re mistaken about the basics far too often.
I suspect you’re just here to run interference. When you’re the only one on your side of the argument, it would be wise to try and figure out why. But if you’re really just interested in running interference, you’re going about it the right way.
(Comment deleted. commenter using fake identity, deleted per WUWT policy –mod)
jackson sez:
I will repeat…
Repeat it all you want. No one else agrees with you.
Hey, that’s a new ‘consensus’! ☺
As expected, you can’t explain it.
…
I also know why you can’t explain it.
..
Because there is no way to determine sea levels from gravitational anomalies. ..
…
Gee DB, I should have realized that you are unable to admit you were wrong.
jackson says:
As expected, you can’t explain it.
LOLOL!! I’ve forgotten more that you’ve ever learned about this subject. You just got pwned because you’re trying to climb down from your error. Keep tap-dancing, it amuses the adults here.
As far as explaining goes, lots of commenters have helpfully tried to explain reality to you besides me, but your mind is closed tighter than a submarine hatch. Why waste time trying to explain something you won’t ever understand? Globaloney warming is your religion, and we know how that works.
If it sounds like I’m LOL at you, you’re right, jackson.
BTW… what’s your scientific background in? Scientology? ☺
I was right, you can’t explain it.
Jackson says:
I was right, you can’t explain it.
You forgot to add: “neener”. Isn’t that the grade school taunt? FYI: you haven’t been right about anything yet. Haven’t you read the comments from other readers?
I explained to you that I calibrated Mass for many years. From your comments I very much doubt if you even know what that means. But from our instruments I could tell which side of our windowless building faced the mountains, and which side faced the ocean. There’s far more to it than you understand.
If you had a good attitude, I would be happy to explain. But you have a very immature attitude. You were flat wrong about GRACE. But before you were corrected by multiple commenters here, you had mistakenly claimed that GRACE doesn’t measure sea levels — and you added that I had completely ‘lost all credibility’ for pointing out something factual that you diidn’t know at the time. I showed you how to easily get hundreds of links corroborating it, too. I think it’s pretty clear which one of us lacks credibility.
Now you’re backing and filling, trying to repair the damage. Good luck with that hopeless task. But if you think I’m going to waste my time explaining something that’s beyond your understanding, you’re even more foolish than I thought. The internet is a big place. You can start your search with “calibration, Mass”. Me, I don’t have to. It’s something I was paid well to do.
BTW — how’s that resume coming along? What’s your professional scientific qualification? Got any? Or do you just build mud huts for people you can feel superior to?
Post that CV, Jackson. IF you’ve got one. ☺
(Comment deleted. commenter using fake identity, deleted per WUWT policy –mod)
jackson sez:
“Still can’t explain how to measure sea level with the measurements of the perturbations of a gravitational field?”
Of course I can. Many others here can easily explain it to you as well. It’s right in the links I provided, too. But it amuses me to see you so demanding, so it’s my pleasure to say, ‘No’.
“I don’t care what others have posts, I want to see what YOU have to say about it. Heck with all that fancy calibrations you’ve done, I’ll bet you could tell us how it’s done is less than six sentences.”
Maybe so. But as I said, it amuses me to watch you impotently demand that I must do what you want. Ain’t happening. I’ll make a small prediction: you will claim that just because I don’t cater to your demands, that I can’t explain. heh, I read you like an open book.
“I have a very mature attitude.” Stop it! You’re killing me!! ☺
“…tell us how the satellite measurements of the changes in Earths gravitational field tells us about sea level.”
LOL!! No. You like to do internet searches. Go find out for yourself. Do your own homework.
“Stop squirming…”
As if. I seem to be watching you do plenty of squirming here.
“I believe you know enough about it to understand that you’ve been painted into a corner.”
Are you that unoriginal and lame that you have to copy my idioms?
“Again, for the record, GRACE does not measure sea level. Now prove me wrong.”
I already did. Repeatedly. And several other commenters proved you wrong, too. You just can’t accept it because of your eco-religion. Sad. But amusing.
Now, make some more impotent demands. This is fun! Because of your immature attitude I take pleasure in refusing to do what you insist. That will continue until you get a much needed attitude adjustment.
Oh, and where’s that science background I keep asking you for? You’re big on asking questions. But you always dodge that one.
Max,
The total amount of CO2 (derivatives) in the ocean are of no interest, only the CO2 pressure at the surface for the current temperature is. If you shake a Coke bottle of 0.5, 1 or 1.5 liter from the same batch at the same temperature, you will find app. the same pressure under the cap.
That makes that an increase of 1°C in sea surface temperature, the natural (steady state) equilibrium will increase with about 8 (4-17) ppmv in the atmosphere:
http://www.ferdinand-engelbeen.be/klimaat/klim_img/upwelling_temp.jpg
(here plotted for 16 ppmv/°C)
That can be reached with only 17 PgC (GtC) from the oceans. Meanwhile, humans have emitted near 400 Pg carbon and the atmosphere increased with 230 PgC…
You also need to look at the heat capacity of the oceans 1000 meters deep. To warm then 1ºC would take a decades of the present net driving force, hence you can have an apparent pause in global warming from a trivial change in ocean mixing condition. Short times like months or even decades can disappear with this heat capacity only to show up decades later. That heat energy only gets out from the surface and atmospheric radiation.
From a mass transport viewpoint, it would be a lot harder to get Henry’s law equilibrium with the atmosphere that thermal transport.
Most climate models don’t handle this ocean atmosphere and ocean mixing coupling very well. We don’t even have good enough data sets to fully model the thermal/salinity of the oceans so the models don’t include the huge time delays induced by minor changes in mixing of the oceans.
Sorry!
To take a quote from the article: “it is appropriate to cease all CO2 abatement programs that are not cost-effective” is simply not valid.
There is NO “cost-effective” CO2 abatement program because CO2 removal is 1: ineffective for any purpose, with the exception of killing plant and animal life on the planet. and 2: A waste of tax and other money in any amount, starting at 1¢ or any similar currency equivalent.
Cenovus has a CO2 flood of an oilfield at Weyburn Saskatchewan that is apparently economic.
But there are few such examples.
So far maybe, but the costs were calculated when oil was $100+ /bl.
Any new figures??
Tom, you are correct. CO2 control methods aren’t effective, they’re defective.
Tom and beng – Do you disagree or agree with my point 4 above? Seems to me you agree.
4. …CO2 abatement and sequestration schemes are nonsense.
Slim – the Cenovus CO2 flood has been operating since the year 2000. What was oil price then? But I agree the economics of similar schemes look unattractive today.
CO2 abatement programs would be effective in shifting a huge pile of the public’s money to politically connected individuals and corporations. The entire AGW furor has also been quite effective in doing the same for AGW researchers who are willing to toe the politically correct line. Cost effectiveness depends on whether you are the payer or the payee.
MacRae writes: “CO2 falls during the Northern Hemisphere summer, due primarily to land-based photosynthesis, and rises in the late fall, winter and early spring as biomass decomposes.” ?w=641&h=434
..
The exact opposite of what is happening to global temperature
..
..
Allan,
Pay no attention to the site pest. That chart only shows temperature. Your comment was about CO2.
Thank you db – I hope you are well.
Joel Jackson is amusing – is this the best argument the warmists have left in their bag of tricks?
Then all the greenhouse operators on this planet are wrong – right Joel?
Please post more drivel Joel – your humour is much appreciated. 🙂
There is also the satellite evidence of the greening of the whole planet, including and especially in arid and semiarid locations.
Plus all of what we know from Earth history, particularly periods such as the carboniferous, in which high CO2 levels led to spectacular rates of plant growth for tens of millions of years, all over the planet.
I wonder if Mr. Jackson supposes that the laws of physics or the chemical properties of the relevant substances were different back then?
You have just proven that CO2 has little to no effect upon Global temperature. Collect your Nobel Prize.
Well, That is an interesting presentation which, if correct, would make the CO2 monster look like the CO2 droplet… The difference of changing the feedback being from being very Positive to very Negative makes the CO2 monster a drip… The lag so nicely shown makes it impossible for it to be anything but caused by something else.
Just to add to the mix:
“Oxygen May Have Thawed Antarctica in Dinosaur Times” Why weren’t the dinosaurs frozen?
Poulsen and his colleagues found that there was indeed a factor that warmed the Cenomanian climate: oxygen.
The models, then, were getting the Cenomanian wrong. Some factor, not represented in climate models, had played an important role in the climate 100 million years ago and warmed Antarctica. The troubling undercurrent to the puzzle was: Could that factor also be affecting future climate change?
http://www.scientificamerican.com/article/oxygen-may-have-thawed-antarctica-in-dinosaur-times/
Wasn’t Antarctia situated a few thousand Kms North of its current location 100million years ago? Something that would leave it naturally much warmer without having to look at gas concentrations for explanation
“…..few thousand Kms North of its current…”
Maybe they forgot to model that.
I have always wondered why Scientific American articles (and Discovery) assume that the continents have ALWAYS been in the same place. The articles show the globe as it looks today, and then describe things that occurred hundreds of millions or billions of years ago. e.g. Snowball Earth. Have these authors not heard about plate tectonics?
The closing of the isthmus at Panama seems to have led to the current situation in which the planet has long stretches of glacial conditions interspersed with brief interglacials periods.
Even without moving Antarctica, the south polar region can and has been much warmer than it is now.
Umm……….No
It’s been there a while but everywhere else has left it…..
http://ftp.earthbyte.org/Resources/Pdf/Matthews_105-100Ma_event_EPSL2012.pdf
One important difference between then and now is that there was no circumpolar current and that would affect climate significantly
Oh no, now they will complain about OXYGEN and demand we have less.
Right on. Now we will have a new group of “Alarmists” with their hand out wanting to set op OCS [Oxygen Capture and Sequestration]
Slim,
I have this dynamic process that does just that which I will sell to the highest bidder for a healthy sum. I can only give a brief outline though but it goes like this – ANIMAL RESPIRATION.
The key to oxygen capture is to grow more animals!
No problem because if we sequester CO2 we will be getting rid of two oxygen molecules for every Carbon molecule we put under ground.
No problem because if we sequester CO2 we will be getting rid of two oxygen molecules for every Carbon molecule we put under ground.”
“Carbon molecule?
Do you mean a CO2 molecule?
If so, then this is incorrect, because a molecule of CO2 has two atoms of oxygen, just like a molecule of O2 has.
Anthony, why do you not have an opinion about Allan MacRae’s post? It appears to be so simple?
Although not a scientist, I have read a great deal about whether man-made CO2 drives climate change and have learned the following two things:
1. Each year, Mauna Loa data show that CO2 concentrations in the atmosphere are on average 3% lower in Aug/Sept/Oct than they are in Feb/Mar/Apr. This happens every year without fail. This means that, in the short term at least, seasonal temperature variations are causing changes in CO2 concentrations – not the other way round! (Unless you claim that annual changes in CO2 cause the seasons to change!)
2. Analysis of ice core data back through hundreds of thousands of years shows the same thing – that changes in temperature happened first, followed years later by changes in atmospheric CO2.
In other words, in the short-term and in the long-term, there is a correlation between atmospheric CO2 and temperatures but the cause and effect relationship seems to be the opposite of what the ‘alarmists’ are saying.
These two simple facts, which I believe are accepted by everyone, seem to prove that CO2 does not drive temperature change, rather it reacts to it. In other words, CO2 is the dependent variable, not the independent variable, and the ‘alarmists’ are therefore wrong.
This logic is so amazingly simple feel I must be missing something – otherwise all the smart scientists on this blog would be talking about this every day.
Would one of said smart scientists please explain where I am going wrong?
I have also learned in my high school physics class that all electromagnetic radiation travels at the speed of light. The ‘warmists’ say that CO2 is a ‘radiative’ gas that absorbs and emits long wave radiation and warms the planet by reflecting back LW radiation emitted by the earth’s surface. On the face of it, this sounds plausible. However, since LW radiation travels at the speed of light, no matter how many times it is reflected back and forth, in an instant it is gone (into space). It strikes me that rather than warm the planet, CO2 is busy stripping heat out of the atmosphere at the speed of light!
Could it be the boring O2 and N2 molecules in the atmosphere that are actually retaining the heat by acting as a blanket? In other words, what the ‘warmists’ are saying is again the opposite of what is actually happening?
Could this mechanism help explain why CO2 is really the dependent variable?
Again, I am not a scientist and I know we are not supposed to question the radiative physics behind the greenhouse gas effect but can one of the real scientists here explain where I am going wrong with my high school physics? Thanks.
@ur momisugly Bernard Lodge; You have it exactly correct.Carbon Dioxide does not act as a greenhouse in preventing heat lose. Oxygen and Nitrogen act to prevent heat flow as insulators, A real greenhouse effect!
CO2 is a plant food, not a greenhouse gas. Max Planck proved this in 1906. pg
Hello Bernard Lodge,
The seasonal variation in CO2 concentration is (as far as we know) due to actions of the biosphere, rather than being temperature driven. The seasonal CO2 uptake/release by plants (more accurately, the biosphere,) is not that difficult to observe/demonstrate.
in re your point about the speed of LWIR radiation… the way I look at CO2’s effect on LWIR radiation, is to see its effect as an electronic time delay circuit, and it isn’t much of a delay.
Bernard, also note that the seasonal global average T flux is due to complicated solar insolation factors and albedo changes. The earth receives about seven percent more insolation in January, but global T lowers due to increased NH albedo, and increased absorption of solar energy into the oceans in the SH. In both cases the atmosphere is denied energy.
Is the earth gaining or losing energy in the SH summer?
Good question.
It’s a fair question, deserving a fair answer. Let’s start with exactly what you said.
Interesting, that you used the term “reflected”, which kind of implies CO2 acting as a mirror, which it does not.
What really happens is this:
A molecule of CO2 (or H2O) absorbs an IR photon. this increases the energy of the molecule resulting in the molecule going into an excited state. Now, two things can happen to this excited state.
A) The excited molecule can collide with another molecule and transfer some of it’s energy to that second molecule. Note here that the second molecule can be anything including O2, N2, H2O or even a solid surface. At this point, the original molecule no longer has enough energy to emit an IR photon, so that avenue of energy loss is closed. The molecule is now constrained to lose energy to other molecules via collisions until it is back in thermal equilibrium with it’s surroundings. All of these collisions, transferring energy, is actually the definition of heating. This is the molecular basis for converting IR energy into heat, and the process is called thermal relaxation.
B) The second mode of relaxation of the excited state is simply that the molecule emits an IR photon at the same, or very nearly the same energy. This process is called radiative relaxation. Note here that there is a definite time between the IR photon absorption and emission. This time is called the excited state lifetime. (The concept of the lifetime also applies to thermal relaxation, above)
Now, For The Money:
Pathway A, thermal relaxation far dominates over pathway B, radiative relaxation. That is where you get your atmospheric heating from IR radiation.
Now, for the sake of completeness, there is one other interesting process which can occur. A molecule in the ground state can undergo collisions and gain energy. Occasionally the molecule will gain enough energy to attain the radiative excited state, at which point it may emit an IR photon. It is this process which gives rise to the notion of IR active molecules as radiators which cool the (upper) atmosphere. We will note here that energy distribution among all the molecules is statistically described (the field of Statistical Mechanics). Most molecules will occupy the broad middle, close to thermal equilibrium. Out on the wings, there will be a few molecules which are really cold, and a few which are really hot. The cold ones do not do anything interesting, but the hot ones are an IR light source. Now that is interesting.
Back to your mirror:
Suppose we could build a molecule which, when in a radiative excited state, was forbidden from transferring energy via collisions. In other words, once excited, the molecule would stay in the excited state until it emits a photon. One photon in, one photon out, eventually. Because molecules are constantly spinning, tumbling and vibrating, the emitted photon would take off in a direction with no relation to the direction of the incoming photon. So your “molecule as mirror” would act like some crazy fun-house mirror (scattering, actually) with a time lag.
This was a long reply, but we see this question come up often here, so maybe it is worth it.
Smiling at the IR absorbtion description. You could describe it with waves instead of photons, with absorbed energy causing a molecule to vibrate at a higher frequency. Seeming as the double slit experiment doesn’t resolve the wave/photon issue in any that makes any rational sense, it’s probably better just to talk in terms of absorbing electromagnetic energy. Either way the same basics of the above description apply to radio, microwave, visible, ultra violet, x-ray! N2 and O2 may be poor absorbers of IR but they absorb at other frequencies and thus warm directly from the sun as well, heat being registered as they bump into other molecules as described above.
TonyL
Thanks for that clear explanation.
The part about Bernard’s posting that has bothered me over a long period of time is that the process is dynamic not static as the CAGW folks would like us to believe. Accepting the theory that the CO 2 molecule initially “captures” the IR radiation for the earth surface, we know that as you described that energy is quickly transmitted to other molecules by collision or radiation to a lessor extent.
The energy transfer process does not stop there: however, as this “extra” energy is supposedly “radiated” both to outer space and back to earth, but of course the earth will again radiate part of that energy back into the atmosphere, etc. etc.
Is the entire dynamic process understood or is it just conveniently ignored in the simple explanations? Of course not all the energy from the initial capture by CO 2 does not remain in the atmosphere. How much? I also suspect the overall transfer is very rapid as described by Bernard even if the mechanism is primarily collisions.
It is not unlike the financial effect of a tax cut which is misrepresented by a certain group that fail to acknowledge that it is dynamic, not static in it’s effect on the economy. .
@ur momisugly Catcracking:
Both, big time. Excited states and their relaxation processes, including the kinetics thereof, have been studied to death. At one point, it seemed that spectroscopy people did little else. As far as simplifying things, we sometimes see in ClimateScience!, explanations which leave you wondering if the researcher has mastered the basics.
As far as how much heat is retained, I think almost all the energy is retained as heat. First, remember that thermal relaxation beats out radiative relaxation by orders of magnitude. Second, the lower atmosphere is optically dense. An emitted photon, as rare as they are, just does not get very far. For practical purposes, the lower atmosphere is just about closed to radiative cooling. Now we really get to the fun part. The greenhouse is made of water vapor, and CO2 is just a bit player. In the tropics, with lots of water vapor, radiative cooling at night is minimal. In the desert, with minimal water vapor, people remark on how cold it gets at night. But still, the rate is very small. We started by talking about excited states and relaxation processes which occur on the timescale of nanoseconds or microseconds, and end up with a final process measured in hours. That is a pretty good definition of “retained”. Also we want to remember that when we jump to the hours timescale, another process becomes significant. That process is convection. Convection is really how the lower atmosphere sheds heat. Add water vapor to convection, and look out below. Especially in the tropics.
There is also a matter of distance from the sun difference in summer and winter that is not shown in the graph. They have also recently learned that the microbes, bacteria, mold, fungi, in the soil have a massive effect upon the release of CO2, many more times than was previously considered, which has not been accounted for in the Sacred Climate Models.
TonyL
A welcome elucidation indeed, thanks.
Can you provide a reference for your statement that thermal relaxation far exceeds radiative relaxation?
When water vapor condenses as clouds, most of the latent heat seems to be released as LW radiation. This is (for example) shown in Earth energy budget diagrams, where upward LW radiation from clouds amounts ~30 W/m2, suggesting that downward LW amounts the same which adds up to ~60 W/m2 from a total of ~80 W/m2 of latent heat; so approximately 75%, leaving ~25% for thermal relaxation.
Some energy budget diagrams here:
http://wattsupwiththat.com/2014/01/17/nasa-revises-earths-radiation-budget-diminishing-some-of-trenberths-claims-in-the-process/
@ur momisugly Franz:
Advanced undergraduate chemistry textbooks. Any that cover introductory spectroscopy. Also a physical chemistry text for the statistical mechanics.
Next you talk about radiation from cloud tops. This is all good and well. As you get higher and dryer, you get less reabsorption of emitted photons and so generate a flux. All that tells you is about the photons that got away, it does not tel you anything about the ones that did not. So you could still have lots and lots of transitions that net to zero, and you just do not see them.
But it is certainly true that as you reduce pressure and temperature, you reduce collisions and greatly enhance the probability of a radiative process. I do not remember the details, except that pressure effects are highly significant. That is one reason I was careful to specify the lower atmosphere. As you go to cloud tops at perhaps 30,000 to 50,000 ft. it is a whole new ball game. Sorry about the sparse info at low pressure, but that is all I got.
TonyL
Thanks again for a quick and clear reply. I agree.
The 30 W/m2 noted in the energy budget diagrams being the amount escaping to space implies that the amount emitted from the cloud tops can only be (a bit) bigger than that, shifting the balance further towards radiative relaxation. At much lower than surface pressure, indeed. Elsewhere i’ve also been reading that latent heat at condensation is shed as LW radiation rather than conducted heat. So that won’t create much of a ‘hot spot’ either.
The interesting part is the fact that the latent heat was largely derived from LW (IR) downward radiation being absorbed by the ocean’s surface, thereby exciting water molecules sufficiently to evaporate. CO2 ‘backradiation’ is fully absorbed in the top millimeter of the water surface, providing an ideal energy source for evaporation rather than heating the oceans. Thus, IR backradiation from CO2 is efficiently converted to latent heat of water vapor and then lifted to cloud altitude by convection, where it is released by condensation as LW radiation of low wavelength. Through this mechanism the ‘dangerous’ IR backradiation at the ocean’s surface is wrapped up as latent heat, to be released right in front of the gate to space. This feedback to additional CO2 is negative in all respects and should largely diminish the no-feedback climate sensitivity of ~1 C° to a fraction of that. The question is how to accurately quantify this feedback.
Frans
As TonyL June 14, 2015 at 7:34 am – stated effectively, it is not known whether “thermal relaxation far exceeds radiative relaxation” . Why he needed to add the ‘put down’ of undergraduate chemistry textbooks when you were asking a reasoned question based on observation that did not accord with his statements I don’t know.
It is apparent that there is a considerable amount of IR released from clouds. This is not affected by ambient temperature as it is latent heat release on condensation and freezing of water. It is the main way that convection and the hydrological cycle leads to loss of heat to space. Considering its importance to the behavior of the atmosphere one would have thought that more attention would be given to it and its workings would be understood in great detail. After all it is probably the same reasoning that the tropospheric hotspot should be there caused by the ‘relaxation’ (conductive / sensible heat transfer). It is shown in all the GCMs but the hotspot is not there and the incurious scientists shrug rather than asking why that should be so, while others try to prove that it is there – even if no measurements show its presence.
Ian W
Yeah this matter would deserve a dedicated thread here on WUWT.
The fact that the ‘hot spot’ shows up in the output of most or all Global Circulation Models (GCM’s) while in reality it’s absent, gives quite a strong indication that condensation in clouds is modelled with latent heat being released more as conductive heat than as LW radiation. Of course it would be highly infavorable for alarmists to repair this, because it would substantially reduce climate sensitivity.
The same goes for the evaporation end of the atmospheric water cycle: is evaporation primarily powered by surface heat or directly by downwelling LW radiation? If the latter, the surface would not need to heat up first. Infrared drying systems are highy effective for water based paints and the like, which means something.
Tony, thanks for a great comment. You should consider a post built around what you wrote. Question: In NE Oregon we had a series of very dry days and nights, resulting in hot day time temps that plunged to the mid 40’s due to radiative cooling. Last night we got down to 37 F. I have flown over the US in daylight from coast to coast. And have driven nearly the same route. The West Coast, Inland Empire, The Rockies, and the high plains desert states are prime real estate for radiative cooling and appears to me to be a significant part of our landscape.
Bernard,
Anthony does not have an opinion, as this is heavily debated between climate skeptics: several, including me, are of the opinion that (near) all current increase of CO2 is caused by humans, and that this has a (small) effect on temperature. Others like Allan are of the opinion that (a large part of) the increase is natural and/or has no effect on temperature.
But to answer your claims: that CO2 changes lag temperature changes, doesn’t exclude that there can’t be a feedback effect from CO2 on temperature. In process terms: as long as the feedback factor is less than 1, there is no runaway effect and both can fortify each other:
http://www.ferdinand-engelbeen.be/klimaat/klim_img/feedback.jpg
With a small feedback both temperature and CO2 rise somewhat higher, no matter if CO2 lags or not…
Human emissions are (practically) independent of temperature and thus may cause a (slight) warming, but that depends of other control mechanisms (mainly the water cycle) that keeps the earth’s temperature within inhabitable borders…
Ferdinand said, incorrectly
“”Others like Allan are of the opinion that (a large part of) the increase is natural and/or has no effect on temperature.”
Correction Ferdinand:
Murry Salby and others believe that the increase in atmospheric CO2 is largely or entirely natural. I have posted many times that I am (almost) agnostic on this question, I wrote you stating this fact as recently as April 12, 2015.
http://wattsupwiththat.com/2015/04/09/how-to-convince-a-climate-skeptic-hes-wrong/#comment-1904964
[excerpt]
“Hello Ferdinand,
I should be more clear on this subject. Based on your last post, we really do not disagree on what I consider to be the important point.
I have repeatedly stated that I am an agnostic on the “mass balance argument”… We agree that ECS is quite low – and that is all that matters at the practical and political level of this global warming debate.”
While fossil fuel combustion increased strongly since the 1940’s, global temperature decreased from ~1940 to ~~1975, increased to ~2000 and has been flat since – so there is a negative correlation, a positive one, and a zero one. I suggest near-zero is the correct answer.
BTW, attempts by modelers to explain the temperature decline in the 1940’s due to manufactured aerosol data are fraudulent nonsense, imo – see my conversation with DV Hoyt on climateaudit years ago.
http://www.climateaudit.org/?p=755
Thanks for your reply Ferdinand. I’ve been struggling to understand your concept that you could have both temperature and CO2 as dependent on each other, at the same time, provided that the feedback factor is less than 1. I tried a few simple math equations and even if the feedback ratios are set very low, I eventually got to a runaway situation if both temperature and CO2 were both dependent on each other at the same time. Kind of like compounding a small annual interest rate eventually gives you a massive number. For example, in your graph, the ‘CO2 with feedback’ line will eventually cross the ‘Temperature with no feedback’ line would it not?
I do agree with you that human emissions are (practically) independent of temperature but any feedback mechanism does not know where the CO2 comes from – it just reacts to the amount of it. If temperature and CO2 were both dependent on each other at the same time and humans then injected some extra new CO2 into the atmosphere, I would expect it would surely trigger a runaway situation. This has not happened in the last couple of decades which indicates to me that CO2 and temperature are not both dependent on each other at the same time.
Bernard,
Sometimes the net has a nice explanation as in this case:
http://www.ask.com/wiki/Positive_feedback?o=2802&qsrc=999&ad=doubleDown&an=apn&ap=ask.com#Basic
I think it would be a mistake to relate an effect that is seasonal with an effect that occurs over thousands of years (point 1. vs point 2.). The origins could be different but the effect the same.
Your point 2 is a more difficult challenge. While CO2 lags temperature it also leads it and also changes at the same time. Why do all of these effects occur?
Finally the CO2 record is not as well sampled as the T record (more time between samples) and the further back in time you go the wider the sampling. Try converting CO2 into T using a linear least squares approach and you’ll see some of these problems.
Steve,
Thanks for the reply. I wasn’t relating the seasonal effect with the long term effect, I was simply observing that they both have the same causation. It seems clear that over the very long term and the seasonal short term, CO2 follows temperature. I believe that is also true for all time periods in-between (see Murry Salby’s work). The mechanisms could be different but the result is the same – CO2 lags temperature. CO2 cannot be an independent variable and a dependent variable at the same time with respect to temperature – otherwise an immediate runaway increase of both would occur – especially if humans are throwing a lot of ‘new’ CO2 into the atmosphere at the same time.
Bernard,
Dr Murry Salby has very similar views about the reverse role of CO2 with a lot of opposition also from the luke-warmers. But that does not mean he is wrong. He’s up there with the best of the real climate scientists.
http://wattsupwiththat.com/2015/04/13/new-video-dr-murry-salby-control-of-atmospheric-co2/
There is also an earlier lecture video by him that you can find in:
http://hockeyschtick.blogspot.com.au/
Just scroll down and you’ll see the video on the RHS margin of the blog.
Frank,
Thanks for the links. Both presentations clearly make the case that CO2 follows temperature across all timescales. Murry Salby has to be admired as a really tough character who just will not give up even when the ‘warmists’ go after him in the worst way. Kudos to him – his presentations will eventually topple the ‘warmist’ case.
The fact that CO2 is the dependent variable means that the ‘alarmist’ message is simply wrong. What we need is a scientific explanation of something this intuitively obvious. Some people seem to think that man-made CO2 is somehow unique and that it does actually drive temperature because it is ‘extra’ CO2. This cannot be true because the feedback mechanism doesn’t know where the CO2 came from. CO2 cannot be a dependent variable and an independent variable at the same time with regard to temperature – otherwise you would get an immediate runaway increase of both.
Frank,
You will find my name repeatedly there as I am pretty sure that Dr. Salby is wrong on several fundamental points. The main problem with him is that he never discusses things out, not even on “friendly” blogs like here at WUWT. Regardless of the way that he was fired by his university, that makes any discussion pretty impossible.
Bernard,
CO2 was the dependent variable for the past 800,000 years and still is for the small variability around the trend. But temperature is not the cause of the 110 ppmv increase above steady state for the current (ocean) temperature, that simply violates Henry’s law for the solubility of CO2 in seawater. The steady state level for CO2 at the current temperature is 290 ppmv, not 400 ppmv.
How much effect the extra CO2 will have on temperature can be debated. In my opinion not much and certainly no runaway effect as the earth has seen much higher levels without a Venus-like effect. Thus while we are fully responsible for most of the increase, the net effect is probably more beneficial than negative.
The more I get into the CAGW debate the more on its face the alarmist camp falls. It’s like a series of pratfalling stooges lining up with more infuriating claims. And logic be damned. Zoom into any CAGW claim and before long the underpayment looks stupid. I’m quite certain the math is also stupid. Every single claim is stupid. It’s too much, I’m so glad that there is a sober forum like this one to help people navigate through the falsehoods that make up CAGW. I now have enough sense under my belt to unseat any alarmist at any given time on each of their stupid points. So thank you Anthony, thank you Lord Moncton, thank you to the locals here at WUWT. It’s comforting to be able to bring calm to my family and friends whole others are subject to the hysteria.
Mother Nature arrested
So the truth is out,
She changes the climate,
Now there’s no doubt!
http://rhymeafterrhyme.net/breaking-news-mother-nature-arrested/
And we thought man was to blame!
+ 1, Owen.
Well said Owen.
Heat-waves caused by FROZEN Jet-Stream that BLOCKS heat
http://icecap.us/images/uploads/mg20727730_101-3_560.jpg
Whether the influence of CO2 on temperature is more important than the opposite one depends on the magnitude of the external CO2 or temperature changes that drive both. One can’t give a “universal” answer “this way” or “the other way”.
It is complete nonsense that the temperature mattered more for CO2 than vice versa in the recent century – it is exactly as obviously wrong assertion as the opposite assertion used for the glaciation cycles.
The coefficients are such that the maximum-minimum difference between the ice age and interglacial temperatures, about 10 deg C, produced about 280-180 = 100 ppm of difference in CO2. That’s when the temperature was primary.
Now, if you take the observed 20th century temperature change below 1 deg C to be primary, the expected change of CO2 should be 10 times lower than in the previous paragraph, i.e. 10 ppm. But we’ve seen over 100 ppm change of CO2. So the CO2 change in the 20th century obviously doesn’t result from the temperature change of the 20th century – it is way too large. An overwhelming majority of the 100 ppm of CO2 was added by other means, by burning fossil fuels etc.
Meanwhile, the CO2 change itself (in the 20th century) produced some temperature change which was vastly smaller than 10 deg C but it was nonzero, perhaps between 0.1 and 0.7 deg C.
If we stop burning etc., the oceans and the biosphere etc. will be absorbing the excess CO2 and within a century or two, the system will get very close to the CO2 concentration determined from the temperature according to the “glaciation cycle” relationship, i.e. close to 280 ppm again. But in the century or two, the CO2-temperature relationship is out of (the long-term) equilibrium and the excess CO2 is caused by direct CO2 emissions.
Lubos Motl
You provide nice series of hypotheses; e.g,
and
and
and
and
It is a pity there is no empirical evidence to support any of those assertions.
We know the equilibrium of the carbon cycle has altered for some unknown reason with a result that atmospheric CO2 concentration has varied, and that is about all that we know.
Richard
Richard,
All known evidence shows that humans are the cause of the recent increase of CO2 in the atmosphere:
http://www.ferdinand-engelbeen.be/klimaat/co2_origin.html
All alternatives I have heard of violate one or several observations, thus should be rejected…
As CO2 is a greenhouse gas, it has some effect on temperature. How much, is a matter of debate. That depends mainly of the feedbacks. Without feedbacks, some 1°C for 2xCO2 (based on Modtran, caused by its absorption of IR). Less with negative feedbacks (as all skeptics think), more with positive feedbacks (as all climate models assume).
And how much of an effect does the warming of the soil and the increased action of the microbes, bacteria, mold, fungi, (and everything else) in the soil have on the increase of CO2 in the Atmosphere?
usurbrain,
The release of CO2 from ground bacteria is included in the seasonal and multi-year oxygen balance: plants use CO2 and release oxygen; bacteria, molds, insects, animals use plants and oxygen to release CO2 for their energy. The total balance is slightly more oxygen release than use, thus the biosphere as a whole is a net producer of oxygen and thus a net sink for CO2. The earth is greening…
Ferdinand
You say to me
Nonsense! Argument from ignorance is a logical fallacy.
There is no evidence – only assertion – that humans are the cause of the recent increase of CO2 in the atmosphere.
Richard
Richard,
You have not shown any possible theoretical solution for a non-human cause of the CO2 increase in the atmosphere that doesn’t fail one or more observations. Human emissions fit all observations. Until you do come with a theory that does fit all observations, you may have a point. Until then it is only hand waving.
Ferdinand Engelbeen
June 14, 2015 at 2:15 am
All known evidence shows that humans are the cause of the recent increase of CO2 in the atmosphere:
—————-
Ferdinand…….such evidence that you claim to be there does not exist actually.
It is only a figment of imagination for people who believe and claim that CO2 emissions are measured or can be measured in ppm(s)…completely ridiculous….. YOU SEEM TO BE A LOST CASE IN THIS ONE.
read this article above over and over and you may just find some hope on being converted to reality.
cheers
@richardscourtney@ferdinand meeus
My understanding is that co2 released into atmosphere from burning fossil fuels is measurable from isotopes, natural vs. fossil. Why would there be any question about the percentages of human induced co2 versus natural?
@ferdinand meeus
Then why do the recent satellite analysis graphics show a much higher quantity of atmospheric CO2 over the rain forests and little (much less than the “Scientists predict) over the industrialized countries.? WHY? How does it get generated by humans in industrialized countries, them move and accumulate over rain forests? HOW?
SHOUTING means you have lost.
Next!
[No. .mod]
Dahlquist
You say
Your understanding is wrong.
The sign of the the isorope change is consistent with the change being a result of emissions from fossil fuel burning (there is a 50:50 chance it would be) but its magnitude is not. The magnitude of the change is wrong by a factor of 3.
This disagreement of the isotope change with the emissions from fossil fuel burning may be a result of dilution (|e.g. Ferdinand asserts it is). However, the best that can be said is
the isotope changes do not conclusively prove the rise in atmospheric CO2 concentration is not caused by burning of fossil fuels.
Richard
Ferdinand
You say to me
More twaddle from you. I have provided no “hand waving” but you provide little else.
I have repeatedly provided possible theoretical solutions for a non-human cause of the CO2 increase in the atmosphere, and there are no data with sufficient accuracy and precision to refute any of them.
Importantly, I don’t know the true cause of the CO2 increase in the atmosphere but you claim to know it.
It is for you to demonstrate your claims are right. To date you have not. I make no claims so there is nothing I am required to demonstrate.
Richard
richardscourtney
June 14, 2015 at 10:29 pm .
Your understanding is wrong.
———–
Sorry richard….
From my point of view and my understanding “your understanding is wrong too”….sorry.
You see, in principle, any way you turn it, the basics and the back bone of the AGW thesis is based in the anthropogenic CO2 emissions and not the anthropogenic CO2 concentrations.
The hypothesis does not rely or care what is the actual probable isotope signature in the overall CO2 concentrations, as to establish how much of it is of the anthropogenic origin, in the overall CO2 concentrations……it strictly relies in the amount of the anthropogenic CO2 emissions. There is no much need for us to calculate that possible amount of emissions by relying in the isotope signature check……
The hypothesis strictly claims that whatever the actual CO2 concentration “nature “, its increment is due to the increase of human CO2 emission due to some kinda of assumed “chain reaction effect” where the anthropogenic emission, through the increment achieve to induce an increased warming which in turn influences the increase of the overall CO2 emissions and therefor the increase of the overall CO2 concentrations.
But whatever the case in ones opinion……the AGW has no any claim or direct connection or a need to rely in something like you may call it as anthropogenic CO2 concentrations……..but actually is a hypothesis totally based in the principle of anthropogenic CO2 emissions.
The main thing that relies on.it is the human G/tonnes of CO2….. not the human ppm(s).
That is how actually a hiatus in temps above a decade long and especially while reaching beyond 15 years, in an actual scenario of a steady continuing increase of the overall CO2 concentrations, ends up very surely easy to disprove AGW .
Without an increased warming, the increase of the overall CO2 emissions and concentration has nothing to do and is not influenced by the amount of the anthropogenic CO2 emissions.
hope you get the point made……
cheers
whiten:
I don’t know where you got this idea
No. The hypothesis adopted by IPCC, Engelbeen and some others is that the anthropogenic CO2 emission is overloading the sinks for CO2 and, therefore, CO2 equivalent to about half the anthropogenic CO2 emission is accumulating in the air.
I don’t believe the hypothesis is right because it is hard to reconcile it with some observations (e.g. the dynamics of the seasonal atmospheric CO2 cycle), but the hypothesis may be right. And if the hypothesis is wrong then that – of itself – is not conclusive evidence that the anthropogenic CO2 emission is not the cause of the recent rise in atmospheric CO2 concentration.
I don’t know the cause of that rise, but I want to know.
Richard
Dahlquist June 14, 2015 at 9:33 am
Sorry, the replies are going quite chaotic here…
Your question about the isotopic “fingerprint” is a good one.
– There are only two known huge sources of low 13C on earth: recent organics and fossil organics.
– Recent organics, the biosphere as a whole, is a proven (from the oxygen balance) net sink for CO2 and preferentially for 12CO2, thus leaving relative more 13CO2 in the atmosphere. Thus not the cause of the observed 13C/12C ratio decline.
– All other known sources are of inorganic carbon (oceans, carbonate rock weathering, volcanoes,…) and have a higher 13C/12C ratio than the atmosphere. Any substantial release from these sources would increase the ratio, while we see a decrease.
The decline of the 13C/12C ratio is about 1/3rd of the theoretical value if all human CO2 would remain in the atmosphere. But as a lot of CO2 each year is exchanged with other reservoirs (oceans and vegetation), the human “fingerprint” is diluted by these exchanges. In fact that makes it possible to calculate the main CO2 flux between the deep oceans and the atmosphere at about 40 GtC/year:
http://www.ferdinand-engelbeen.be/klimaat/klim_img/deep_ocean_air_zero.jpg
where the discrepancy in the early years may be from more CO2 release by vegetation.
usurbrain June 14, 2015 at 9:35 am
There are several huge natural fluxes at work:
– Seasonal: warming and cooling ocean surface and warming and cooling land.
Globally about 60 GtC in and out vegetation and 50 GtC out and in the ocean surface. These huge fluxes are countercurrent and the extra-tropical NH forests are dominant.
– Continuously: The upwelling zones in the equatorial Pacific is a near continuous source of deep ocean high level CO2. The high temperature of the surface releases a lot of CO2 that is again captured near the poles and mainly returns some 1,000 years later via the THC and other deep ocean fluxes. The continuous exchange of CO2 between the equatorial upwelling zones and the polar sink places is estimated at 40 GtC/year.
If the short term high flux over the rainforests is seasonal (dry season in the Amazon?), partly multi-year (El Niño) or not, I don’t know, but that will be clear if more data from the satellite come in.
Human emissions are currently ~9 GtC/year or globally ~4.5 ppmv/year or slightly over 0.01 ppmv/day. Even when most human activity is concentrated in relative small areas and the satellite can focus on a small area for prolonged periods, it will be a hell of a job to measure these small changes.
But you never know. Anyway one need at least a full year of data to separate seasonal influences from more permanent sinks and sources…
Hi Lubos – I hope you are well.
Please re-read what I wrote. From what I read, you are commenting on something else.
Also note I am agnostic on Ferdinand’s mass balance argument’. Please see
http://wattsupwiththat.com/2015/04/09/how-to-convince-a-climate-skeptic-hes-wrong/#comment-1904964
Best, Allan
How well does the approximate 100ppm CO2 change caused by an approximate 10degC temperature change match up against the seasonal cycle of CO2 concentration and temperature change?
Different mechanisms at work:
Seasonal:
– ~5 ppmv/K
– CO2 and δ13C changes opposite to each other
– Temperature up, CO2 down
– Dominated by extra tropical forests in the NH
1-3 years variability (ENSO, Pinatubo)
– 4-5 ppmv/K
– CO2 and δ13C changes opposite to each other
– Temperature up, CO2 up
– Dominated by tropical forests (mainly Amazon)
Long term variability (MWP-LIA, glacial/interglacial)
– ~8 ppmv/K
– CO2 and δ13C changes parallel each other
– Temperature up, CO2 up
– Dominated by (deep) ocean exchanges.
>> and within a century or two
Lubos, Segalstad et al showed that CO2 will rain out of the atmosphere in 5 – 15 years.
Seems quite difficult to me: the solubility of CO2 in fresh water is very low and most is simply recycled: where most of the water vapor is formed, most of the CO2 is released too. The CO2 concentration in the atmosphere where the rain drops are formed hardly changes and so does the CO2 concentration where the drops fall on the ground and eventually evaporate. Only where (carbonate) rock is involved, some of the CO2 returns as bicarbonate and remains in the oceans for a longer time, but that is a process which needs millions of years to form the beautiful caves we see today…
Ferdinand,
I didn’t say CO2 would be absorbed by rain. Segalstad has pointed out that scientific studies have contradicted the claim that C02 remains in the atmosphere for hundreds of years. As Henry’s Law is “settled science”, it should not be surprising that there are many studies that show that it’s about 5-10 years.
VikingExplorer,
Common problem here: nobody disputes that the residence time of any CO2 molecule in the atmosphere (whatever the source) is only around 5 years: that is the average time one CO2 molecule resides in the atmosphere before being swapped with a molecule CO2 from another reservoir (oceans, biosphere), but that doesn’t change one gram of the total amount of CO2 in the atmosphere, as long as the total sinks equal the total sources. Only the difference between sinks and sources does change the total amount in the atmosphere.
At this moment the total natural sinks are ~2.15 ppmv larger than total natural sources. That means that nature removes ~2.15 ppmv per year out of the atmosphere for an increased pressure of ~110 ppmv above equilibrium. That gives an e-fold decay rate for the excess CO2 in the atmosphere of
110 ppmv / 2.15 ppmv/year = 51.2 years or a half life time of ~40 years.
Thus it takes some 40 years to reduce the current extra CO2 (whatever the origin) in the atmosphere to half, 80 years for a quarter,… After ~200 years most will be gone.
Thus two different times involved: the residence time can be compared to the throughput of goods (and thus capital) through a factory, while the decay rate is a matter of gain (or loss) of the capital at the end of the year…
BS
It’s BS, because the premise was “If we stop burning etc., the oceans and the biosphere etc. will be absorbing the excess CO2 and within a century or two”.
The best scientific knowledge is that Henry’s law is “settled science’, and that the last extra CO2 molecule added to the atmosphere by a human being will be gone about 10 years later.
So, Ferdinand, please stop with the CO2 propaganda and Henry’s law denial. Btw, the length of your reply doesn’t change the absurdity of your argument.
Unless you can show evidence that Henry’s law is inoperative, and that the many scientists involved, including AGW founders such as Keeling and Revelle, were wrong, please just leave it alone.
VikingExplorer,
Henry’s law only shows the endpoint of 290 ppmv for the current ocean temperature, not the speed at which that will happen. Residence time has nothing to do with that speed either. Only the sink rate for the current pressure above the 290 ppmv is what shows the speed at which the endpoint will be reached. That is about 40 years half life time, not 5 years, neither 200 years (according to the Bern model of the IPCC). Thus sorry to disappoint you, but that is simple process knowledge based on real life facts…
Ferdinand,
Actually, you are just parroting AGW dogma without any theoretical support. You’re source is probably skepticalscience, which teaches AGW people how to respond to common references to known scientific information (so called climate myths).
There is absolutely no reason for CO2 to be “bottlenecked” at the surface. It’s very soluble in water, and it’s heavier than water. This myth that CO2 stays in the atmosphere for a long time was actually promulgated by the AGW originators (either Keeling or Revelle). They knew that the whole scam would mean nothing if they didn’t make something up about that. However, because they made the claim, many have attempted to test the hypothesis and it’s always been falsified. This is what all the studies are about that I mentioned earlier.
In fact, Dr. Ball dealt with this non-sense and concluded that the 100-year ‘residency time’ claim [is] politically necessary to support demands for immediate action.
The whole “However, when they leave the atmosphere, they’re simply swapping places with carbon dioxide in the ocean” is pure BS. There is no scientific reason for a CO2 molecule that has been absorbed by the cold ocean near the poles to cause a CO2 molecule to be ejected. That’s violating Henry’s law.
How fast does Henry’s law work? CO2 is absorbed very quickly by water, contrary to your claim of 40 years or the 200 claimed by the IPCC. You can see how fast in this video where the water rises in the glass because CO2 is quickly dissolved.
Henry’s law, as demonstrated by this video, combined with this quote from Dr. Ball’s post leads to an inescapable conclusion:
AGW is impossible.
There are about a dozen reasons why, but each one is sufficient, including this one. Man is incapable of increasing the CO2 level of the atmosphere above what is natural for current climate conditions.
This leads to the conclusion that Global Warming is occurring, but it’s not caused by CO2. CO2 is the symptom. Humans adding CO2 to the atmosphere forces non human sourced CO2 to be quickly absorbed by the oceans to satisfy Henry’s law, while human CO2 stays in the atmosphere about 7 years.
VikingExplorer,
You’re source is probably skepticalscience
Please VE, I don’t need skepticalscience to think for myself. As a retired chemical engineer I know how a dynamic process works. I had a direct confrontation with Segalstad about that topic years ago at a skeptics conference at the European Parliament. He is completely wrong, as good as many other skeptics on that point: residence time says next to nothing about how long it takes to reduce an injection of extra CO2 in the atmosphere.
It’s very soluble in water, and it’s heavier than water.
Why do you think they need 6 bar pressure to give you carbonated beverages? Because the solubility of CO2 in (fresh or acidic) water is not that high. CO2 in the atmosphere is 0.0004 bar, how much CO2 is getting in fresh water at that pressure? You may calculate that yourself, the figure for 1 bar is 3.3 g/kg at 0°C
http://www.engineeringtoolbox.com/gases-solubility-water-d_1148.html
For seawater about 10 times as much CO2 dissolves than in seawater, thanks to its buffer capacity.
That it is heavier than water (which is absolutely not the case, liquid CO2 at 0°C – under pressure – is lighter than water) has nothing to do with its solubility, which is 99% chemical bound, only 1% remains as CO2 in seawater.
There is no scientific reason for a CO2 molecule that has been absorbed by the cold ocean near the poles to cause a CO2 molecule to be ejected.
The swap is not instantaneous, it is over a year: what goes into vegetation in spring/summer decays back into the atmosphere in fall/winter. What comes out of the ocean surface in spring/summer goes back in fall/winter and what gets out of the ocean upwelling near the equator goes down near the poles. All together 20% of all CO2 in the atmosphere is “swapped” in that way each year. But that doesn’t change 1 gram in total CO2 in the atmosphere at the end of the year if there is no unbalance between sinks and sources…
The candle experiment shows:
The water contains calcium ions Ca++, because we initially dissolved calcium hydroxide Ca(OH)2 in the water.
How much Ca(OH)2 was dissolved in that water for the experiment, compared to what is as Ca/Mg bicarbonate/carbonate in the oceans?
Just repeat the same experiment with fresh water and notice how much more time it needs…
Man is incapable of increasing the CO2 level of the atmosphere above what is natural for current climate conditions.
The natural CO2 level for the current (ocean) temperature is 290 ppmv, according to Henry’s law. The 110 ppmv CO2 extra measured today are from alien UFO’s exhausts, I suppose?
Little is absorbed when the drop forms, but when it fall I’d imagine that friction, trubulance, and pressure increase mean lots more is absorbed. Isn’t the pH of rain ~5.5? Why?
Aaron,
Only the partial pressure of CO2 in the atmosphere is important: water is already saturated at the moment that the drops form (1 liter of rain forms from water vapor in ~400 m3 air, the drop of CO2 then is negligible). That is where in general the coldest temperature is. When the drops fall down, the atmosphere in general gets warmer and thus CO2 is released…
Some figures: the solubility of CO2 in fresh water at 0°C and 1 bar is 3.3 g/l.
http://www.engineeringtoolbox.com/gases-solubility-water-d_1148.html
For 0.0004 bar CO2, that gives 1.32 mg CO2/liter rain. That is sufficient to reduce the pH of rainwater, but quite low: even if 1 mm of rain/m2 (= 1 liter rain) drops on the ground and all water evaporates, setting all CO2 free will increase the local CO2 levels of 1 meter above surface with less than 1 ppmv…
It seems as though you are comparing CO2 and T from ice core data with more recent measurements made in the atmosphere and then commenting on the range of their values. How big is the apple compared to the orange?
Steve, there is an overlap of ~20 years between high resolution ice cores (Law Dome: less than a decade) and direct measurements in the atmosphere at the South Pole:
http://www.ferdinand-engelbeen.be/klimaat/klim_img/law_dome_sp_co2.jpg
Moreover, the 8 ppmv/K is middle of the ball park of what the literature says about the solubility of CO2 in seawater (4-17 ppmv/K) according to Henry’s law…
Can someone explain to me why some of the increase in CO2 might not be coming from CO2 that is being transported by upwelling ocean water from (x?) years ago.
I see estimates of overturning circulation from 600 to 800 years to a decade or two or even less from some currents. Look how fast the Kelvin ways transverse the Pacific.
On the other hand, surface circulation around the northern Pacific Gyre appears to be somewhere between 15 and 30 years based on animations and following the formation of the Eastern Pacific BLOB. So, what is the time of deep Thermohaline Circulation.
Does anyone know? I see little information on deep currents lately though I once saw research from submarines and deep neutral buoyancy bouys that suggested the deep ocean circulation is much more complex than it is depicted in most simple graphs.
Further, I wonder what measurements of CO2/Carbonates have been made.
I understood a lot of this information was classified for many years as the information was collected by various military sources.
Just Curious
Thanks.
Even if we may assume that the MWP was warmer than current times, the CO2 data from ice cores only give 290 ppmv for that time, with a drop of ~6 ppmv between MWP and LIA. Thus if anything, if the waters did take ~1000 years (THC estimate) or less, the upwelling would reduce the current levels, not increase them, compared to the uptake by the oceans of today.
There were lots of measurements of DIC (total inorganic carbon) in the oceans over the decades. A nice explanation of the findings can be found at:
http://www.pmel.noaa.gov/pubs/outstand/feel2331/exchange.shtml
and following pages.
Richard,
Human emissions easily fit all observations:
– the mass balance
– the 13C/12C decline
– the 14C/12C decline
– the oxygen balance
– the process characteristics
– the oceans evolution of pH, pCO2 and DIC (total carbon)
As human emissions easily fit all observations and all alternatives that I have heard of, including yours, violate one or more of the above observations, I don’t see any need to “prove” my case, until you come up with a firm established alternative explanation (not a theory) that fits the same observations in all aspects.
so the elevated temperature of the oceans push CO2 into the atmosphere.
we know that CO2 is release by fossil fuel burning and we can see the isotope signature. but the takeaway for me is the possibility of a significant proportion of the rise of CO2 being squeezed out of the environment due the LIA rebound.
what does it mean?
CO2 levels during the MWP were average 285 ppmv, based on the high resolution (~20 years) ice core of Law Dome. The drop of ~0.8°C from the MWP into the LIA was good for a ~6 ppmv drop in CO2 (with ~50 years lag after the main temperature drop).
As the temperature during the MWP was at least as high as today, the increase in CO2 caused by (ocean) temperature is good for maximum 6 ppmv. That is all. Humans emitted over 200 ppmv and the increase is around 110 ppmv over the past 160 years…
And what of the recent increase in volcanic activity?
@ferdinand meeus
Then why do the recent satellite analysis graphics show a much higher quantity of atmospheric CO2 over the rain forests and little (much less than the “Scientists predict) over the industrialized countries? How does it get generated by humans in industrialized countries, them move and accumulate over rain forests?
The ice core co2 data have been questioned and considered to to be pretty far off the mark.
Ferdinand,

It is clear that Henry’s law restricts historic abiotic ocean releases to lunch money.
Yet look at OCO2 (before they suspended the data for “adjustment”):
The data were generated about ten days after September solstice and there is a striking lineation over both land and ocean along the southern tropic where the sun is directly overhead. Most of the production is over land where photosynthetic respiration takes place in the air, but anaerobic respiration is prevalent in soil and marsh areas on land and oceanic photorespiration is also anaerobic. Anaerobic respiration cannot be gauged with Oxygen.
A very interesting question is how much oceanic photosynthetic (and other) respiration can escape directly to the atmosphere avoiding the constraints of Henry’s law. It is also very curious that supposedly abiotic fractionation through the surface membrane from the ocean to the atmosphere is -10 PDB and the return fractionation is -2. Why would they be different?
Perhaps by chance the above fractionations can explain the atmospheric reservoir value of -8 straight away, but not the surface ocean value of +2. I believe this argues against the sufficiency of an ocean/atmosphere 2 box model.
Ferdinand, from your graph depicting overlap of ice core and atmospheric CO2 measurements “the ice core results have been corrected for average system enhancement and gravitational fractionation”. It doesn’t seem right to correct something with respect to something else and then claim it is accurate because it compares well. Moreover, the ice core CO2 measurements may overlap for 20 years but the time spacing between readings on the older core is hundreds of years. We cannot know, therefore, what the natural short-period variation in CO2 is because we can’t measure it thousands (or hundreds) of years ago with 5-10 year resolution. The same can be said for the ice core temperature record. If your sample interval is 50-100 years how can you say that the last 20 years have been the warmest on record when that data variability cannot even be measured in the ice cores (we would need 10 year intervals going back hundreds of thousands of years)?
The natural emission of CO2 is known to be over two orders of magnitude greater than human created CO2. DR Murry Salby’s comment which is pertinent is that you only need to have a small imbalance in the natural to overwhelm the human. The natural is not in ‘equilibrium’ as most objectors contend. That would mean the earth system natural CO2 is at steady state which is plain nonsense.
Steve from Rockwood June 14, 2015 at 11:20 am
The corrections are necessary because in stagnant air the heavier molecules and isotopes are enriched near the bottom of the firn where the air bubbles start to close. The correction is done on the base of the enrichment of the 15N/14N ratio at bubble closing depth for other molecules like CO2 and are in the order of 1% for the CO2/air ratio.
There are ice cores with overlapping intervals, but indeed less CO2 resolution the further you go back in time: ~10 years over the past 150 years, ~20 years over the past 1,000 years, ~40 years over the past 70,000 years and ~560 years over the past 800,000 years. That depends of the accumulation rate and temperature which gives the time the pores still are open between surface an bubble closing depth.
Anyway, the current 110 ppmv increase over the past 160 years would be measurable in every ice core, even with the 560 years resolution of Dome C over the past 800,000 years, be it with a smaller peak of around 30 ppmv. As the reproducibility of CO2 measurements in ice cores is about 1.2 ppmv (1 sigma) clearly measurable.
The temperature (proxy) resolution is better than the CO2 resolution as long as the layers are not disturbed and the amount of sample can be reduced as much as possible (which gets better by the year). The latest temperature record from the Greenland ice core was near yearly for the past 110,000 years… But that also is restricted: the Greenland ice core’s water vapor capture field is mostly the North Atlantic, while the inland Antarctic catch area is most of the SH oceans.
Thus I agree that there is much to wish about the resolution back in time, but the general relationship between temperature (proxy) and CO2 over time within the resolution is remarkably linear, here for the Vostok ice core:
http://www.ferdinand-engelbeen.be/klimaat/klim_img/Vostok_trends.gif
where much of the deviation from the trend is from the (long) lags of CO2 after T warming/cooling which is not accounted for in the graph.
Most of the points made in MacRae’s essay have been quite obvious for a long time.
Here is a quote from
http://climatesense-norpag.blogspot.com/2014/07/climate-forecasting-methods-and-cooling.html
“The IPCC climate models are further incorrectly structured because they are based on three irrational and false assumptions. First, that CO2 is the main climate driver. Second, that in calculating climate sensitivity, the GHE due to water vapour should be added to that of CO2 as a positive feed back effect. Third, that the GHE of water vapour is always positive. As to the last point, the feedbacks cannot be always positive otherwise we wouldn’t be here to talk about it……………………………..
Temperature drives CO2 and water vapor concentrations and evaporative and convective cooling independently. The whole CAGW – GHG scare is based on the obvious fallacy of putting the effect before the cause. Unless the range and causes of natural variation, as seen in the natural temperature quasi-periodicities, are known within reasonably narrow limits it is simply not possible to even begin to estimate the effect of anthropogenic CO2 on climate. In fact, the IPCC recognizes this point.
The key factor in making CO2 emission control policy and the basis for the WG2 and 3 sections of AR5 is the climate sensitivity to CO2. By AR5 – WG1 the IPCC itself is saying: (Section 9.7.3.3)
“The assessed literature suggests that the range of climate sensitivities and transient responses covered by CMIP3/5 cannot be narrowed significantly by constraining the models with observations of the mean climate and variability, consistent with the difficulty of constraining the cloud feedbacks from observations ”
In plain English, this means that the IPCC contributors have no idea what the climate sensitivity is. Therefore, there is no credible basis for the WG 2 and 3 reports, and the Government policy makers have no empirical scientific basis for the entire UNFCCC process and their economically destructive climate and energy policies.
The whole idea of a Climate Sensitivity to CO2 (i.e., that we could dial up a chosen temperature by setting CO2 levels at some calculated level) is simply bizarre.”
In fact even the IPCC itself has now given up on estimating CS – the AR5 SPM says ( hidden away in a footnote)
“No best estimate for equilibrium climate sensitivity can now be given because of a lack of agreement on values across assessed lines of evidence and studies”
but paradoxically they still claim that we can dial up a desired temperature by controlling CO2 levels .This is cognitive dissonance so extreme as to be crazy.
A new forecasting paradigm is required. The post linked above provides estimates of the timing and amplitude of the coming cooling based on the 60 year and especially the millennial year quasi- periodicity so obvious in the temperature data and using the neutron count and 10 Be data as the most useful proxy for solar “activity”. “
Readers should consult the paper, “The phase relation between atmospheric carbon dioxide and global temperature” at the following link:
http://hockeyschtick.blogspot.com.au/2012/08/new-blockbuster-paper-finds-man-made.html
It makes it all clear the relationship between temperature and CO2.
Can someone report if the paper you refer to has any standing, i.e. has it gained any credence, been disproven or just floats around in cyber space?
Humlum e.a. make the same fundamental mistake as Allan here: they try to deduce the cause of the trend in CO2 from the variability around the trend, while these are caused by complete independent processes.
Have a look at the influence of the variability over the past 55 years of accurate Mauna Loa data, assuming 8 ppmv/°C influence of temperature on CO2 variability (via vegetation response). The influence is hardly visible as a small variability around the trend, with some lag after temperature changes.
If we expand the 1985-2000 period, where the largest temperature changes were (Pinatubo, El Niño), the (small) influence of temperature on CO2 levels is better visible.
There you go again Ferdinand – misquoting me again. Please see
http://wattsupwiththat.com/2015/04/09/how-to-convince-a-climate-skeptic-hes-wrong/#comment-1904964
Your fight is others – I am an agnostic on your mass balance argument. I don’t really care about it since it is not critical to the key point, which is:
Since temperature is clearly Insensitive to increased atmospheric CO2, the impacts of increasing atmospheric CO2 are overwhelmingly positive to carbon-based life on Earth, whatever the cause.
And atmospheric CO2 concentration on Earth is dangerously low:
http://wattsupwiththat.com/2015/03/14/matt-ridley-fossil-fuels-will-save-the-world-really/#comment-1883937
WHL
I have no time to run the numbers, but I do not think we have millions of years left for carbon-based life on Earth.
Over time, CO2 is ~permanently sequestered in carbonate rocks, so concentrations get lower and lower. During an Ice Age, atmospheric CO2 concentrations drop to very low levels due to solution in cold oceans, etc. Below a certain atmospheric CO2 concentration, terrestrial photosynthesis slows and shuts down. I suppose life in the oceans can carry on but terrestrial life is done.
So when will this happen – in the next Ice Age a few thousands years hence, or the one after that ~100,000 years later, or the one after that?
In geologic time, we are talking the blink of an eye before terrestrial life on Earth ceases due to CO2 starvation.
________________________
I wrote the following on this subject, posted on Icecap.us:
On Climate Science, Global Cooling, Ice Ages and Geo-Engineering:
[excerpt]
Furthermore, increased atmospheric CO2 from whatever cause is clearly beneficial to humanity and the environment. Earth’s atmosphere is clearly CO2 deficient and continues to decline over geological time. In fact, atmospheric CO2 at this time is too low, dangerously low for the longer term survival of carbon-based life on Earth.
More Ice Ages, which are inevitable unless geo-engineering can prevent them, will cause atmospheric CO2 concentrations on Earth to decline to the point where photosynthesis slows and ultimately ceases. This would devastate the descendants of most current [terrestrial] life on Earth, which is carbon-based and to which, I suggest, we have a significant moral obligation.
Atmospheric and dissolved oceanic CO2 is the feedstock for all carbon-based life on Earth. More CO2 is better. Within reasonable limits, a lot more CO2 is a lot better.
As a devoted fan of carbon-based life on Earth, I feel it is my duty to advocate on our behalf. To be clear, I am not prejudiced against non-carbon-based life forms, but I really do not know any of them well enough to form an opinion. They could be very nice. 🙂
Best, Allan
Hi Allan,
Seems I missed your latest reply there…
OK, but I still disagree with your position: even if CO2 variability follows T variability, that is only true for the noise around the trend over the past 160 years. That is not true for the 110 ppmv increase itself, which isn’t caused by temperature. Thus at this moment CO2 leads the temperature with 110 ppmv above steady state for the current temperature.
Where we agree is that the influence of the 110 ppmv increase on temperature is minimal, anyway far below what the climate models “project”.
Ferdinand,
The variability around the trend seems important. Arguably as important as the trend. What process affects the rate of change differently than the trend? Why is the match so stunning? Still pondering if derivatives are the same as degrees of freedom, but I don’t think you can make an elephant dance with a second derivative.
Gymnosperm,
The variability around the trend is absolutely unimportant for the trend, because the variability is proven caused by the influence of temperature on tropical forests: higher (ENSO) temperatures cause higher temperatures (and drought) in the forests (maybe also the reason for the OCO-2 observed high emissions there). That is visible in the opposite CO2 and δ13C rate of changes after temperature changes.
But vegetation is a growing net absorber of CO2, thus NOT the cause of the increasing trend. Thus whatever the natural variability (+/- 1 ppmv around the trend, that is all), most of the variability has no influence on the increase at all, as the net result of longer term temperature on tropical forests is rather neutral, most influence is on the higher latitude and altitude forests which thrive better with higher temperatures…
If the mass balance is the counter argument of choice, then it’s toast. Salby’s talk in London shows the mass balance gives the same answer as the T-CO2 correlation.
JR,
Not only the mass balance (but how to explain a non-human cause if the increase in the atmosphere is only half the human emissions, so nature is a net sink for CO2…), but ALL evidence points to human as cause of the increase. See for a lot more explanation:
http://www.ferdinand-engelbeen.be/klimaat/co2_origin.html
Ferdinand,
You have the patience of a saint, but you should remember that there are none so blind as those who choose not to see.
Anthony,
Post such as this diminish your blog.
Agree on Steve. Ferdinand did a good job, and Allan got sidetracked heavily.
Not a very brilliant blog entry.
“…but how to explain a non-human cause if the increase in the atmosphere is only half the human emissions, so nature is a net sink for CO2…”
Easy. Atmospheric CO2 is established by a dynamic balance with natural sinks. Thus, there are two ways for the balance to shift towards an increase:
1) Greater input from sources
2) Lesser output from sinks
So, even if nature is a net sink, if it is sinking less than it otherwise would, an increase results.
That is why it is necessary to determine if nature is a net sink on its own, without including the sink response induced by human inputs. If nature is a net source, but becomes a net sink due to the response to human inputs, then it taking less out than it would have if it were not a net source on its own.
I’ve explained this so many times. I’ve shown system responses. I’ve gone into minute mathematical detail. Yet still, you just do not get it.
You simply cannot determine attribution based on this silly “mass balance” argument. It is a very stupid argument.
Ferdinand – you are STILL missing my point – no alcohol for you for a whole week. 🙂
I don’t really care that much about the cause of the recent increase in atmospheric CO2, because whatever the cause, the increase in CO2 is clearly beneficial to humanity and the environment.
As I said in my paper:
“Earth’s atmosphere and oceans are clearly CO2-deficient. CO2 abatement and sequestration schemes are nonsense.”
Steve and Hugh – nice drive-by shooting. Your credentials and facts are?
Bart,
Mathematically, the only way that a natural cause can dwarf human emissions is if the total natural carbon cycle increased in exact ratio with human emissions: that is a fourfold increase between 1960 and 2012. In all other cases, the increase in the rate of change of CO2 can’t be a fourfold as observed, except if there was no natural carbon cycle increase at all.
The evidence in all observations (like the 13C/12C ratio and the residence time) is that there was no substantial increase in any natural cycle.
Allan,
My credentials: Chemist and chemical engineer; 40+ years experience; 15 years of that as a contracted consulting engineer. I am extremely skeptical of claims of extreme warming and consequent catastrophes. I think the overwhelming empirical evidence is that warming will be half or less of what the GCM’s on average predict. I think that it is unclear if there will be a modest net benefit or modest net cost for a rise of 1C from today’s temperatures. There will be no catastrophe.
Data? Are you joking? Ferdinand has provided more than enough data for anyone who can think half-way clearly about the physical processes involved to see the light. The thing that is tragic about this post (and many other similar posts at WUWT), is that it is so fundamentally mistaken that it does not even merit a serious rebuttal; it is a laughing stock. This post discredits legitimate skeptical arguments, and provides an easy target for competent scientists to ridicule all “skeptical arguments”. When Saint Ferdinand the Patient takes the time to (yet again) lay it all out in detail, the same people (plus a few new ones ) continue to offer the same illogical arguments, claiming always that adding CO2 to the atmosphere doesn’t increase the concentration. The claim is preposterous on its face. I am shocked that Anthony continues to allow this sort of nonsense to be posted on his blog.
No, Ferdinand, that is not the only way. But, I do not see much value in explaining it anymore. I don’t see the point anyway. What is it you are trying to say? That you think it is unlikely? Your skepticism is noted. But, you are wrong.
Shorter Steve Fitzpatrick: Me too! Thanks, Steve. Your umbrage has been noted, and given the weight it deserves.
Steve, you mis-stating my position and then scolding me based on your mis-statements.
Kindly read this 10 times:
“I am agnostic on Ferdinand’s Mass Balance Argument.” It is not a critical element in the debate about humanmade global warming.
Here is a post to Ferdinand written in April 2015. Other similar posts date back to 2008.
http://wattsupwiththat.com/2015/04/09/how-to-convince-a-climate-skeptic-hes-wrong/#comment-1904964
Allan MacRae wrote on April 12, 2015 at 6:51 pm
Hello Ferdinand,
I should be more clear on this subject. Based on your last post, we really do not disagree on what I consider to be the important point.
I have repeatedly stated that I am an agnostic on the “mass balance argument”. Furthermore, I do not even view it as necessary in this debate about manmade global warming.
As I said previously:
“The annual growth rate of CO2 is only about 2ppm. This 2ppm annual growth rate may be primarily caused by fossil fuel combustion (the “mass balance argument”), or it may be primarily caused by other factors either humanmade or natural.
However, this mass balance argument about the Earth’s carbon cycle, while of great academic interest, can be viewed as irrelevant to the question of manmade global warming, because it is clear that Earth’s climate is INsensitive to increasing atmospheric CO2.
It is clear that temperature and other factors drive atmospheric CO2 much more than CO2 drives temperature.”
We agree that ECS is quite low – and that is all that matters at the practical and political level of this global warming debate.
At the scientific level, I suggest that ECS is very low or even insignificant, since the only signal we can detect in the modern data is that CO2 lags temperature.
Allan
Thanks. A nice summary.
Richard
Didn’t we learn in High School that CO2 is more soluble in cold water than warm water, and wasn’t this property of CO2 ingrained further into our understanding in our university beer-drinking days? In my case these times go back to the 1950s and 60s.
Yes indeed, Henry’s Law. But even being generous, ocean temp increases can only explain about 20-30 ppm of the 120 ppm of CO2 rise since 1850. Human burning of oil and coal (and some natural gas, mostly flaring) accounts for much of that difference.
But does the earth’s climate have regulator system (evolved over billions of years), whereby negative feedbacks counter the effects of CO2 forcing, thus limiting (or damping) any subsequent rise in temperature?
The likely answer is yes, and it also likely involves clouds (increased cirrus), increased precipitation (convection) increases, and polar ice changes, that conspire against the CAGW claims to keep global temps relatively stable when forcings are present. It’s not magic. It’s simply the physics of seawater, lots of it.
Let’s not lose sight of the 1%s endgame behind the CAGW/CC hoax:
http://www.wakeup-world.com/2014/08/05/agenda-21-the-plan-for-a-global-fascist-dictatorship/
They want to kill off 95% of your children & grandchildren.
& the suvivors will live The Hunger Games.
John Doran.
The science may not be settled, as the gore ogre so loudly roars, but the politics becomes clearer daily.
http://www.green-agenda.com
Global Temperatures have stopped rising.
CO2 has not.
If the heat is going into the Oceans or the Biosphere then the relationship driving CO2 (with a 9 month lag) should change.
It hasn’t.
This article seems to be wrong, to me.
Look at the graphs I’ve posted below. The rate of change has flattened off to a level of 2ppm/ year If the deep oceans were adapted to the cooler temperatures of LIA, then even if temps are not rising there will still be out gassing as the oceans slowly adjust to a new equilibrium. That will not happen in 10-15 years.
That remaining dCO2 level is probably due to mix of unabsorbed emissions and slow equilibration to centennial temperature change.
What is would criticise in Allen’s article is taking two extremes : inter-annual and millennial, which relate to very different circumstances ( glaciation and massive human emissions ) , equating them and inferring that everything in between must be the same too. I think that is long way from being shown.
Hi Mike and thank you for your work and your interesting comments.
To be clear, I infer little about the intermediate time scales because I have found little or no data that is highly credible
Some thoughts from 2012:
http://wattsupwiththat.com/2012/02/13/do-latest-solar-studies-confirm-upcoming-global-cooling/#comment-891335
In 2008, I wrote that atmospheric CO2 lagged atmospheric temperature T by ~9 months on a short-time-cycle (~3- 4 years – between major El Nino’s?).
http://icecap.us/images/uploads/CO2vsTMacRae.pdf
I also noted that CO2 lags temperature by ~800 years from ice core data, on a much longer time cycle..
I postulated that there could be one or more intermediate (between 9 months and 800 years) cycles where CO2 lags temperature.
The late Ernst Beck had already discussed intermediate lags, and thought the CO2-after-T lag was 5 years.
This post, by inference, suggests we should be looking for a CO2-after-T lag of about 9 years, similar to the period of one sunspot cycle. We have adequate CO2 data at Mauna Loa back to ~1958, so perhaps someone has the time to look for this postulated lag.
Perhaps other longer intermediate CO2-after-T lags also exist – if we have any quality CO2 data to permit analysis (pre-1958, we would probably have to use Beck’s data compilation, which has been treated with inadequate respect, imo).
Regards, Allan
To Allan,
Bring this essay up to at least 2014. 2008 was more than 6 years in the past.
Mikey Mann cuts his data off at 2005, probably because the post-2005 data hurts his CAGW case severely. So don’t be a Mann-coward. Use the current data, and if the data hurts, so be it. It’s called science.
Joel – re your comment “Bring this essay up to at least 2014”:
Please see::
http://wattsupwiththat.com/2015/06/13/presentation-of-evidence-suggesting-temperature-drives-atmospheric-co2-more-than-co2-drives-temperature/#comment-1962254
and other such plots.
The dCO2/dt vs T relationship holds back to 1958, which is as far back as we have modern CO2 data, and up to the present.
Do you really believe this relationship would change in the past 7 years since I wrote my 2008 paper?
Why? 🙂
The repsonse of the alarmists to the discovery that ice core data shows CO2 to be a consequence of temperature was to claim that it is both a driver and a consequence, I fail to see how such a situation could be stable, though.
OK, there we go again…
In essence: one can’t deduce anything about the cause of the CO2 increase by looking at the variability around the increase. All what can be said is that the variability of the CO2 rate of change is caused by the variability in temperature. That causes a year by year variability of the CO2 rate of change of +/- 1 ppmv around the trend, which is currently 2 ppmv/year with human emissions around 4.5 ppmv/year:
http://www.ferdinand-engelbeen.be/klimaat/klim_img/dco2_em2.jpg
In this case it is clear that the variability in CO2 is caused by the influence of temperature variation on (tropical) vegetation. That can be deduced from the opposite variation of the CO2 and δ13C rates of change:
http://www.ferdinand-engelbeen.be/klimaat/klim_img/temp_dco2_d13C_mlo.jpg
where higher temperatures give a temporarily increase in CO2 rate of change, to faster decay and less uptake in the dryer Amazon during an El Niño.
Vegetation is NOT the cause of the CO2 increase in the atmosphere: higher temperatures and more CO2 give more CO2 uptake, thus vegetation is a net, growing sink for CO2, not a source. See:
http://www.bowdoin.edu/~mbattle/papers_posters_and_talks/BenderGBC2005.pdf
In this case, variability and trend have nothing to do with each other, they are caused by different processes. In any case. the variability is mainly caused by temperature variations, but the trend may be caused by temperature or not.
Besides vegetation, the only huge, fast natural source are the oceans. According to Henry’s law, the partial pressure of CO2 at the ocean surface changes with ~8 (4-17) μatm/°C. That is all, no matter how much CO2 in all its forms is in the oceans, only the temperature at the surface counts. That gives that the ~0.6°C warming over the past 55 years is good for ~5 ppmv of the 110 ppmv increase as measured.
The rest of the increase is caused by human emissions, which agrees with all observations, see:
http://www.ferdinand-engelbeen.be/klimaat/co2_origin.html
Ferdinand, thank you for your explanation. However, I do want to inject an idea: when we make claims based on observation, we have to be cognisant of our ability to survey. Any surveyor will tell you their work can only be representative all things being equal, which is an amazing thing to say about the unknown. All things are rarely equal; it stands to reason that I aught to be able to select one subject from a matching pair and survey just the one, I aught to be able to apply my findings to both subjects, all things being equal. We’re talking about chaotic systems and fluidics. When I was speaking about surveying, my experience is with trees. My subjects were much easier to deal with, and yet every day surprised me. How does this relate to ascribing the lions share of modern CO2 accumulation to man? My point is simple, we have observed in very low resolution, and therefore we cannot be certain exactly what we are observing. I’m not interested in fondling a low resolution dataset and dreaming up an image of what it might actually be. Not to say that the low resolution has been misinterpreted, rather it is not absolute. So much climate “science” is offered it makes my head spin. I would prefer it if we made claims relative to the scope.
owen,
Much depends of the resolution of some observation and its global representativeness. For CO2 and δ13C we have direct measurements over the past 55/30 years and ice cores with resolution of less than a decade over the past 150 years, 20 years over the past 1000 years, 40 years over the past 70,000 years up to 560 years for the past 800,000 years, each with a reproducibility of 1.2 ppmv (1 sigma) for repeated measurements.
The current 110 ppmv CO2 increase in 160 years would be noticed in every ice core even with the worst resolution… Ice cores and CO2 measurements in the free atmosphere show global CO2 levels within +/- 5 ppmv for yearly averages, no matter what station you choose, from near the North Pole (Alert, Barrow) to the South Pole…
For the sea surface, in close contact with the atmosphere, there are coralline sponges which show δ13C levels with a resolution of 2-4 years over the past 600 years. Be it local levels (Bermuda in the North Atlantic Gyre), they reflect little change (+/- 0.2 per mil) until ~1850 when δ13C levels start to decline in ratio to human burning of fossil fuels…
Thus all evidence points to humans as cause, even on high resolution scale (>3 years), only the small variability around the trend (seasonal to less than a few years) is caused by the unbalance between uptake and release of CO2 caused by temperature changes…
Ferdinand, you keep posting this “(4-17) μatm/°C” thing but it is a fallacy. Out-gassing is not determined by global averages but by on the spot conditions. The relationship is not linear it is reciprocal and there is a range where it changes from absorbing to out-gassing that much more sensitive to small changes in temperature.
Pause the animation of the AIRS data provided in the article in April 2005: nearly all the strong CO2 areas are in the Arctic in non land regions.
Look at Dec 2004, Jan 2006, nearly all the low CO2 areas are in the Arctic. Same in Jan 2005. This is simply not consistent with boreal forests at lower latitudes being the cause.
April 2006 there, the major ‘hot-spots’ for CO2 are in the Arctic either side of Greenland and reaching across to Norway.
Look at Feb 2003 and Feb 2008 the highest levels are in N.Pacific below the Alsatians and Alaska, the forests of N. Am are down wind of this It is not leaf decay!
July 2003, the strongest CO2 is over the trace of the gulf stream.
You seem to have made your mind up about this long ago and are not even looking any more.
Mike,
Seasonal changes are dominated by the extra-tropical forest, mainly in the NH. That can be seen in the opposite changes in CO2 and δ13C over the seasons:
http://www.ferdinand-engelbeen.be/klimaat/klim_img/seasonal_CO2_d13C_MLO_BRW.jpg
Most of the changes in the polar region are blown in from the mid-latitudes by the Ferell cells.
Over a year or years, most of the large seasonal changes cancel out and what is left is a +/- 1 ppmv variability caused by the influence of temperature changes on tropical vegetation, again visible as an opposite CO2 and δ13C variability. But the CO2 levels in this case are going up with higher temperature, while seasonal they are going down with temperature.
That all is more of academically interest, that are details in the overall CO2 balance: where the exact fluxes are and how these change over the year(s).
More important are the permanent exchanges: If you look at the pCO2 levels over the oceans as based on lots of measurements of ocean CO2 equilibrium pressure, the main sink place is in the NE Atlantic, while the main source places are the equatorial Pacific and the Arabian Sea. See:
http://www.pmel.noaa.gov/pubs/outstand/feel2331/maps.shtml
Besides the ~50 GtC/season exchange between the ocean “mixed” layer and the atmosphere, there is a ~40 GtC/year permanent exchange between the deep oceans and the atmosphere and the deep oceans. The first is fast, but limited to about 10% of the change in the atmosphere, the second is much slower, but has far more untapped buffer capacity via the THC. The 40 GtC/year is based on the 14C bomb spike decay speed and the “thinning” of the 13C/12C human “fingerprint” by deep ocean upwelling which is from ~1000 years ago.
For the surface layer in general, the change is rapid but limited to ~8 ppmv/K per Henry’s law and can be considered as in rapid equilibrium (~1 year) and simply follows (seasonal and intra-annual) temperatures.
For the deep ocean upwelling and downwelling places, Henry’s law is as good applicable, but must be used at every individual local level. Fortunately, one can use an overall rule of thumb, as deep ocean sink and upwelling places are limited to about 5% of the total sea surface each.
The maximum pCO2 at the upwelling places is measured as 750 μatm, that is 350 μatm above the 400 μatm (~ppmv) in the atmosphere. The 350 μatm difference results in ~40 GtC/year CO2 release.
If the ocean surface at the upwelling place increases with 1 K, the local pCO2 will increase with ~8 μatm to 758 μatm and the release of CO2 will increase to ~40.9 GtC/year. The opposite happens at the sink side, as the increase in pCO2 due to higher local temperatures will reduce the CO2 uptake. In both cases the CO2 exchange is directly proportional to the pCO2 difference between ocean surface and atmosphere.
Wind speed does play a role in the exchange speed, but is supposed to be rather stable over the last decades.
Anyway 1 K temperature difference gives an initial change of less than 3% in influx and outflux, which leads to an increase of CO2 in the atmosphere. When the levels in the atmosphere increased with ~8 ppmv, the pressure differences between atmosphere and ocean surfaces again are the same as before the temperature increase and the fluxes are restored at exact the same level, thus nothing happens anymore with the CO2 level in the atmosphere. The new steady state level then is exactly the same as for a static system where there is no permanent up/downwelling of waters…
Ferdinand, thank you again. And yet 3 years, while in climatic terms, seems a decent resolution, it doesn’t capture nuanced flow. There is a whole world of understanding gained as we zoom in to the interactions and reactions. Point a camera at a river for five minutes and shoot video, then switch to photo and capture the image over five minutes. A house could sweep by and you’d never register that event in the photo. A dragon could swoop down and pluck a bathing yeti from the river and you’d never know it happened. When can suggest plausible causation for Co2 rise, but that is not the same as knowing. And this is where we get into difficulty in the CAGW debate; too much time is spent thrusting flimsy data around, poor coverage poor res data! We have to say when it is our best guess. As soon as confidence is achieved we close the book, accept the low res dataset and build a straw house argument. It’s preferable to come to the argument stating the vast margin for error.
I think we need to follow Darwin’s example and spend thirty plus years of studying the data and proofing our results before we jump to any conclusions about how things work. We have lots of competing ideas, but I don’t thing any of them are complete at this time. Proceeding with some caution is appropriate. Nevertheless, I am not worried about a doubling of CO2 in my grandchildren’s children’s life times given the historical variability and the ability of earth to adapt. (More Darwinism)
“Furthermore, atmospheric CO2 lags temperature at all measured time scales.”
Fussing about 9 month phase issues has no relevance to the process which brought CO2 from 280 to 400 ppm. Here is a plot of total C emissions vs total carbon in the air over the last millenium:
http://www.moyhu.org.s3.amazonaws.com/pics/emitsmall.png
For centuries nothing happened. Then emissions began and CO2 in the air rose, at about half the rate.
Nice graph but I am curious how CO2 was measured 1000 years ago. Proxy?
Thanks
Law Dome, Antarctica. High resolution ice core analysis. Air samples stored in ice.
If you believe that graph you are not a scientist.
Steve,
If you don’t like the data, they must be wrong?
Here the CO2 levels measured in several ice cores with complete different accumulation rates and local temperatures:
http://www.ferdinand-engelbeen.be/klimaat/klim_img/antarctic_cores_001kyr.jpg
All just coincidence?
Short term ( inter-annual ) change in CO2 as Allan MacRae points out.
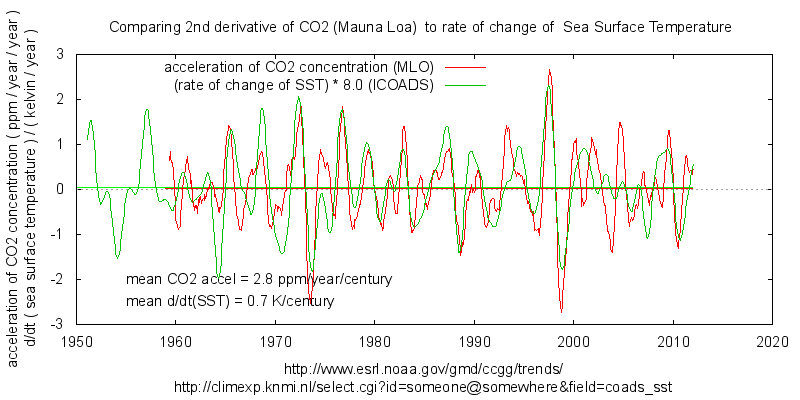
The following graph has been scaled to compare the longer, inter-decadal rise. It seems to match quite well on that scale too, including the post 1990 ‘pause’, though the record is too short for any such similarity in general tenancies to be regarded as statistically significant.
It should also be noted that this scaling shows a background d/dt(CO2) of 1 ppm/year around 1960 and 2 ppm/year post-2000. That can be regarded as another time-scale: centennial. The 800y lag in the ice core record deals with yet another time-scale: millennial. The latter also deals with a flip between two quasi-stable states of the climate system that shuts down a large proportion of life on earth. Thus direct comparison requires caution.
Each of these time-scales presents a different scaling factor of dCO2 and temperature. That seems to have got very little attention in this kind of discussion so far yet will be a key to identifying the processes involved.
The inter-annual relationship can be better estimated by going one step higher in differentials : dT/dt and d2/dt2(CO2). This is the same relationship, the high-pass properties of differentiation help to isolate the inter-annual variation. Since this has also has the annual cycle removed, it is in fact a bandpass filter centred on inter-annual periodicity.
The mean of both series also provides us with the scaling of dCO2 and temperature over the 60 period of the data.
As noted on the graph this provides inter-annual scaling of 8 ppmv/year/kelvin . This value is corroborated by isolating the largest inter-annual swing in the record around 1998.
https://climategrog.wordpress.com/?attachment_id=623
The half century scaling is 4 ppmv/year/kelvin
NOTE THE UNITS: this is ppmv/year/kelvin NOT ppmv/kelvin ,ie. it is that much every year, not overall. This is not the resulting equilibrium level of change but the rate of change.
Now if we look at a slightly longer filter which removes anything faster than 4 year variability we see a similar thing but note that the phase no longer aligns as closely. Here d2/dt2(CO2) lags dT/dt , particularly during the post-2000 pause where it is about 1.5 years where the main variability isolated by the filter has a period of about 10 years, where 2.5 years would put them back in phase.
This is the first indication of a move towards equilibrium. CO2 takes a first step towards being in phase with temperature rather than being orthogonal. This is significant for a couple of reasons.
1. It is in accordance with the kind of relaxation response that would result from Henry’s law and Feck’s law, relating to out-gassing.
2. It is first indication of the time constants applicable to the relationship. During the ‘pause’ there is already a significant shift towards the equilibrium phase response seen on the decadal scale.
The last graph also shows that a large proportion, though not all. the variability on the decadal scale can be attributed to temperature.
This leaves the question of how much of the centennial variation is due to out-gassing and how much to rising emissions. The available data is too short to properly answer this question but this kind of phase analysis can at least confirm the short term dCO2 dependency and gives the first clues as to the time constants of the system.
The averaged acceleration of CO2 over the record is 2.8 ppm/year/century. Warmists attribute this entirely to human emissions ( annual emissions being about twice the annual rise, so they discount out-gassing as negligible and conclude 50% is absorbed. )
However, if we have 8ppm/year/kelvin on inter-annual scale and conclude nothing significant on decadal scale that would imply CO2 equilibrates within ten years. Yet IPCC hypothesises this to be centuries if not millennial.
This is totally at odds with the record.
Mike,
The influence of temperature on CO2 levels is in ppmv/K not ppmv/K/time-unit.
The biosphere in general is absorbing more CO2 with higher temperatures and CO2 levels, thus not the cause of the increase in the atmosphere.
The oceans would be in dynamic equilibrium (steady state) at ~290 ppmv for the current ocean temperature, where ~40 GtC/year is the continuous input from the warm upwelling places in the tropics and ~40 GtC is the continuous uptake of CO2 at the cold polar sink places. Any temperature increase of 1 K is good for not more than ~8 (4-17) ppmv extra in the atmosphere:
http://www.ferdinand-engelbeen.be/klimaat/klim_img/upwelling_temp.jpg
Temperature gives a transient response of the ocean-atmosphere system, not a continuous influx of CO2 for a fixed step response of temperature.
At this moment there is a difference of ~3 GtC extra uptake by the oceans caused by the 110 ppmv extra CO2 pressure above equilibrium. Thus the oceans are a net sink for CO2, not a source.
The ~8 ppmv/K does apply to all periods over the past 800,000 years. Your ppmv/K/time must be adjusted for every period again and is even negative over the period 1975-1995 and 2000-current, that is 35 years of the past 55 years. It gets near zero over the 5000 years of warming during a deglaciation…
Ferdinand
Isn’t your 8 ppm/K calculated from the polar temperature swing? Global temp doesn’t vary that much.
“Mike, The influence of temperature on CO2 levels is in ppmv/K not ppmv/K/time-unit.”
No, that is the equilibrium relationship, not the dynamic one. If you present the calculations that you use to get your 8 ppmv/K it will be clear that it is not valid across all temperatures and thus does not apply to all regions. If ‘average’ regions are fairly stable it is regions that are more sensitive that will show up in the record and have greatest influence.
It is possible that there if covariance with other factors but the correlation of SST to dCO2 can not be dismissed as “noise”simply because it is inconvenient. This is the fallacy behind the whole AGW show: CO2 and temps both generally rise with time ; all the rest is ‘noise’.
The price of bananas has also general risen over that last 60 years, therefore bananas cause global warming ; deviations are ‘noise’ .
It’s like any relaxation response. There is an initial fast change ( the time derivative ) towards restoring equilbrium. Then there is the final offset that results from the change in the driving conditions.
It’s analogous to temps. A change in radiative “forcing” initially induces a *rate of change* of temperature. Then feedbacks coming to play and eventually the system settles to a new equilibrium with a temperature offset caused by the change in radiation.
With a hypothetical step change it is easy to see. In a real, dynamic, ever changing system it is a lot harder to separate the two.
Much of problem with exaggerated climate sensitivity to CO2 is due to exactly this failure to understand the difference between the two and the need to separate them.
Igl,
The short term change is ~5 ppmv/K for (global) seasonal and 4-5 ppmv/K for the 1-3 years variability. Where seasonal the NH extra-tropical forests are dominant, while for the 1-3 years variability the tropical forests are dominant (Pinatubo, ENSO).
For the 8 ppmv/K, the oceans are dominant over very long periods: multi-decennia to multi-millennia as can be seen in ice cores, be it that “temperature” in that case is based on d18O as “proxy” and mostly reflect the SH ocean temperatures where water from the ice cores originated. The Vostok ice core shows a quite linear correlation between CO2 and temperature:
http://www.ferdinand-engelbeen.be/klimaat/klim_img/Vostok_trends.gif
Mike, as explained above, the steady state (dynamic) equilibrium between oceans and atmosphere is exactly the same as for a static system. If you increase the temperature at all places, sources and sinks, the local pCO2 increases with ~8 μatm/K and thus the local influx or outflux changes accordingly. If you change the atmosphere with the same 8 ppmv, the original fluxes are restored and nothing happens with the CO2 levels in the atmosphere due to temperature anymore: that is again at the same (dis)equilibrium as before the temperature change:
http://www.ferdinand-engelbeen.be/klimaat/klim_img/upwelling_temp.jpg
The problem I see is that (too) many here try to explain a 110 ppmv increase from a +/- 1 ppmv natural variability caused by temperature variability which violates Henry’s law, while the elephant in the room, the 200 ppmv human emissions are ignored…
http://www.clim-past.net/9/367/2013/cp-9-367-2013.pdf
Igl,
The Annan work should imply that the 4 K increase caused about 100 ppmv increase or 25 ppmv/K. Seems rather high to me and above Henry’s law for seawater (maximum found in the literature of 17 ppmv/K), while vegetation is a net sink over such periods with expanding vegetation (area and density) with melting ice and higher temperatures…
But even so, that explains not more that 20 ppmv of the 110 ppmv increase over the past 160 years.
Oops, forgot the 4y filtered graph:
https://climategrog.wordpress.com/?attachment_id=254
What is astounding here us that nobody – sorry, shouts <i.NOBODY mentions OCO-2 – a direct measuring and purpose built asset for recording atmospheric CO2.which is giving the modelers at NASA the vapours to the point where they’re very obviously obstructing access to data.
Make of that what you will………………………..
There is no problem with the OCO-2 data, besides that one need to wait for at least a full year of data, before one can have any meaningful conclusion.
The seasonal changes are very huge, about an order of magnitude larger than human emissions, but the seasonal changes largely cancel out over a full year. Thus have some patience…
And your support for the assertion that “there is no problem with OCO-2 data” is ???
Other “A Train” resource satellites are routinely accessible and data is displayed days after a pass…. like Cloudsat
I’m afraid I can’t accept your proffered reasoning. Granted some folk without the requisite expertise might pounce on narrow results and misinterpret them – but – that actually applies in any remote sensing endeavor regardless of timescale and you should know that. It’s a time consuming and frustrating exercise + PITA to walk people through their errors and misinterpretations .
This simply stinks of obstruction and I shudder to think what contortions are happening behind the scenes.
I’d expect some “anomalous results” – for everybody – but the wholesale bust in circulation and distribution morphology already seen makes it look like this data is new and conflicts dramatically with present models – and is from that – of intense interest……
so – no… it’s obstruction – pretty much any other earth observation mission drops eye candy as soon as they can – to keep the trail of interest alive. The silence speaks volumes.
I’d add for the record that $280 million USD was initially spent on this state of the art CO2 mapper and that there;s a community of folk still being paid to gather and process that data …. what is going on?
avon,
Calm down… Indeed some primary results of the OCO-2 satellite are surprising, but the hype I have seen on some blogs that this refutes the whole AGW thesis, based on two weeks of data is largely overblown.
Take the quantities involved: human emissions currently are around 9 GtC/year or ~4.5 ppmv/year or 0.01 ppmv/day. Even if the satellite can focus on one spot for a longer view and most human emissions are concentrated is relative small areas, it will be a hell of a job to separate them from the natural variability. Which can be huge, if there is a lot of vegetation: plants respire during the night and take CO2 in during the day. On a average summer day the local diurnal change can be 150-200 ppmv…
To have some idea of the main sources and sinks over a year, one need at least one full year of data and preferentially several years, as we now have an El Niño year, which is quite different from an “average” year.
Ferdinand Engelbeen – So, are you saying the OCO-2 unadjusted data WILL be released BEFORE the Paris love fest? If so, we should all be patient. If not, we should be screaming bloody murder. GK
[snip – insulting – name calling – rephrase and resubmit -Anthony]