
Image Credit: European Space Agency – CryoSat
By WUWT regular “Just The Facts”
For anyone keeping track, 2013 has not been a good year for those who propagate the Catastrophic Anthropogenic Global Warming (CAGW) Narrative, also know by a litany of increasingly nebulous buzzwords including “Climate Change“, “Climate Disruption”“, “Global Weirding”, “Ocean Acidification”, and “Extreme Weather“. Regardless of efforts to nebulize CAGW to explain all forms of climatic and weather variation, in 2013 every loosely falsifiable prediction of the CAGW narrative seems to have failed. The apparent complete failure of the CAGW narrative in 2013 could make the most fundamentalist agnostic wonder if Mother Nature sometimes takes sides, aka the Gore Effect, but before we praise Gaia, let’s take a look at some CAGW predictions and the associated 2013 data.
Global Temperature:
“For the next two decades, a warming of about 0.2°C per decade is projected for a range of SRES emission scenarios. Even if the concentrations of all greenhouse gases and aerosols had been kept constant at year 2000 levels, a further warming of about 0.1°C per decade would be expected. {10.3, 10.7}
Since IPCC’s first report in 1990, assessed projections have suggested global average temperature increases between about 0.15°C and 0.3°C per decade for 1990 to 2005.” IPCC AR4 2007
“Gulledge says some current projections point to a rise in average global temperature of 0.5°C (slightly less than 1°F) by the year 2030.” National Geographic 2005
“Global temperatures are increasing” NASA 2009
Global Temperatures through November 2013 had not increased for between 8 years and 11 months to 17 years and 3 months. depending on data set and Remote Sensing Systems (RSS) reached 17 years in October, 2013:
 - 1979 to Present")
17 years has significance because in this 2011 paper “Separating signal and noise in atmospheric temperature changes: The importance of timescale” by Santer et al., found that:
Because of the pronounced effect of interannual noise on decadal trends, a multi-model ensemble of anthropogenically-forced simulations displays many 10-year periods with little warming. A single decade of observational TLT data is therefore inadequate for identifying a slowly evolving anthropogenic warming signal. Our results show that temperature records of at least 17 years in length are required for identifying human effects on global-mean tropospheric temperature.
So during the “at least 17 years” “required for identifying human effects on global-mean tropospheric temperature” Earth’s Temperature has been flat/Paused, making it quite difficult to identify any “human effects on global-mean tropospheric temperature”, unless they are of a stabilizing nature. Also, in 2013 “The Pause” in Global Temperature finally received widespread media coverage, i.e.:
“Over the past 15 years air temperatures at the Earth’s surface have been flat while greenhouse-gas emissions have continued to soar.” The Economist “But climate sceptics have focused their attention on the references to a pause or hiatus in the increase in global temperatures since 1998” BBC “Global warming stopped 16 years ago, reveals Met Office report quietly released… and here is the chart to prove it.” Daily Mail “Twenty-year hiatus in rising temperatures has climate scientists puzzled.” The Australian “Has the rise in temperatures ‘paused’?” Guardian “RSS global satellite temperatures confirm hiatus of global warming, while the general public and mainstream press are now recognizing the AWOL truth that skeptics long ago identified…global temperatures are trending towards cooling, not accelerating higher” C3 Headlines
Northern/Arctic Sea Ice
“Arctic Sea Ice Gone in Summer Within Five Years?” … “NASA climate scientist Jay Zwally said: ‘At this rate, the Arctic Ocean could be nearly ice-free at the end of summer by 2012, much faster than previous predictions.'” National Georgraphic 2007
“Arctic summers ice-free ‘by 2013′” … “Their latest modelling studies indicate northern polar waters could be ice-free in summers within just 5-6 years.” BBC 2007
Actually;
“The volume of ice measured this autumn is about 50% higher compared to last year.
In October 2013, CryoSat measured about 9000 cubic km of sea ice – a notable increase compared to 6000 cubic km in October 2012.”
“About 90% of the increase is due to growth of multiyear ice – which survives through more than one summer without melting – with only 10% growth of first year ice. Thick, multiyear ice indicates healthy Arctic sea-ice cover.
This year’s multiyear ice is now on average about 20%, or around 30 cm, thicker than last year. ”
“‘One of the things we’d noticed in our data was that the volume of ice year-to-year was not varying anything like as much as the ice extent – at least in 2010, 2011 and 2012,’ said Rachel Tilling from the UK’s Centre for Polar Observation and Modelling, who led the study.
‘We didn’t expect the greater ice extent left at the end of this summer’s melt to be reflected in the volume. But it has been, and the reason is related to the amount of multiyear ice in the Arctic.'” European Space Agency
The animation at the head of this article and below demonstrates the increase in ice thickness measured by CryoSat over the last four Octobers:
Also, Arctic Sea Ice Extent remained within two standard deviations of the 1981 – 2010 average for the entirety of 2013;

and Northern Hemisphere Sea Ice Area saw its smallest decline since 2006, with a decline less than half of the prior year and it ended 2013 less than .5 Million Sq Km below the 1979 – 2008 average;

Southern/Antarctic Sea Ice:
“A new NASA-funded study finds that predicted increases in precipitation due to warmer air temperatures from greenhouse gas emissions may actually increase sea ice volume in the Antarctic’s Southern Ocean. NASA 2005
“Models solve mystery, but suggest South Pole sea ice melt will soon accelerate.” “The data show that Antarctic sea ice growth in the 20th century might be mostly dictated by natural processes, Liu noted. But that won’t be the case for the 21st century, since human-caused global warming is predicted to dominate the Antarctic climate and trigger faster melting of sea ice, he said.” National Geographic 2010
There certainly has been an increase in sea ice in Antarctic’s Southern Ocean, as Antarctic Sea Ice Extent has been above two standard deviations of the 1981 – 2010 average for much of the 2nd half of 2013;

Southern Hemisphere Sea Ice Area Anomaly reached its 2nd largest positive anomaly in the 34 year historical record on December 23rd, 2013;

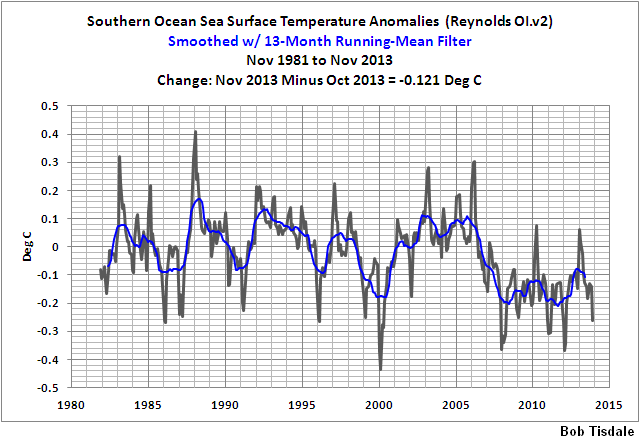
and a Global Warming Research Media Junket Tourist Party Cruise got stuck in thick sea ice off Antarctica, along with its first, second and third rescue icebreakers. Furthermore, NASA’s claim that “predicted increases in precipitation due to warmer air temperatures from greenhouse gas emissions may actually increase sea ice volume in the Antarctic’s Southern Ocean” appears to be falsified in 2013 because Southern Sea Ice has reached near record highs, while Southern Polar Lower Troposphere Temperature Anomaly has had a negative trend and was average;
 With El Nino Call-Outs - 1979 to Present")
and Southern Sea Surface Temperature as been below average for the last 6 years:
The impact of increased Southern Sea Ice Area is that Global Sea Ice Area has remained stubbornly average for all of 2013 and ended the year more than 1 Million Sq Km above the 1979 – 2008 average:

Northern Hemisphere Snow Cover
“Snowfalls are now just a thing of the past” “Britain’s winter ends tomorrow with further indications of a striking environmental change: snow is starting to disappear from our lives. Sledges, snowmen, snowballs and the excitement of waking to find that the stuff has settled outside are all a rapidly diminishing part of Britain’s culture, as warmer winters – which scientists are attributing to global climate change – produce not only fewer white Christmases, but fewer white Januaries and Februaries.” The Independent – 2000
Actually, 2013 Northern Hemisphere Winter Snow Cover was the 4th highest on record;

2013 Northern Hemisphere Spring Snow Cover was highest in 10 years;

and 2013 Northern Hemisphere Fall Snow Cover was the 5th highest on record:

But we mustn’t get complacent:
Scientists are warning that global warming is melting Alpine glaciers at an unprecedented rate.
They claim that in 15 years time, many low level ski resorts could have no snow at all. BBC 2001
It is just a matter of two years until “Low level skiing resorts” in the Alps “could end up with no snow at all” …
Tropical Cyclones/ Hurricanes:
“Expect to see more hurricanes, tornadoes, and blizzards thanks to climate change, scientists say” Daily News 2011
“But climate change is likely playing a role as well—in the case of hurricanes, warming temperatures seem to make storms stronger” TIME May 2013
Global Tropical Cyclone Frequency shows no increase in Hurricanes;

and the increase “Major Hurricanes” appear to be negligible:

Furthermore, “When the 2014 hurricane season starts it will have been 3,142 days since the last Category 3+ storm made landfall in the US, shattering the record for the longest stretch between US intense hurricanes since 1900”:

Tornadoes
“Expect to see more hurricanes, tornadoes, and blizzards thanks to climate change, scientists say” Daily News 2011
Global Warming Will Bring Violent Storms And Tornadoes, NASA Predicts Science Daily 2007
The United States, which“experiences approximately 75 percent of the world’s known tornadoes”, “with 900 tornadoes, 2013 will be 2 SD below the adjusted norm, and the lowest detrended annual count in the long-term record”;

and U.S. Inflation Adjusted Annual Tornado Trend and Percentile Ranks show that the the 2013 tornado count of 802 for 2013 is 142 tornadoes below the historical minimum of 944, 495 tornadoes below the 50th percentile of 1297 and 1082 tornadoes below the historical maximum 1884:

Tornado counts are Detrended/ Inflation Adjusted “because the increase in tornado reports over the last 54 years is almost entirely due to secular trends such as population increase, increased tornado awareness, and more robust and advanced reporting networks.” NOAA – Storm Prediction Center
Blizzards
“Expect to see more hurricanes, tornadoes, and blizzards thanks to climate change, scientists say” Daily News 2011
Now you might be thinking that while CAGW Hurricane and Tornado predictions are looking quite bad, they might be right about the Blizzards part… However, the asserted reason for the predicted increase in blizzards is:
“The Christmas blizzard last year can also be blamed on global warming, which increases humidity in the atmosphere, creating greater precipitation all year round.” Daily News
However, a look at Relative Atmospheric Humidity;

and Specific Atmospheric Humidity;

show no increased “humidity in the atmosphere” and in terms of “Global Warming” “creating greater precipitation all year round”, Global Annual Precipitation Anomalies through 2011:

appear to show the opposite relationship, i.e. there were mostly negative precipitation anomalies during the period of “Global Warming” from approximately 1975 to 1998 and mostly positive precipitation anomalies during The Pause since 1998.
Conclusion
It seems like every major CAGW prediction has failed in 2013. Thus CAGW proponents must be very bad at making predictions or maybe Mother Nature is just showing them who’s boss… Can anyone cite a CAGW prediction that was accurate in 2013? Are there any additional CAGW predictions that failed in 2013?
How about droughts (actually higher in cooling with drier air), and climate refugees, and swamped islands, and collapsed biodiversity, and vanishing poley b’ars? And malarial epidemics? Those are just off the top of my head, I’m sure there’re more.
John from Oz says: @ur momisugly January 4, 2014 at 2:46 pm
Do our politicians ever get to read this stuff? ….
>>>>>>>>>>>>>>>>>
Who the heck do you think came up with CAGW in the first place?
The whole aim of practical politics is to keep the populace alarmed (and hence clamorous to be led to safety) by menacing it with an endless series of hobgoblins, all of them imaginary. ~ H. L. Mencken
Mencken died in 1956 but he sure as heck say CAGW coming,
Jimbo says:
January 4, 2014 at 3:18 pm
Thanks for yet another great compilation.
I don´t want to create a Guardian account to comment, but am surprised no one quoted the always hysterical Jim ¨Boiling Oceans¨ Hansen when instances of CACA advocate hysteria were solicited.
wbrozek says:
January 4, 2014 at 3:33 pm
As a Seahawks fan, I´m glad it´s those guys playing, not Seattle.
Quote: “Can anyone cite a CAGW prediction that was accurate ever?”
They made many predictions that came true.
1) There is a lot of grant money in scaring the crap out of people with this warming stuff!
2) Politicians will have our back since they love to hear that they need to control the people to save the world.
3) The government worshiping MSM will have our back always since they know that politicians love hearing they must act to keep the people safe.
4) There is power and prestige in this global warming propaganda campaign for those willing to do the “new science”.
5) There is tenure and advancement in this.
There is more, but I think you can see that many of the alarmist really did see a bandwagon and got on the thing early. I do not know if they started believing the BS later on; but I wager they did.
Brian H says: January 4, 2014 at 3:01 pm
Mods, Edit:
Weirding in tiltle, not “Wierding”
Corrected, thank you.
“Our results show that temperature records of at least 17 years in length are required for identifying human effects on global-mean tropospheric temperature.”
If they have not done so already I suspect they will come back with something like –
“Seventeen years was the lower bound we estimated at that time. We now have the correct number! It will take exactly 2,443 years of continuous observations to disprove our hypothesis…”
Comment over an hour ago, some-what, not yet represented.
(Thank Apple for the easy screen shots. Censorship helping to prevent censorship. You got to love it….)
Can anyone cite a CAGW prediction that was accurate in 2013?
Do we have 52 climate refugees? It is just a little ironic that they are going from the continent of Antarctica to the island of Tasmania.
The North American winter is rippin’ this year, hope the poor polar bears aren’t turning into Popsicles. This global warming seems to be playing a double game on them.
Reblogged this on Head Space and commented:
… and other pseudosciences
Werner Brozek says: January 4, 2014 at 5:12 pm
Do we have 52 climate refugees? It is just a little ironic that they are going from the continent of Antarctica to the island of Tasmania.
We should have a lot more than that, back in 2005 we had:
In then in May 2013:
If this bitter cold weather keeps up I may consider becoming a climate refugee in Florida… 🙂
Will the footballers be renamed the Green Bay Pack-icers?
No – the frequency and intensity of North Atlantic hurricanes is increasing! The Guardian said so just the other day!
A great summary of all that is wrong with AGW and the true believers.
The only problem is, you’re dealing with true believers – ideologues who stick to their doctrine no matter how forcefully or dramatically it is proven false.
This sort of mentality enters into matters other than climate – for instance, the continuing devotion to socialist and nanny-state policies despite the repeated demonstrations of their failure – and their murderous effects.
Today Professor Chris Turney said “my latest research proves CO2 driven hot-cooling has reached a tipping-point & the day after tomorrow we’re all going to freeze to death. Furthermore, space aliens are coming, they’re unhappy about what we’re doing to the planet and whales”.
Turney added “The space aliens say the only solution is to increase taxes on everything to fund more research into why sometimes it’s a bit warmer than average and sometimes a bit colder. But we can stop wasting money on SETI as the aliens are invisible and will only speak to me, through telepathy”.
Suggestions that Turney was ‘bonkers’, ‘an incompetent fool’ and a ‘liar’ were rejected by his University who said donations for research should be sent directly to them.
Quote: “Can anyone cite a CAGW prediction that was accurate ever?”
I have been looking for nearly 20 years not found one yet.
I am a loyal WUWT supporter but I can no longer comment here due to extreme moderation. I am a “bad guy” because I respect science. My comments are delayed/deleted. Anthooony rejects scientific debate. He allows many folks that support AGW, but he DENIES folks that reject AGW.
WUWT???????
(For the record, this is screen shot.)
[Reply: For the record, we don’t care. And FYI, when you use ‘denier’, ‘denies’, ‘denialist’, etc., your comment is automatically held in moderation. It is posted now. Better take a screen shot! ~mod. ]
[Reply: For the record, we don’t care. And FYI, when you use ‘denier’, ‘denies’, ‘denialist’, etc., your comment is automatically held in moderation. It is posted now. Better take a screen shot! ~mod. ]
You phonies:
1) I did not use the “d” words in the first comment (not represented}.
2) I was never in “moderation” before I emailed Anthonnnnny that the AGW science was documented seriously flawed.
3) Yeah, WUWT no longer “cares”.
4) Suggest you just raise funds from those that do not care. You will be BILLIONAIRES.
I wonder if I will take a screen shot of this comment….4
[Reply: whatever. ~ mod.]
you get the last word, after you delete mine. That new policy might work….
Multi -year sea ice only gets so thick unless it is piled up by the wind.
So should we work to increase global winding or work to end it?
geran,
After you shot your screen did you buy another one?
2013 was indeed a bad year for Warmists. 2014 started off very badly and very early for them too with the Antarctic farce, tourist expedition.
2014 started off with a Christmas present from 2013. It doesn’t get much better than that even [for] the nominally Jewish. Me. Well my mother was Jewish. So there is that.
even for
How much did the seas rise in 2013? Looked about the same the last I checked, but anything less than a cm is hard to detect.